In this study, the research was conducted in three steps. In the first step, the differential expression of RAD50 in normal and prostate tissues was analysed; in the second step, RAD50 expression in HCC patients was assessed as an indicator of progression and prognosis; in the third step, the differential expression of RAD50 was validated in the Oncomine datasets, and GSEA was used to identify the relationships between significant genes and the involved signalling pathways.
3.1. Prognostic role of RAD50 in HCC based on TCGA
As shown in Table 1, in the AHYMUM cohort, increased RAD50 expression was significantly correlated with decreased age (p=0.021), advanced AJCC stage (p=0.001), the presence of multiple primary tumour lesions (p=0.001), the presence of microvascular invasion (p=0.028), the presence of capsular invasion (p=0.015), and increased Okuda score (p=0.009). In the AHNTU cohort, increased RAD50 expression was significantly associated with larger tumour size (p<0.001), advanced AJCC stage (p=0.003), the presence of multiple primary tumour lesions (p=0.010), the degree of pathological nuclear differential expression (p=0.005), the presence of microvascular invasion (p=0.001), the presence of capsular invasion (p=0.003), and higher Okuda score (p=0.008). A chi-square test showed that the baseline data were balanced in terms of the distribution of the categorical data, including gender, albumin level, bilirubin level and the presence of liver cirrhosis (p>0.05).
3.2. Expression of RAD50 in the AHYMUN and AHNTU cohorts
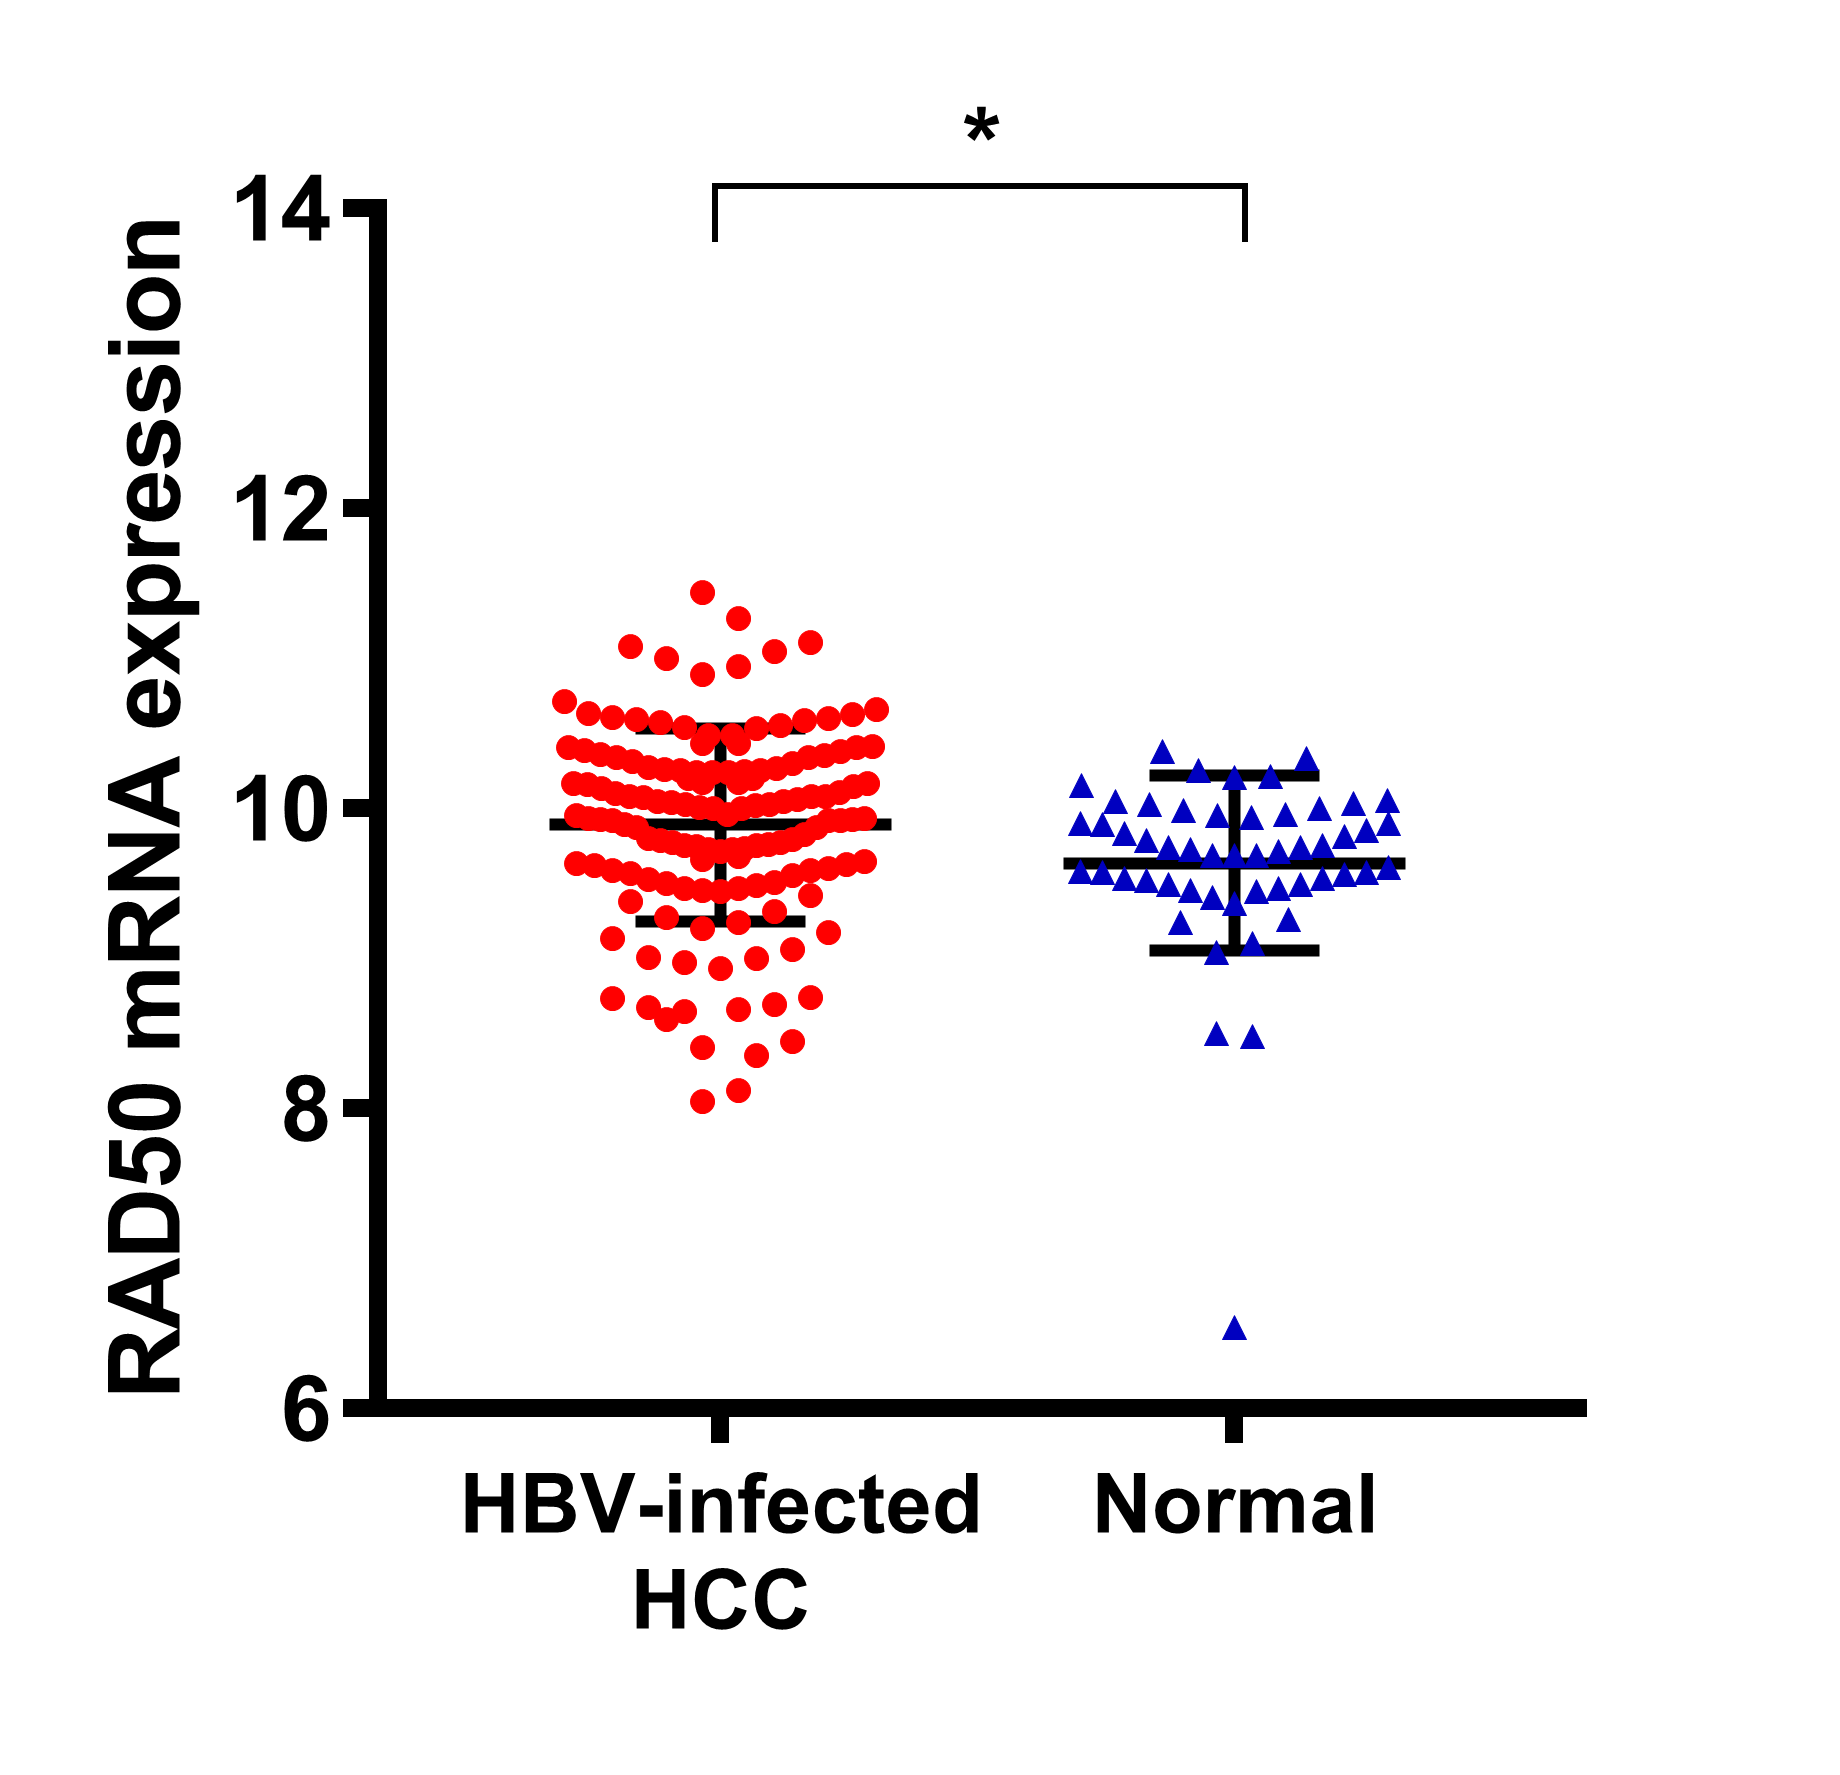
To analyse the RAD50 expression profile in HCC tissue, IHC was performed to reveal the staining distribution in tumour and normal tissues (Fig. 2A). The scatter plot of the IHC scores revealed that RAD50 expression was significantly elevated in HCC tissues in the AHYMUM (p<0.001) and AHNTU (p<0.001) cohorts (Fig. 2B).
3.3. Cox regression analyses
The univariate Cox regression analysis, as shown in the forest plots, revealed that age, gender, albumin level, bilirubin level and liver cirrhosis were not significantly associated with DFS in both AHYMUN (Fig. 3A) and AHNTU (Fig. 3B) patients. Meanwhile, tumour size was not a significant independent predictor of DFS in the AHYMUN cohort. In the multivariate models, the Okuda score (ref. I) was significantly associated with DFS in HCC patients, indicating the good representativeness of the population in the AHYMUN (HR: 1.914, p=0.045) and AHNTU (HR: 3.084, p=0.001) cohorts in the current study. More importantly, the subgroup analysis of RAD50 expression showed that RAD50 amplification was significantly correlated with DFS in the AHYMUN (HR: 4.612, p<0.001) and AHNTU (HR: 2.660, p=0.006) cohorts. Additionally, in the AHNTU cohort, a number of primary lesions was significantly correlated with poor DFS (HR: 2.563; p=0.007) according to the multivariate model used for the Cox regression analyses (Table 2).
In Fig. 3C & D, several parameters, including age, gender, albumin level, bilirubin level and the presence of liver cirrhosis, were not significantly associated with OS in the two cohorts. As shown in Table 3, the multivariate Cox analysis indicated that the Okuda score (ref. I) was significantly associated with OS in both the AHYMUN (HR: 2.329, p=0.031) and AHNTU (HR: 2.819, p=0.030) cohorts. RAD50 expression (ref. low) was significantly associated with OS in AHYMUM patients (HR: 6.807; p<0.001) but was not markedly correlated with OS in HCC patients from the AHNTU (HR: 1.735; p=0.195) cohort. The other factors, including tumour size (ref.<5 cm), the presence of multiple primary lesions (ref. single), the degree of pathological nuclear differential expression (ref. low), the presence of microvascular invasion (ref. absent) and the presence of capsular invasion (ref. absent), were not identified as prognostic indicators of OS in our study (p>0.05).
The survival curves suggested that HCC patients in the AHYMUN cohort with elevated RAD50 expression levels showed poor OS (p<0.001) and poor DFS (p<0.001) (Fig. 4A & B). In addition, in the AHNTU cohort, increased RAD50 expression was significantly associated with decreased OS (p=0.021) and DFS (p<0.001) (Fig. 4C & D).
3.4. Expression validation and GSEA
Four datasets (Rossler Liver 2 (12), Guichard Liver (13), Rossler Liver (12), and Chen Liver (14)) from the Oncomine database were analysed to validate the differential expression of RAD50 in HCC tumour and normal tissues (Fig. 5). A total of 11 significant genes, including RAD51, ATM, XRCC6, RAD50, XRCC5, TERF2, ATR, MRE11A, BRAC1, NBN and TERF2IP, were included in the molecular model shown in Fig. 6A. Functional and pathway enrichment analyses, including analyses of biological processes, cellular components, molecular functions and KEGG pathways, were performed using DAVID and are represented in the bubble chart in Supplementary Fig. 1. The significant and potentially related IncRNAs, targeted miRNAs and protein-protein interaction nodes are shown in Fig. 6B. Significant differences were found among the four validation datasets (p<0.05). A total of 100 significant genes were obtained from GSEA, and the genes with positive correlations were plotted. In addition, RAD50 was found to be involved in pathways from most functional annotation categories, including the nuclear body, ubiquitin ligase complex, G2M checkpoint and mitotic spindle signalling pathways. The details are shown in Fig. 6.