Descriptive analysis
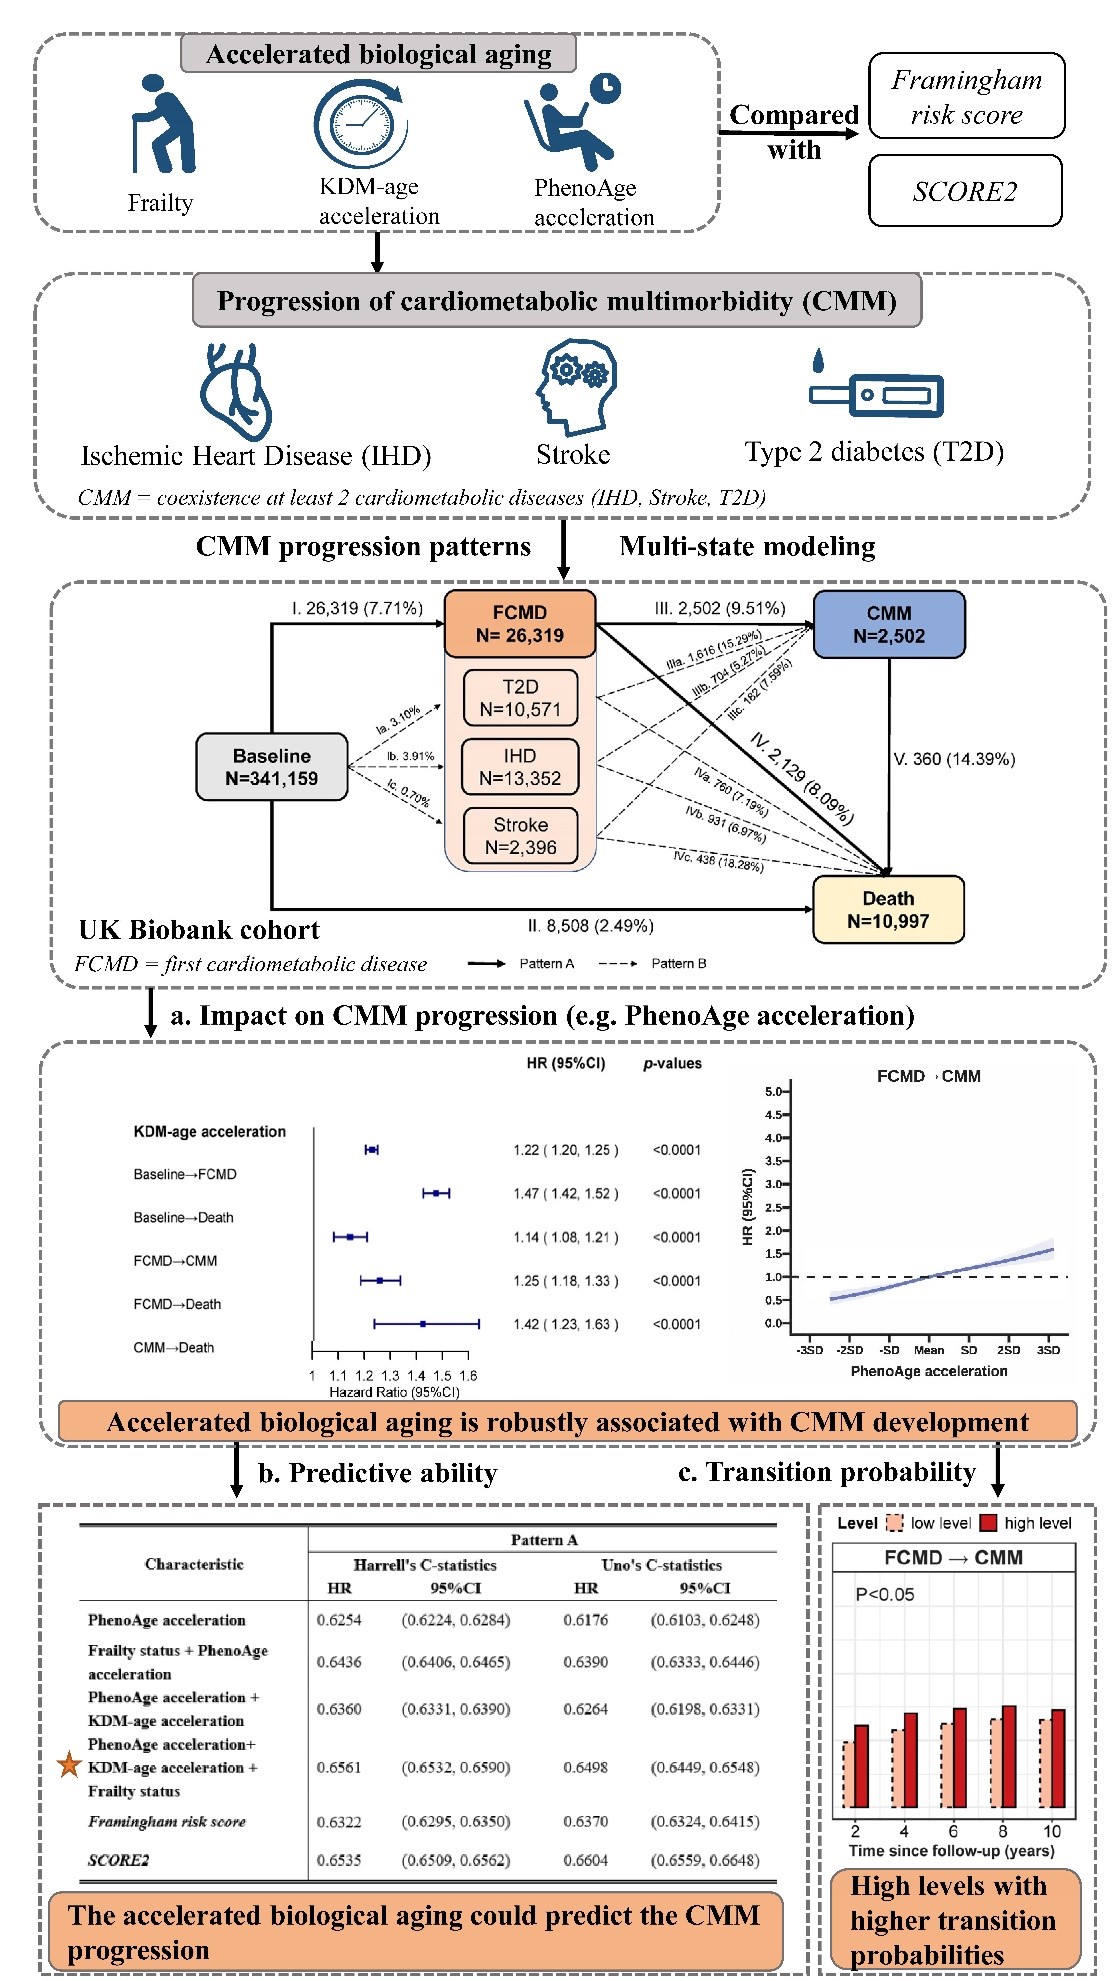
Characteristics of the whole population and by subgroups of cardiometabolic multimorbidity during follow-up are shown in Table 1. Nearly half of the participants were former or never smokers with moderate alcohol intake, and had a high-level physical activity. During a mean follow-up of 8.84 years, 26,319 (7.71%) participants experienced at least one CMD, of whom 13,352 experienced IHD, 10,571 experienced T2D, and 2,396 experienced stroke (Fig. 1). Of all incident CMD patients, 2,502 (transition Ⅲ, 9.51%) developed CMM, and afterward, 360 (transition Ⅴ, 14.39%) died from all-causes; 8,508 (transition Ⅱ, 2.49%) died without experiencing CMM. The three biological aging measures were correlated with each other (p-values < 0.0001, Table S5).
Table 1
Baseline characteristics of 341,159 participants by incident disease status during follow-up.
|
Characteristica
|
Total
N = 341,159
|
Participants with FCMD
N = 26,319
|
Participants with CMM
N = 2,502
|
|
Sex (male), %
|
182891 (53.61%)
|
9745 (37.03%)
|
731 (29.22%)
|
|
BMI (kg/m2)
|
27.22 (± 4.66)
|
29.58 (± 5.38)
|
31.00 (± 5.44)
|
|
Age at baseline, year
|
55.84 (± 8.08)
|
59.89 (± 6.95)
|
60.97 (± 6.58)
|
|
Smoking status, %
|
|
|
|
|
Never smoker
|
188940 (55.38%)
|
11711 (44.50%)
|
959 (38.33%)
|
|
Former smoker
|
117854 (34.55%)
|
11006 (41.82%)
|
1167 (46.64%)
|
|
Current smoker
|
34365 (10.07%)
|
3602 (13.69%)
|
376 (15.03%)
|
|
Years of education (≥ 10 years), %
|
237429 (69.59%)
|
15115 (57.43%)
|
1289 (51.52%)
|
|
Moderate alcohol intakeb(yes), %
|
169295 (49.62%)
|
12235 (46.49%)
|
1412 (56.43%)
|
|
High-level physical activityc(yes), %
|
246293 (72.19%)
|
17425 (66.21%)
|
1548 (61.87%)
|
|
White, %
|
325893 (95.53%)
|
24795 (94.21%)
|
2269 (90.69%)
|
|
Total household income (≥ ₤31,000), %
|
156397 (45.84%)
|
16104 (61.19%)
|
1680 (67.15%)
|
|
Employment status (employed), %
|
214878 (62.98%)
|
12195 (46.34%)
|
1044 (41.73%)
|
|
KDM-BA acceleration
|
-13.81 (± 10.96)
|
-14.81 (± 10.84)
|
-14.85 (± 10.67)
|
|
PhenoAge acceleration
|
-11.14 (± 5.21)
|
-8.813 (± 6.01)
|
-7.147 (± 6.49)
|
|
Frailty indicators
|
0.62 (± 0.83)
|
0.95 (± 1.03)
|
1.16 (± 1.08)
|
|
Frailty status
|
|
|
|
|
non-frail
|
188547 (55.27%)
|
10733 (40.78%)
|
794 (31.73%)
|
|
pre-frail
|
140590 (41.21%)
|
13232 (50.28%)
|
1395 (55.76%)
|
|
frail
|
12022 (3.52%)
|
2354 (8.94%)
|
313 (12.51%)
|
|
SCORE2 (%)
|
3.77 (± 2.93)
|
5.153 (± 3.24)
|
5.57 (± 3.40)
|
|
Framingham risk score (%)
|
12.96 (± 8.19)
|
16.36 (± 8.97)
|
17.30 (± 9.49)
|
| Notes: CMDs, cardiometabolic diseases; FCMD, first cardiometabolic disease; CMM, cardiometabolic multimorbidity. |
| Cardiometabolic diseases include type Ⅱ diabetes ischemic heart disease, and stroke. Cardiometabolic multimorbidity is defined as occurring at least two of the above-mentioned diseases. |
| a: Results are presented as mean (standard deviation) for continuous variables or number (percentage) for categorical variables; |
| b: Moderate alcohol intake: male: <28g/day; female: <14g/day; |
| c: High-level physical activity: ≥150 min/week moderate or ≥ 75 min/week vigorous or 150 min/week mixed (moderate + vigorous) activity. |
Associations of accelerated biological aging with cardiometabolic multimorbidity
Pattern A was our primary model of CMM development (Fig. 1). We first examined the relationships of the three biological aging measures with each stage of CMM, i.e., FCMD, CMM, and death, using Cox regression models. After full adjustment, models showed that KDM-BA acceleration, PhenoAge acceleration, and frailty status were associated with the risks of FCMD, CMM, and death, respectively (Table S6). The multi-state analyses were therefore useful to uncover the underlying risks of CMM development.
MSM showed the role of the accelerated biological aging in the transitions (Fig. 2). The three measures were significantly associated with all CMM stages except for frailty status on the development of CMM-death. The risk estimates were more prominent for the transition from baseline to FCMD than the subsequent transition from FCMD to CMM. For KDM-BA acceleration, the adjusted hazard ratios (HRs) were 1.22 (95% CI: 1.20, 1.25) for transition from baseline to FCMD, and 1.14 (95% CI: 1.08, 1.21) for transition subsequent to CMM. Similar results were observed for PhenoAge acceleration with HRs (95%CIs) of 1.24 (95% CI: 1.23, 1.25) for transition from baseline to FCMD, and 1.15 (95% CI: 1.12, 1.19) for transition FCMD to CMM. Compared to the non-frail group, the frail group was associated with 118% (HR = 2.18, 95% CI: 2.08–2.29), 33% (HR = 1.33, 95% CI: 1.15, 1.53), and 44% (HR = 1.44, 95% CI: 1.24, 1.69) higher risks for stages of baseline-FCMD, FCMD-CMM, and FCMD-death, respectively, while the estimates of pre-frail group were located in the middle. Monotonic increasing dose-response relationships were observed for the associations of the three measures with the stages of baseline-FCMD, FCMD-CMM, and FCMD-death (Figs. 3 & S3).
By specific CMDs, similar results were yielded for the transition pattern B with those for transition pattern A, but further implied distinguished roles of the three aging measures in captureing the risks from different FCMDs to CMM (Table 2). PhenoAge acceleration demonstrated a more strongly association with transitions from stroke to CMM than T2D or IHD to CMM. Meanwhile, FCMD participants with T2D were more likely to develop CMM than those with IHD or stroke in the associations with KDM-BA acceleration. But as predicted by frailty status, FCMD participants with IHD were more likely to develop CMM than those with the other two CMDs.
Table 2
Associations of the accelerated biological aging with the risks of first cardiometabolic disease, cardiometabolic multimorbidity, and death after the first cardiometabolic disease of pattern B using multi-state model.
|
Trajectories
|
Baseline→IHD
|
Baseline→T2D
|
Baseline→Stroke
|
IHD→CMM
|
T2D→CMM
|
Stroke→CMM
|
|
Characteristic
|
HR (95% CI)
|
HR (95% CI)
|
HR (95% CI)
|
HR (95% CI)
|
HR (95% CI)
|
HR (95% CI)
|
|
KDM-BA acceleration
|
1.27 (1.23, 1.30)
|
1.15 (1.11, 1.18)
|
1.49 (1.40, 1.59)
|
1.15 (1.04, 1.28)
|
1.21 (1.12, 1.29)
|
1.04 (0.84, 1.27)
|
|
PhenoAge acceleration
|
1.14 (1.12, 1.16)
|
1.34 (1.32, 1.36)
|
1.23 (1.18, 1.27)
|
1.20 (1.13, 1.27)
|
1.07 (1.03, 1.11)
|
1.25 (1.11, 1.42)
|
|
Frailty status
|
|
|
|
|
|
|
|
non-frail
|
Ref.
|
Ref.
|
Ref.
|
Ref.
|
Ref.
|
Ref.
|
|
pre-frail
|
1.27 (1.22, 1.31)
|
1.74 (1.67, 1.82)
|
1.17 (1.08, 1.27)
|
1.31 (1.11, 1.55)
|
1.03 (0.92, 1.16)
|
1.19 (0.87, 1.62)
|
|
frail
|
2.08 (1.94, 2.24)
|
2.54 (2.36, 2.73)
|
1.42 (1.16, 1.73)
|
1.72 (1.31, 2.24)
|
1.01 (0.85, 1.21)
|
1.49 (0.80, 2.78)
|
| Notes: Models adjusted for age, sex, BMI, years of education, smoking status, moderate alcohol intake, high-level physical activity, total household income, and employment status. Estimates of KDM-BA acceleration and PhenoAge acceleration were demonstrated per SD increase. |
Transition probability in different trajectories based on the multistate model
The estimated probabilities of transitioning from one state to another at high or low levels of three biological aging measures are shown in Fig. 4. People with CMDs were with 10 ~ 30% higher probability to die directly than people free of CMDs at baseline according to their accelerated biological aging status. Particularly, the probabilities of direct death from first CMD and of death from CMM were 17.08% and 30.84% higher, respectively, than those who had not experienced CMD then to death in high PhenoAge acceleration level after 10 years of follow-up. Besides, the transition probabilities from FCMD to CMM were much higher than those from baseline to FCMD. For instance, for PhenoAge acceleration, a higher transition probability was observed in the transition from FCMD to CMM than from the baseline to FCMD (e.g., 15.13% vs. 2.36% in the 8th year). The transition probabilities for the trajectory from FCMD to CMM increased to the highest in the 8th year for all aging measures and the overall change tended to be flat, whereas the transition probabilities consistently continued to rise with time in the other four trajectories. High levels of biological aging measures were associated with higher transition probabilities to more serious states, except for the transition from CMM to death of frailty (p-values < 0.05).
Performances of accelerated biological aging in the prediction of cardiometabolic multimorbidity
Summary indicators of the three aging measures in the prediction of CMM individually and jointly are presented in Table 3 by transition patterns A and B. Individually, PhenoAge acceleration outperformed the other two in the prediction of pattern A. Harrell’s C-statistics for PhenoAge acceleration was 0.6254 (95% CI: 0.6224–0.6284), and were 0.5255 (95% CI: 0.5224, 0.5286) and 0.5821 (95% CI: 0.5794–0.5849) for KDM-BA acceleration and frailty status, respectively. When PhenoAge acceleration and frailty status are combined, the predictive ability can reach 0.6436 (95% CI: 0.6406–0.6465). Synergistically, the combination of the three aging measures demonstrated the best prediction with a Harrell’s C-statistic of 0.6561 (95% CI: 0.6532–0.6590). Similar Uno C-statistics were also yielded. For pattern B, PhenoAge acceleration still demonstrated the best prediction as an individual index and the combination of the three was also with the highest C-statistics.
Table 3
Overall Harrell’s and Uno’s C-statistics of the accelerated biological aging in prediction of cardiometabolic multimorbidity.
|
Characteristic
|
Pattern A
|
Pattern B
|
|
Harrell's C-statistics
|
Uno's C-statistics
|
Harrell's C-statistics
|
Uno's C-statistics
|
|
HR
|
95%CI
|
HR
|
95%CI
|
HR
|
95%CI
|
HR
|
95%CI
|
|
KDM-BA acceleration
|
0.5255
|
(0.5224, 0.5286)
|
0.5207
|
(0.5142, 0.5272)
|
0.5256
|
(0.5225, 0.5287)
|
0.521
|
(0.5146, 0.5274)
|
|
PhenoAge acceleration
|
0.6254
|
(0.6224, 0.6284)
|
0.6176
|
(0.6103, 0.6248)
|
0.6256
|
(0.6225, 0.6286)
|
0.618
|
(0.6109, 0.6251)
|
|
Frailty status
|
0.5821
|
(0.5794, 0.5849)
|
0.5860
|
(0.5812, 0.5908)
|
0.5823
|
(0.5795, 0.5851)
|
0.5857
|
(0.5809, 0.5904)
|
|
Frailty status + KDM-BA acceleration
|
0.6004
|
(0.5974, 0.6034)
|
0.6025
|
(0.5967, 0.6082)
|
0.6019
|
(0.5989, 0.6049)
|
0.6034
|
(0.5978, 0.6090)
|
|
Frailty status + PhenoAge acceleration
|
0.6436
|
(0.6406, 0.6465)
|
0.6390
|
(0.6333, 0.6446)
|
0.6434
|
(0.6404, 0.6464)
|
0.6388
|
(0.6333, 0.6444)
|
|
PhenoAge acceleration + KDM-BA acceleration
|
0.6360
|
(0.6331, 0.6390)
|
0.6264
|
(0.6198, 0.6331)
|
0.6387
|
(0.6358, 0.6417)
|
0.6291
|
(0.6226, 0.6357)
|
|
PhenoAge acceleration + KDM-BA acceleration + Frailty status
|
0.6561
|
(0.6532, 0.6590)
|
0.6498
|
(0.6449, 0.6548)
|
0.6583
|
(0.6554, 0.6613)
|
0.6519
|
(0.6470, 0.6568)
|
| Notes: KDM-BA was computed from an algorithm derived from a series of regressions of nine individual biomarkers on chronological age in the reference population to quantify the decline of system integrity; PhenoAge was computed from an algorithm derived from multivariate analysis of mortality hazards to estimate the risk of death; Frailty status are categorical variable and classified as non-frail (0 deficit), pre-frail (1–2 deficits), and frail (3–5 deficits) |
Comparison of accelerated biological aging with cardiovascular risk scores in the prediction of cardiometabolic multimorbidity
As shown in Table S7, the performances of FRS and SCORE2 in the prediction of cardiometabolic multimorbidity were similar. For pattern A, per one SD increase in FRS and SCORE2, the adjusted HRs were 1.09 (95% CI: 1.07, 1.10) and 1.08 (95% CI: 1.06, 1.10) for transition from baseline to FCMD, respectively, and 1.09 (95% CI: 1.04, 1.14) and 1.10 (95% CI: 1.05, 1.16) for transition subsequent to CMM, respectively, which were much lower than those of KDM-BA acceleration and PhenoAge acceleration. Besides, the HRs were not statistically significant in other three transitions of pattern A. By the types of FCMD, the SCORE2 and FRS shared the similar trend that they were not associated with the transition from baseline to T2D, but associated with the one from T2D to CMM. Regarding the prediction power, the Harraell’s C-statistics of cardiovascular risk scores were slightly lower (FRS: 0.6322; SCORE2: 0.6535) than that of the combination of the three aging biomarkers (0.6561) for pattern A, but with slightly higher Uno C-statistics. Similar C-statistics were observed for pattern B.
Sensitivity analyses
Among subgroups, we yielded essentially unchanged associations between accelerated biological aging and the risks of CMM progression among participants younger than 70-year-old (Table S8) and white participants (Table S9). Moreover, although the interactions of the age of FCMD onset (< 60 years or ≥ 60 years), smoking status, alcohol intake, and physical activity level with accelerated biological aging on the CMM risks were mostly not significant (Table S10-S13, interaction p-values > 0.05), the associations of biological aging measures were moderately stronger among the people aged < 60 years, ever smokers, and with low-level physical activity. The estimates of KDM-BA acceleration and frailty with the transition from FCMD to CMM were significantly higher in women than those in men (Table S14, p-values of interactions < 0.05).