1. General information
All reagents were purchased from TCI Development Co., Ltd (Shanghai) and J & K Scientific (Beijing, China) unless otherwise indicated. Thin layer chromatography (TLC) was performed with silica gel layers, and compounds were visualized under UV light. The 1H NMR (300 MHz) spectra of all compounds were acquired on an Advance (Bruker) spectrometer. Chemical shifts (δ) for the proton resonance were reported in parts per million (ppm) downfield from TMS (δ = 0). The identification and purity of precursors as well as cold standard sample (19F-deoxy-thiamine) were determined by a LC-MS instrument (1200/6120, Agilent Technologies Inc.) with a C18 column (4.6 * 150 mm, 5 uM; VP-ODS, Shimadzu) at 0.5 ml per minute (ml/min) flow rate. The mobile phase consisted of 60% methanol and 40% H2O containing millesimal formic acid.
18F ions were obtained from a cyclotron (Cyclone 18 Twin, IBA, Belgium), situated at the Molecular Imaging institute, Jiangsu Huayi Technology Co., Ltd., by the nuclear reaction [18O(p,n)18F]. For automatic synthesis of 18F-deoxy-thiamine, we used a remote-controlled radiolabeling module (RNplus, Synthra) with slight modifications and created the sequence program, based on manual trials. The scheme of modified RNplus module is presented in Supplementary Figure 1. We used six reagent supply vials (A1-A5, B1) at the upper part and two reaction vials (vial I and vial II) at the bottom part.
Analytical HPLC (1260, Agilent Technologies Inc.) with the same type of column mentioned above was employed for 18F-deoxy-thiamine characterization and identification. The signal acquisition system consisted of a UV detector (254 nm) and a radio-detector (1IINaI/PMT, Lablogic, USA) in series. The flow rate was 0.8 ml/min and the mobile phase consisted of methanol and H2O containing 0.05% triethylamine and 50mM ammonium acetate. The percentage of methanol/H2O changed with running time: 0-15 minutes (mins), 15%/85%; 15-25 mins, methanol increasing to 100% while H2O decreasing to 0%; 25-30 mins, methanol 100%.
A micro-PET/CT equipment (Inveon; Siemens Co., USA) was used for detecting the levels of 18F-deoxy-thiamine in the organs of mice and marmosets. During micro-PET/CT scanning, the body temperature of animals was maintained at 37°C using a heat pad.
C57BL/6 and Institute of Cancer Research (ICR) mice (obtained from the SLAC Laboratory Animal Company, China) were housed in a controlled environment at temperature of 20-26 oC and humidity of 40-70% with free access to food and water. The marmosets were supplied by Jiuting Non-human Primate Facility, Chinese Academy of Sciences, Shanghai. Four marmosets aged 3.1-10.8 years old were employed for micro-PET/CT scanning (M1: 3.1y, female; M2: 3.5y, male; M3: 5.4y, female; M4: 10.8y, male). At the day of experiment, the marmosets were fetched from the facility, and were sent back when the scanning finished.
All animal care and experimental procedures were carried out according to the guidelines of the Animal Care Committee of Fudan University. This study was approved by Medical Experimental Animal Administrative Committee of Fudan University, and the committee on medical ethics of Zhongshan Hospital, Fudan University.
2. Synthesis of cold standard sample of 18F-deoxy-thiamine as well as precursors (5) and (6).
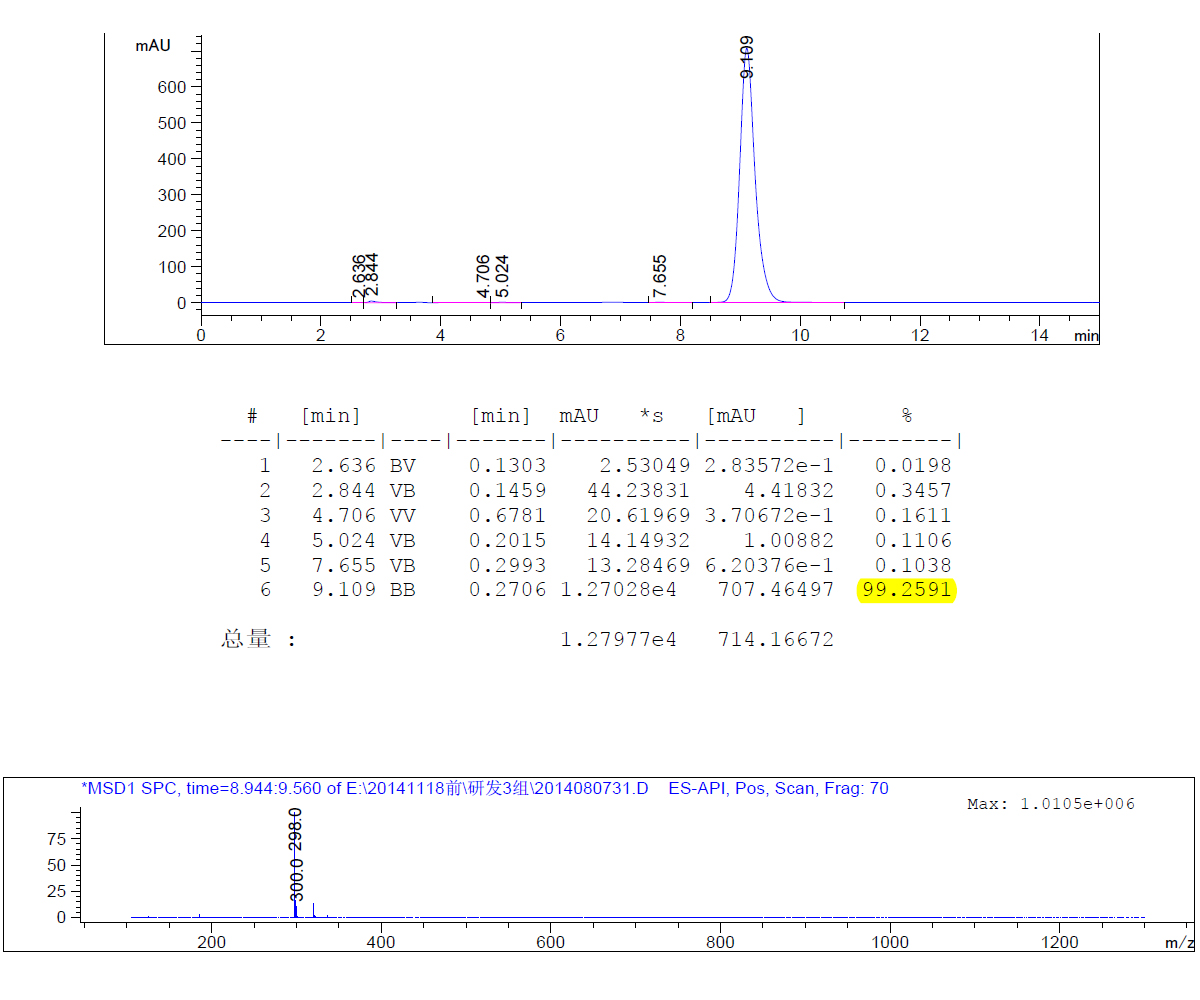
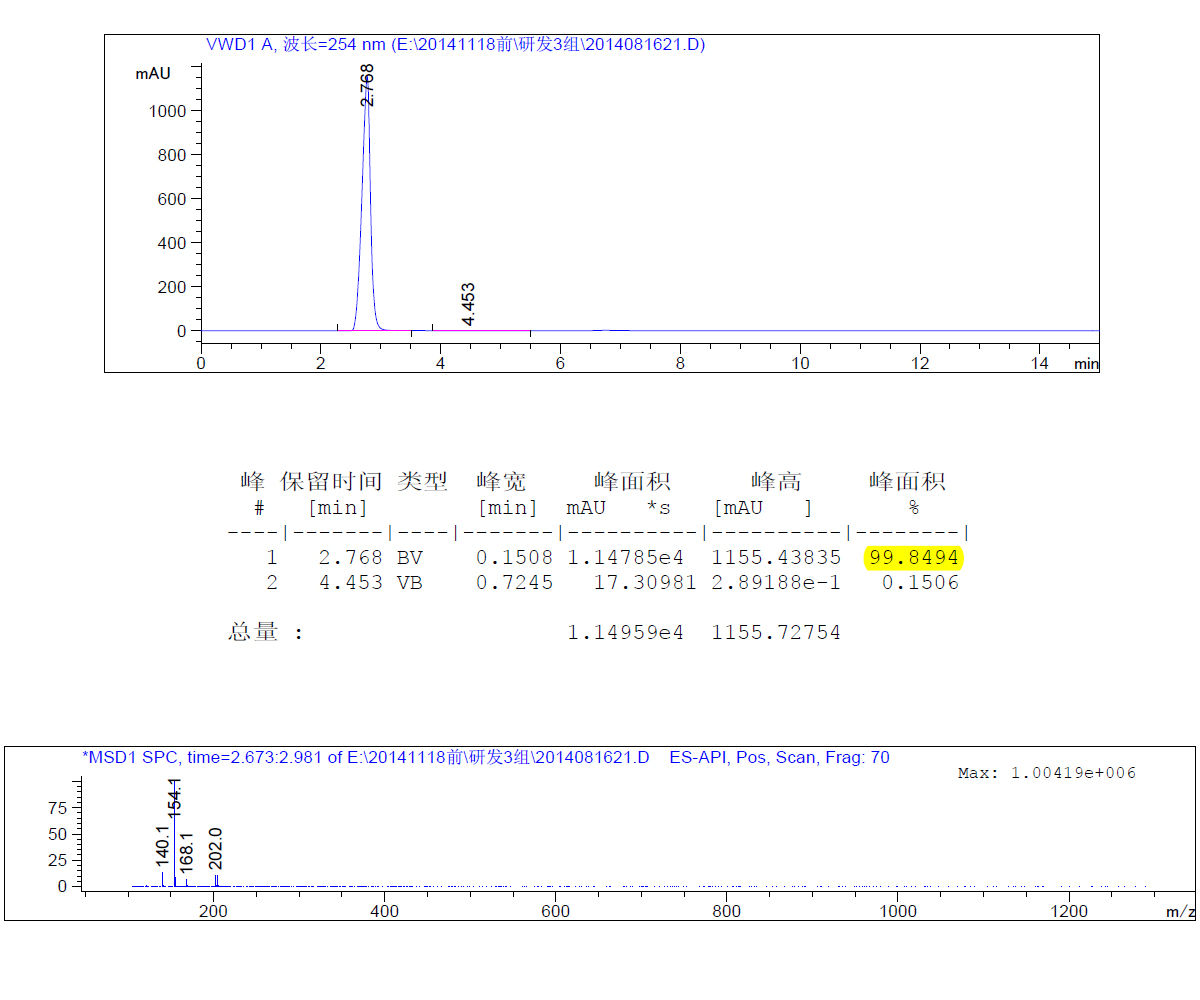
We synthesized cold standard sample of 18F-deoxy-thiamine as well as precursors (5) and (6) according to the work of Cline JK, et al.[13], with minor modifications (Supplementary Figure 2). The purity of the cold standard sample is > 99.9%, and the purity of two precursors > 99%, identified via HNMR and LC-MS (Supplementary Figure 3B-G). The details of the synthetic route were described in the supplementary text.
3. Automated radiosynthesis of 18F-deoxy-thiamine
We adopted a two-step synthesis route (Figure 1). The scheme of automated synthesis was shown in Supplementary Figure 1. Reagents were added into supply vials as follows: A1: 1.1 ml eluent (3.08 mg KHCO3, 11 mg Kryptofix 2.2.2, 0.88 mL MeCN, 0.22 mL H2O); A2: 1 ml MeCN; A3: 5 mg precursor (6) in 0.5 ml MeCN; A4: 1 ml MeCN; A5: 0.5 ml MeCN; B1: 0.5 ml H2O. 5 mg precursor (5) powder was also added into reaction vial II beforehand. When the first step synthesis finished, the intermediate product [18F]-compound (7) was transferred from reaction vial I to reaction vial II via distillation. The whole automated synthesis duration was 100 mins. The details of synthesis and purification were described in the supplementary text.
4. Characteration and quality control of 18F-deoxy-thiamine
Radiochemical yield (RCY, decay-correction to the end of bombardment) and radiochemical concentration (RCC) were measured by the radioactivity calibrator (CRC-55tR, CAPINTEC, INC., USA). 18F-deoxy-thiamine was identified by co-injecting final product with cold standard sample into analytical HPLC. Radiochemical purity (RCP) and specific radioactivity (SA) were calculated by means of the area under curve (AUC) of radio-signals and UV-signals of final product in analytical HPLC, respectively. Bacteria and endotoxin detections were carried out by means of anaerobic/aerobic bacteria media and Limulus reagent gel methods, respectively, according to Chinese Pharmacopoeia.
5. In vitro stability
18F-deoxy-thiamine solution was stored at room temperature (RT) and injected into analytical HPLC for evaluating RCP and peak shape at 0 hour (h), 2h, 4h, 6h, 8h, and 10h, respectively after synthesized.
6. Thiamine deficiency mouse model
Eight-week-old male C57BL/6 and ICR mice were randomly divided into two groups: TD mouse models (n = 2 for C57BL/6, one died due to anesthesia during micro-PET/CT scanning; n = 3 for ICR) were established by feeding thiamine-deprived diet (Trophic Animal Feed High-tech Co., Ltd., China). Control mice (n=3 for each strain) were fed the general diet. Twenty-eight days later, all mice received PET/CT scanning.
7. Micro-PET/CT imaging
Micro-PET/CT imaging using 18F-deoxy-thiamine as the tracer was performed in the mice with TD and control mice, as well as in marmosets. The animals were anesthetized by inhaling 1.5%-2% of isoflurane in air (1.5 L/min) and received CT scan for acquiring structure image and attenuation correction data. Then, the mice were injected with 7.4-14.8 MBq of 18F-deoxy-thiamine in 0.1ml volume (diluted by normal saline) through the tail vein. Brain PET imaging was immediately performed and dynamically acquired for 90 mins with an energy window of 350-650KeV and a time window of 3.438 ns. A total of 35 frames were setup: 20f, 3s; 4f, 60s; 5f, 300s; 6f, 600s. Dynamic images were reconstructed by OSEM3D/SP-MAP algorithm with two iterations. After scanning, the mice were sacrificed.
The marmosets were injected with 46.3-74.0 MBq of 18F-deoxy-thiamine in 0.5-0.8 ml volume through the femoral vein. Brain PET imaging was immediately scanned and dynamically acquired for 60 mins. A total of 18 frames was setup: 6f, 10s; 4f, 60s; 5f, 300s; 6f, 600s. The blood samples of the marmosets were taken from femoral vein for measuring the levels of thiamine, TMP, and TDP. The other conditions for marmosets were the same as that for mice.
Regions of interest (ROIs) were drawn manually over the whole brain (for mice and marmosets) and in the left ventricular cavity (for marmosets) based on the PET/CT co-registered images using IRW 4.2 software (Siemens Medical Solutions USA, Inc.). Radioactivity was expressed as standard uptake value (SUV): (ROI radioactivity/ROI volume)/(injected radioactivity/gram of body weight). The time-activity curve (TAC) and AUC (SUV*mins) were also calculated.
The TACs of the marmosets blood (Radioactivity was expressed as SUV) were taken as input functions (IF) [14-16] for fitting Patlak plots [17, 18], in order to analyze transfer constants (Ki) of brains in marmosets (IRW 4.2 software). The details of Patlak model were described in the supplemental text.
8. Measurement of thiamine, TMP, and TDP in whole blood samples of marmosets
Thiamine, TMP, and TDP levels in whole blood samples were measured using HPLC, based on the established mothed [4] with slight modification. Briefly, blood samples were collected using heparin-anticoagulated tubes, 150 ul sample was vibrated for 30s with equal volume of 5.2% perchloric acid (PCA) added dropwise for deproteinization. Then, the mixture was stored at -80oC until assay within one month. The mixture was centrifuged at 12000 rpm for 8 mins at 4 oC, the supernatant was pipetted. Thiamine, TMP, and TDP in supernatant were derivatized into thiochromes using potassium ferricyanide and analyzed by gradient elusion with C18 reversed-phase analytical column (250 * 4.6 mm). The derivatives were identified by HPLC fluoroscopy (1100, Agilent Technologies Inc., ex: 367nm, em: 435nm). The thiamine, TMP, and TDP levels were quantified using standard samples (Sigma-Aldrich, St. Louis, MO). The analyzers were blinded to samples information.
9. Studies of pharmacokinetic and metabolic kinetics in liver and kidney of mice
Nine-week-old male ICR mice (n=5) were dynamically scanned using micro-PET/CT for 60 mins. A total of 18 frames was reconstructed: 6f, 10s; 4f, 60s; 5f, 300s; 6f, 600s. The scanning conditions were the same as those mentioned above. The ROIs of liver and renal parenchyma as well as left ventricular cavity were manually drawn.
For pharmacokinetic study, the TACs of the blood were fitted. The radioactivity was evaluated as %IA/g (the percentage of injected activity per gram of blood). Pharmacokinetics parameters were counted through the software PKSolver (version 2.0, China Pharmaceutical University) [19].
For metabolic kinetics study, SUV, TAC, AUC, maximum radioactivity (Cmax), and time to Cmax (Tmax) were calculated. The TACs of the blood (Radioactivity expressed as SUV) were taken as IFs for fitting Logan plots [20, 21], in order to analyze the distribution volumes (VD) of 18F-deoxy-thiamine in liver and kidney, respectively (IRW 4.2 software). The details of Logan model were described in the supplemental text.
10. Biodistribution study
The biodistribution of 18F-deoxy-thiamine was studied in ICR mice (n = 36 in total; 18 males, nine-weeks-old, 33.5 ± 4.0 g; 18 females, seven-week-old, 27.7 ± 5.0 g). For each mouse, 0.1 ml of 18F-deoxy-thiamine solution (37 MBq/ml) was injected into the tail vein under isoflurane anesthesia. The mice were sacrificed at 5 mins, 10 mins, 30 mins, 1 h, 2 hs, and 4 hs after injection (3 males and 3 females for each time point). The tissues of heart, liver, spleen, lung, kidney, stomach, duodenum, pancreas, femur, muscle (from thigh), artery blood, brain, fat, and gonad (ovary or testicle) were harvested, weighted, and measured for radioactivity by γ-counter. %IA/g was calculated referring to the counts of standard samples.
11. In vivo stability and the renal excretion rate
After metabolic kinetics study (Heading 9, Materials and Methods section), the mice were stop to exposure to isoflurane, and woke up several mins later. The urine accumulated in the bladder of the mice during the whole anesthetization period would be excreted. Some mice were softly rubbed the lower bowel in order to promote urination as completely as possible. The duration from the injection of 18F-deoxy-thiamine to mouse urination was about 85 mins. The urine samples from three ICR mice were collected using syringes and measured in the radioactivity calibrator. Then, 0.1 ml urine for each mouse was added in an Eppendorf tube, vibrated for 30s with equal volume of PCA added dropwise for deproteinization. After centrifuging at 12000 rpm for 8 mins at 4 oC, the supernatant was filtered and analyzed using HPLC.
12. Statistical analysis
For the continuous data, mean ± standard error of mean (SEM) was applied for statistical description. Student t test was employed to compare the AUC values between TD mice and controls in ICR strain. The Pearson correlation was utilized to analyse the correlation between the cerebral accumulation of 18F-deoxy-thiamine and the levels of blood thiamine, TMP, and TDP in marmosets. Repeated measurement of ANOVA with Trukey’s post-hoc was used to analyse the AUC values of 18F-deoxy-thiamine in brain, liver, and kidney in ICR mice. All statistical analyses were performed using SPSS (Statistical Package for the Social Sciences) software (version 22.0; SPSS Inc., Chicago IL).