Baseline characteristics of patients stratified by tumor location
An initial analysis of the demographic and clinical characteristics of all 53,905 patients were summarized in Table 1. The median follow-up time was 61 months. The most common tumor location was the upper quadrants (72.3%), followed by tumors located in lower quadrants (20.5%), and the central and nipple region (7.2%). Compared with the other quadrants, patients with central and nipple lesions showed generally more unfavorable clinicopathologic features (older age, higher proportion of patients with stage II/III/IV, more patients with T2/T3/T4, and more patients with positive LN). Patients with central and nipple lesions were observed with less lumpetomy surgery rate and a significantly lower incidence of HR-/HER2- (triple-negative) subtype (all p < 0.001).
Table 1
Baseline characteristics of breast cancer patients from the SEER database stratified by tumor location.
| Variables | Subgroup | No. (%) of patients |
| Lower quadrants (n = 11,065) | Upper quadrants (n = 38,974) | Central and nipple (n = 3,866) | P |
| Literality | Left | 5,781(52.2) | 19,705(50.6) | 1,988(51.4) | 0.006 |
| | Right | 5,284(47.8) | 19,269(49.4) | 1,878(48.6) |
| Age | < 60 | 5,630(50.9) | 20,346(52.2) | 1,779(46.0) | < 0.001 |
| | ≥ 60 | 5,435(49.1) | 18,628(47.8) | 2,087(54.0) |
| Race | White | 8,659(78.3) | 30,623(78.6) | 3,074(79.5) | 0.001 |
| | Black | 1,310(11.8) | 4,407(11.3) | 362(9.4) |
| | Other | 1,045(9.4) | 3,731(9.6) | 412(10.7) |
| | Unknown | 51(0.5) | 213(0.5) | 18(0.5) |
| Grade | I | 2,073(18.7) | 8,250(21.2) | 673(17.4) | < 0.001 |
| | II | 4,486(40.5) | 15,402(39.5) | 1,721(44.5) |
| | III and UD | 4,254(38.4) | 14,483(37.2) | 1,381(35.7) |
| | Unknown | 252(2.3) | 839(2.2) | 91(2.4) |
| pT | pT0 | 1(0.0) | 7(0.0) | 0(0.0) | < 0.001 |
| | pT1 | 7,260(65.6) | 24,702(63.4) | 2,103(54.4) |
| | pT2 | 3,271(29.6) | 11,967(30.7) | 1,291(33.4) |
| | pT3 | 302(2.7) | 1,669(4.3) | 246(6.4) |
| | pT4 | 231(2.1) | 629(1.6) | 226(5.8) |
| pN | pN0 | 7,731(69.9) | 27,115(69.6) | 2,228(57.6) | < 0.001 |
| | pN1 | 2,518(22.8) | 8,828(22.7) | 1,175(30.4) |
| | pN2 | 553(5.0) | 2,030(5.2) | 300(7.8) |
| | pN3 | 263(2.4) | 1,001(2.6) | 163(4.2) |
| M stage | M0 | 10,896(98.5) | 38,444(98.6) | 3,774(97.6) | < 0.001 |
| | M1 | 169(1.5) | 530(1.4) | 92(2.4) |
| TNM stage | I | 6,178(55.8) | 21,324(54.7) | 1,699(43.9) | < 0.001 |
| | II | 3,711(33.5) | 13,351(34.3) | 1,435(37.1) |
| | III | 1,007(9.1) | 3,769(9.7) | 640(16.6) |
| | IV | 169(1.5) | 530(1.4) | 92(2.4) |
| Surgery | Lumpetomy | 6740(60.9) | 25,099(64.4) | 1,668(43.1) | < 0.001 |
| | Mastectomy | 4,325(39.1) | 13,875(35.6) | 2,198(56.9) |
| Breast subtype | HR+/HER2- | 7,702(69.6) | 27,185(69.8) | 2,776(71.8) | < 0.001 |
| | HR+/HER2+ | 1,324(12.0) | 4,205(10.8) | 480(12.4) |
| | HR-/HER2+ | 611(5.5) | 1,883(4.8) | 244(6.3) |
| | HR-/HER2- | 1,428(12.9) | 5,701(14.6) | 366(9.5) |
| Marital status | Married | 6,344(57.3) | 22,310(57.2) | 2,092(54.1) | 0.004 |
| | Not married | 4,201(38.0) | 14,791(38.0) | 1,584(41.0) |
| | Unknown | 520(4.7) | 1,873(4.8) | 190(4.9) |
| P values are from Chi-square test and were significant at < 0.05. SEER: Surveillance, Epidemiology, and End Results; HR: hormone receptor; HER2: human epidermal growth factor receptor 2. |
Comparison Of Survival Among The Three Groups
Using the lower quadrants population as a reference, we found the 5-year BCSS of patients with central and nipple lesions was significantly lower than that of the lower quadrants population (90.5% vs 93.2%, p < 0.001), while patients of the upper quadrants showed significantly better BCSS (93.8% vs 93.2%, p = 0.01) (Fig. 1A). Similarly, the 5-year OS of the patients with tumors in central and nipple were markedly lower than that of the lower quadrants population (84.5% vs 88.9%, p < 0.001), while patients with tumors in the upper quadrants showed significantly better OS (89.8% vs 88.9%, p = 0.004) (Fig. 1B). To balance the effect of distinct distribution of baseline prognostic factors among different groups, univariate and multivariate Cox proportional hazards models were used. Laterality (p = 0.042), race, grade, TNM stage, surgery type, breast subtype, marital status, and tumor location (all p < 0.001) were responsible for BCSS. Similarly, the significant predictors of OS were laterality (P = 0.044), age, race, grade, TNM stage, surgery type, breast subtype, marital status, and tumor location (all p < 0.001) (Table 2). After multivariate analysis, we found that race, grade, TNM stage, surgery type, breast subtype, and marital status were significant independent predictors of both OS and BCSS (all p < 0.001). Tumor location of central and nipple was confirmed as an independent risk factor with higher HRs in terms of both BCSS and OS (BCSS: hazard ratio [HR], 1.145, p = 0.036, 95% confidence interval [CI], 1.009–1.299; OS: HR, 1.118, p = 0.024, 95% CI, 1.015–1.232) (Table 2), while lower HRs were observed for tumor location of upper quadrants (BCSS: HR, 0.888, p = 0.004, 95% CI, 0.818–0.964; OS: HR, 0.930, p = 0.023, 95% CI, 0.873–0.990).
Table 2
Univariate and multivariate Cox proportional model of factors associated with breast cancer-specific survival and overall survival.
| Variables | Subgroup | BCSS | OS |
| Univariable | Multivariable | Univariable | Multivariable |
| Hazard ratio | P | Hazard ratio | P | Hazard ratio | P | Hazard ratio | P |
| Location | Lower quadrants | 1 | < 0.001 | 1 | < 0.001 | 1 | < 0.001 | 1 | < 0.001 |
| | Upper quadrants | 0.899(0.828, 0.975) | 0.888(0.818, 0.964) | 0.913(0.857, 0.972) | 0.930(0.873, 0.990) |
| | Central and nipple | 1.416(1.249, 1.605) | 1.145(1.009, 1.299) | 1.412(1.283, 1.554) | 1.118(1.015, 1.232) |
| Laterality | Left | 1 | 0.042 | | 1 | 0.044 | |
| | Right | 0.933(0.873, 0.997) | 0.949(0.903, 0.999) |
| Age | < 60 | 1 | 0.170 | | 1 | < 0.001 | 1 | < 0.001 |
| | ≥ 60 | 0.955(0.893, 1.020) | 1.869(1.774, 1.970) | 2.325(2.203, 2.454) |
| Race | White | 1 | < 0.001 | 1 | < 0.001 | 1 | < 0.001 | 1 | < 0.001 |
| | Black | 1.878(1.725, 2.043) | 1.165(1.068, 1.271) | 1.525(1.424, 1.634) | 1.137(1.057, 1.217) |
| | Other | 0.703(0.613, 0.806) | 0.670(0.585, 0.769) | 0.614(0.551, 0.684) | 0.651(0.585, 0.726) |
| | Unknown | 0.114(0.029, 0.457) | 0.140(0.035, 0.558) | 0.158(0.066, 0.380) | 0.183(0.076, 0.441) |
| Grade | I | 1 | < 0.001 | 1 | < 0.001 | 1 | < 0.001 | 1 | < 0.001 |
| | II | 3.487(2.892, 4.205) | 2.111(1.747, 2.551) | 1.532(1.402, 1.676) | 1.171(1.069, 1.283) |
| | III and UD | 11.417(9.546, 13.656) | 3.870(3.206, 4.671) | 3.065(2.817, 3.334) | 1.700(1.546, 1.869) |
| | Unknown | 5.666(4.241, 7.568) | 2.506(1.868, 3.361) | 1.870(1.540, 2.271) | 1.258(1.033, 1.531) |
| TNM stage | I | 1 | < 0.001 | 1 | < 0.001 | 1 | < 0.001 | 1 | < 0.001 |
| | II | 4.146(3.751, 4.582) | 2.788(2.515, 3.091) | 2.155(2.026, 2.292) | 1.888(1.769, 2.015) |
| | III | 13.539(12.223, 14.997) | 8.209(7.358, 9.159) | 5.126(4.784, 5.493) | 4.225(3.914, 4.561) |
| | IV | 47.755(42.116, 54.148) | 31.532(27.662, 35.994) | 15.326(13.847, 16.963) | 13.204(11.876, 14.680) |
| Surgery | Lumpetomy | 1 | < 0.001 | 1 | < 0.001 | 1 | < 0.001 | 1 | < 0.001 |
| | Mastectomy | 2.568(2.400, 2.748) | 1.306(1.216, 1.403) | 1.868(1.776, 1.965) | 1.304(1.235, 1.377) |
| Breast subtype | HR+/HER2- | 1 | < 0.001 | 1 | < 0.001 | 1 | < 0.001 | 1 | < 0.001 |
| | HR+/HER2+ | 1.307(1.163, 1.469) | 0.709(0.630, 0.998) | 1.077(0.987, 1.175) | 0.808(0.739, 0.884) |
| | HR-/HER2+ | 2.503(2.208, 2.837) | 1.082(0.951, 1.231) | 1.641(1.479, 1.821) | 1.009(0.906, 1.124) |
| | HR-/HER2- | 4.091(3.799, 4.404) | 2.202(2.029, 2.389) | 2.492(2.348, 2.645) | 1.805(1.687, 1.929) |
| Marital status | Married | 1 | < 0.001 | 1 | < 0.001 | 1 | < 0.001 | 1 | < 0.001 |
| | Not married | 1.509(1.410, 1.615) | 1.350(1.260, 1.447) | 1.949(1.850, 2.053) | 1.663(1.577, 1.754) |
| | Unknown | 1.208(1.030, 1.417) | 1.140(0.972, 1.447) | 1.441(1.277, 1.625) | 1.318(1.168, 1.486) |
| Abbreviations: BCSS, breast cancer-specific survival; OS, overall survival; UD, undifferentiated; HR: hormone receptor; HER2: human epidermal growth factor receptor |
Subgroup Analyses By Tnm Stage And Breast Subtype
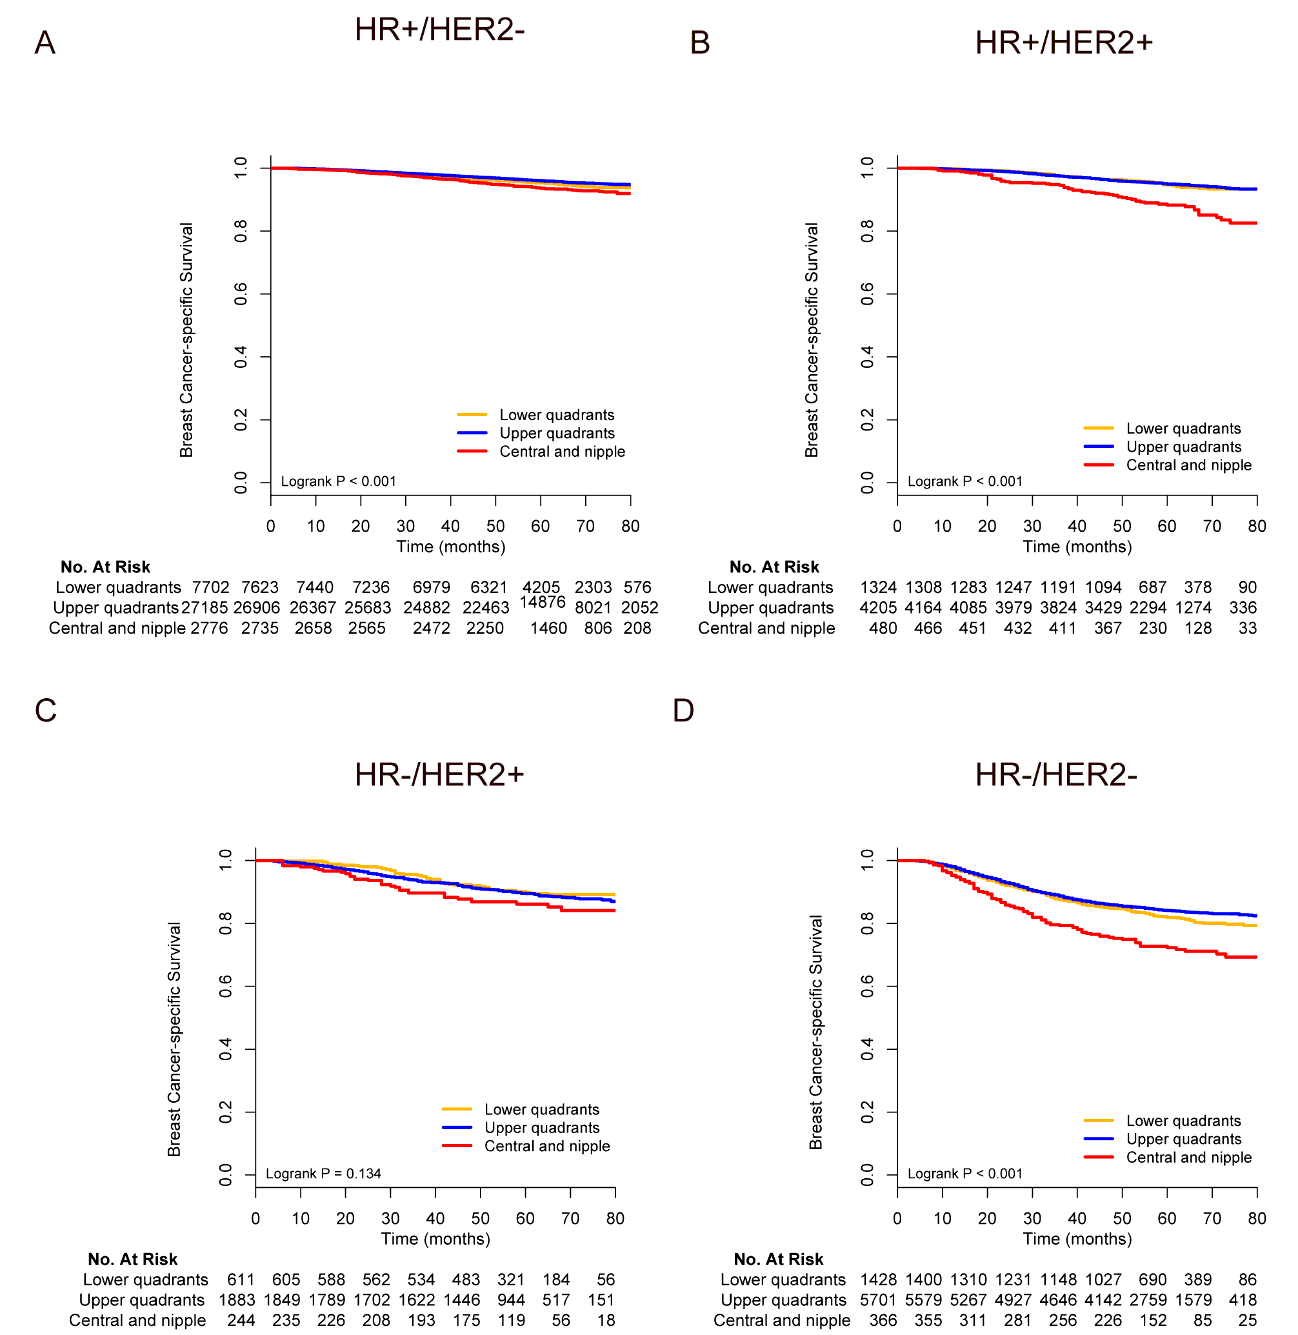
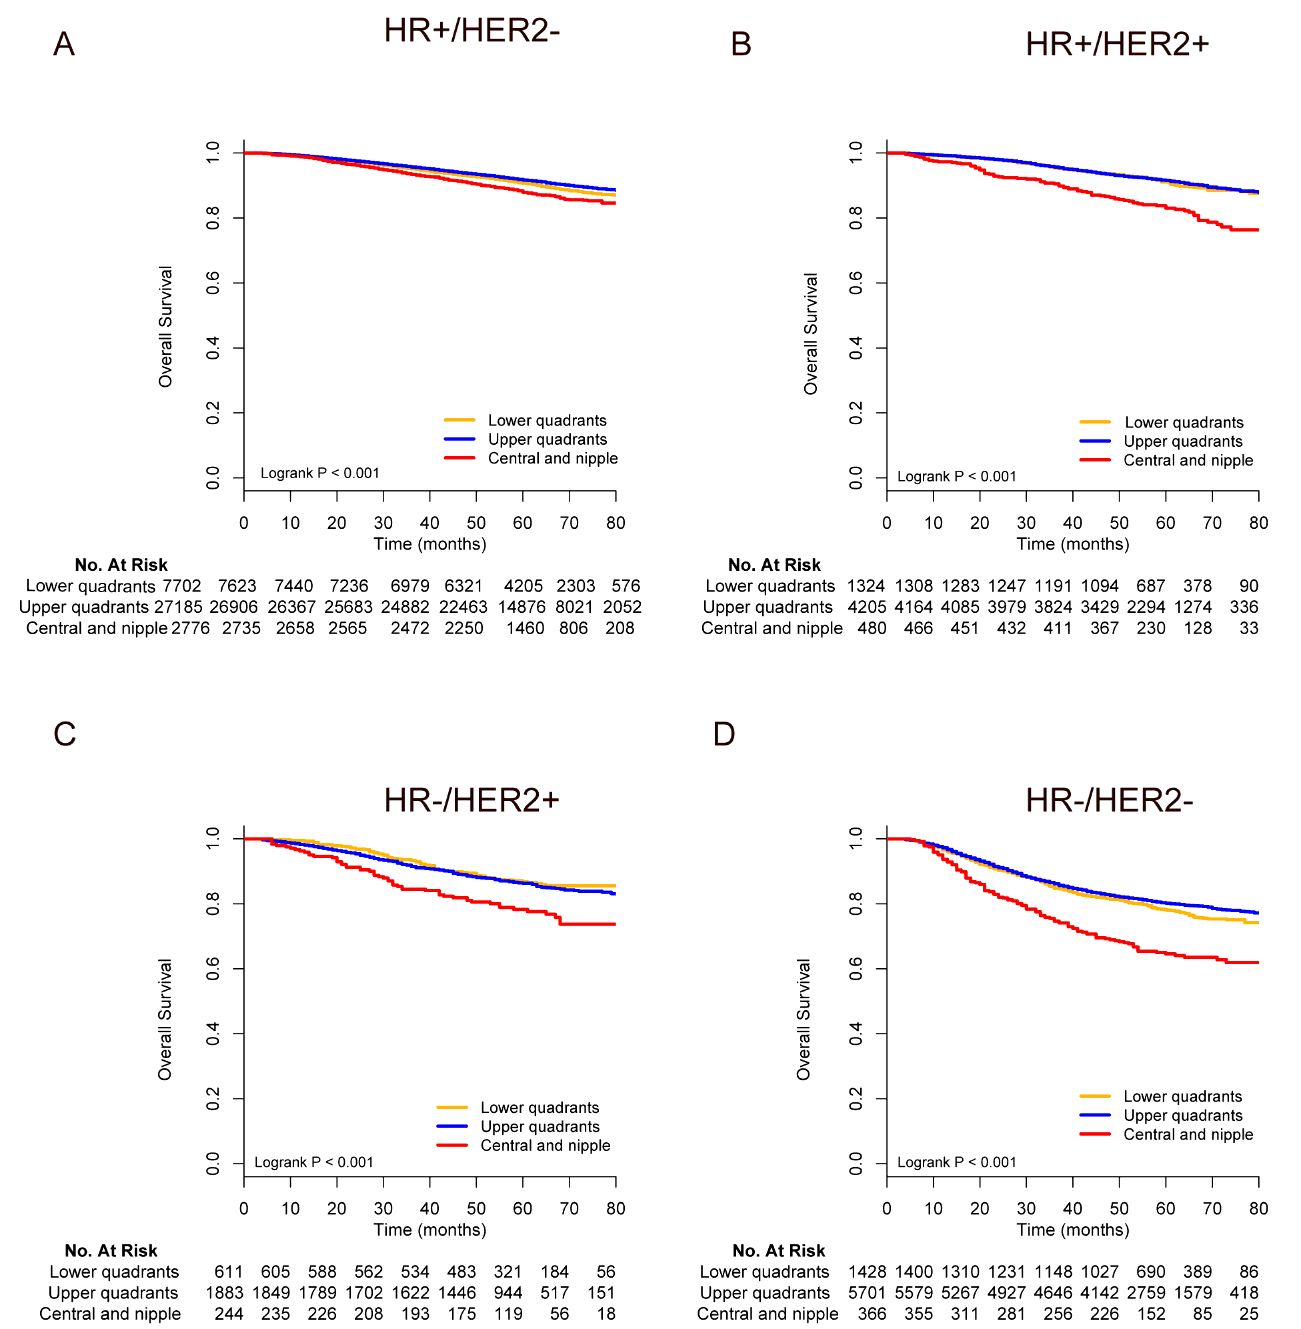
We next assessed the prognostic value of tumor location in various subgroups. We found that upper quadrants exhibited better survival rates than lower quadrants for BCSS and OS (all p < 0.05) in patients with TNM stage I–II (Fig. 2A, 2B; Fig. 3A, 3B), while patients with central and nipple lesions exhibited worse survival rates than upper quadrants for BCSS (p < 0.05) in patients with TNM stage II, and for OS (p < 0.05) in patients with TNM stage I–III (Fig. 2B; Fig. 3A, 3B, 3C). Dramatically, we found that upper quadrants exhibited worse survival rates than lower quadrants for BCSS and OS in patients with TNM stage IV (BCSS: 39.0% vs 50.9%, p = 0.015; OS: 36.5% vs 46.6%, p = 0.01) (Fig. 2D; Fig. 3D). This poor prognostic value of BCSS and OS of central and nipple lesions could be drawn for patients with all breast subtypes (all p < 0.05), while the better survival rates for BCSS and OS of the upper quadrants comparing lower quadrants only persisted in HER2-/HR+ (BCSS: p = 0.002; OS: p = 0.001) (Supplementary Fig. 1A, Supplementary Fig. 2A), and triple-negative cancer (BCSS: p = 0.04; OS: p = 0.056) (Supplementary Fig. 1D, Supplementary Fig. 2D).
Tumors Location Is Related To Tumor Resectability
To clarify the reasons leading to poor prognosis of tumors in central and nipple, we analyzed the relationship between tumor location and inoperable disease of breast cancer (TNM stage III/IV, except for T3N1M0). Variables that were significant (p < 0.001) in the univariate logistic analysis (age, race, grade, tumor size, breast subtype, marital status, and tumor location) were further included in the multivariate logistic regression analysis. Tumors located in central and nipple were more likely to be inoperable diseases (HR, 1.460, p < 0.001, 95% CI, 1.300–1.640), while tumors located in the upper quadrants tend to be operable diseases (HR, 0.895, p = 0.005, 95% CI, 0.829–0.967) (Table 3).
Table 3
Univariate and multivariate Logistic regression model of factors associated with inoperable disease.
| Variables | Subgroup | Univariable | Multivariable |
| Hazard ratio | P | Hazard ratio | P |
| Laterality | Left | 1 | 0.876 | |
| | Right | 0.995(0.941, 1.053) |
| Age | < 60 | 1 | < 0.001 | 1 | < 0.001 |
| | ≥ 60 | 0.679(0.641, 0.720) | 0.889(0.834, 0.947) |
| Race | White | 1 | < 0.001 | 1 | 0.007 |
| | Black | 1.541(1.423, 1.669) | 1.097(1.004, 1.198) |
| | Other | 1.036(0.940, 1.142) | 0.916(0.825, 1.017) |
| | Unknown | 0.542(0.322, 0.913) | 0.569(0.329, 0.983) |
| Grade | I | 1 | < 0.001 | 1 | < 0.001 |
| | II | 3.421(3.013, 3.885) | 2.208(1.936, 2.519) |
| | III and UD | 6.914(6.110, 7.824) | 2.906(2.540, 3.325) |
| | Unknown | 4.168(3.333, 5.212) | 2.193(1.725, 2.788) |
| Tumor size | ≤ 20mm | 1 | < 0.001 | 1 | < 0.001 |
| | 20-50mm | 5.944(5.540, 6.378) | 4.758(4.422, 5.119) |
| | > 50mm | 22.314(20.255, 24.582) | 16.991(15.362, 18.794) |
| | Unknown | 120.765(67.304, 216.693) | 91.057(50.547, 164.032) |
| Breast subtype | HR+/HER2- | 1 | < 0.001 | 1 | < 0.001 |
| | HR+/HER2+ | 1.972(1.818, 2.139) | 1.243(1.137, 1.359) |
| | HR-/HER2+ | 2.587(2.331, 2.871) | 1.362(1.212, 1.530) |
| | HR-/HER2- | 1.779(1.648, 1.921) | 0.866(0.792, 0.946) |
| Marital status | Married | 1 | < 0.001 | 1 | < 0.001 |
| | Not married | 1.274(1.202, 1.350) | 1.162(1.090, 1.239) |
| | Unknown | 1.026(0.893, 1.178) | 1.029(0.887, 1.194) |
| Location | Lower quadrants | 1 | < 0.001 | 1 | < 0.001 |
| | Upper quadrants | 0.974(0.907, 1.047) | 0.895(0.829, 0.967) |
| | Central and nipple | 1.839(1.654, 2.046) | 1.460(1.300, 1.640) |
| Abbreviations: UD, undifferentiated; HR: hormone receptor; HER2: human epidermal growth factor receptor 2. |