3.1 Sediment grain size
The content of sand in the sediment declined from 35.9% (1-year) to 0.2% (14-year); in contrast, the content of silt and clay increased over time, from 48.1% and 16.0% to 70.2% and 29.6%. No gravel was detected in all sediment samples (Fig. 2).
3.2 Epifauna and infauna
A total of 77 benthic macrofauna species, including 39 epifauna species (50.6%) and 38 infauna species (49.4%), were recorded during the three sampling periods in the mangrove stand in Xiamen Tong'an Bay (Table S1). The species number of benthic macrofauna decreased over time, 53 species (23 epifauna species and 30 infauna species) in the 1-year mangrove stand, 47 species (24 epifauna species and 23 infauna species) in the 9-year mangrove stand, and 25 species (16 epifauna species and 9 infauna species) in the 14-year mangrove stand.
Results of one-way ANOVA showed that the mean values of species number, abundance, biomass, and Shannon index (H') represented by epifauna, infauna, and benthic macrofauna were significantly different among the stand age groups (Table S2). Figure 3 summarized the temporal variations in the species number, abundance, biomass, and H' represented by epifauna, infauna, and benthic macrofauna (i.e., total). The mean values of species number, abundance, biomass, and H' of epifauna in the first sampling period (1-year) were significantly higher than those in the last two sampling periods (9-year and 14-year), and the mean values of species number and abundance of epifauna in the second sampling period (9-year) were significantly higher than those in the last sampling period (14-year). The mean values of species number, abundance, and H' of infauna in the first two sampling periods (1-year and 9-year) were significantly higher than those in the last sampling period (14-year), while the mean value of the biomass of infauna was highest in the second sampling period (9-year). In total, the mean values of species number and abundance of benthic macrofauna decreased significantly over time; the mean value of biomass of benthic macrofauna in the first sampling period (1-year) was significantly higher than that in the last two sampling periods (9-year and 14-year); and the mean values of H' of benthic macrofauna in the first two sampling periods (1-year and 9-year) were significantly higher than that in the last sampling period (14-year).
For epifauna, there were no significant differences in the mean values of species number, abundance, biomass, and H' among the season groups; for infauna, the mean values of species number, abundance, and biomass exhibited significant differences among the season groups, in general, showing peaks in spring; while no significant differences were identified for the mean values of H' regardless of the living position of the fauna (Table S2).
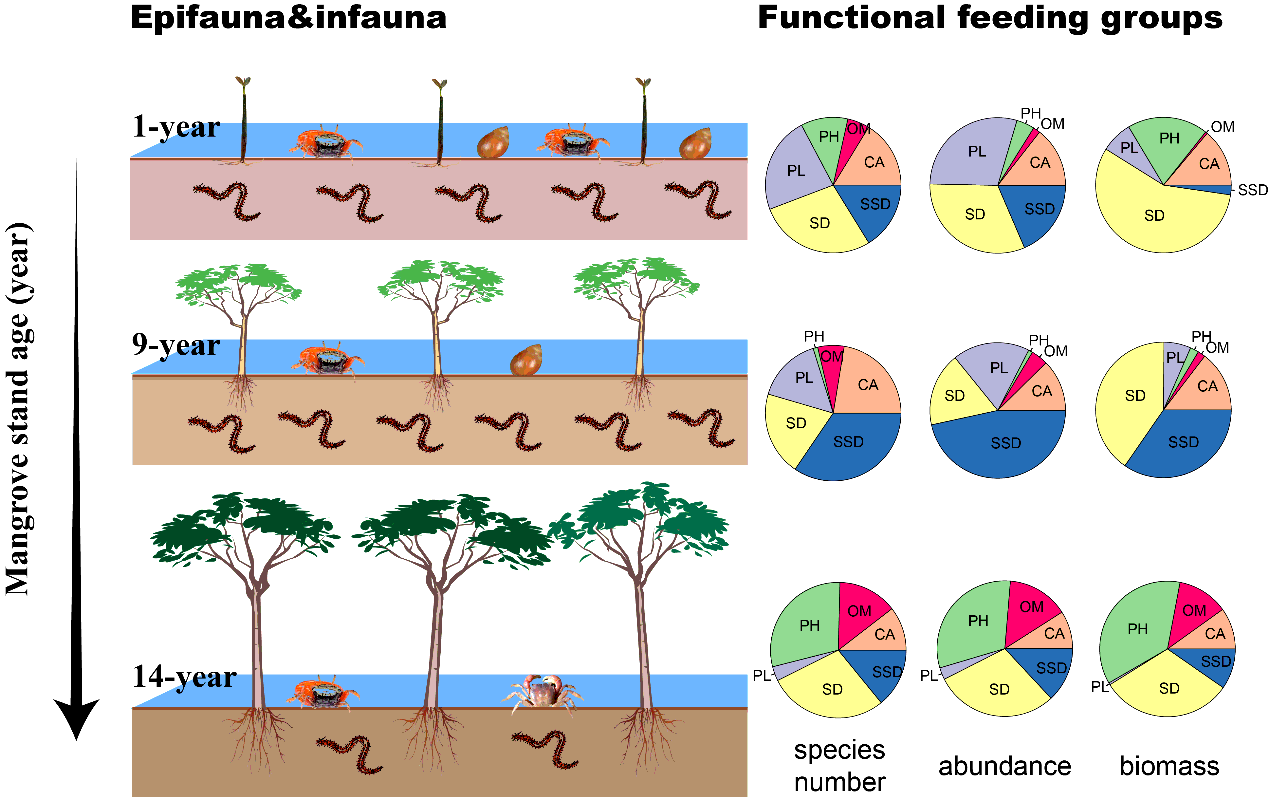
3.3 Functional feeding groups
Among the 77 species, 15 species were assigned to PH, 15 species PL, 15 species CA, 11 species SD, 12 species SSD, and 9 species OM based on their feeding modes (Table S1). The results of one-way ANOVA showed that most FFGs varied significantly among the stand age groups in terms of the proportion of species number, abundance, and biomass, except the species number of SD and OM and the abundance and biomass of CA (Table S3). Figure 4 summarized the temporal variations in the proportions of species number, abundance, and biomass represented by FFGs. The proportions of the species number, abundance, and biomass represented by PH in the second sampling period (9-year) were significantly lower than those in the other two sampling periods (1-year and 14-year, P < 0.001, when multiple P-values are involved, select the maximum, hereinafter) and reached maximum in the last sampling period (14-year). The proportions of species number represented by PL deceased significantly over time (P < 0.05), and the proportions of abundance and biomass represented by PL in the last sampling period (14-year) were significantly lower than those in the first two sampling periods (1-year and 9-year, P < 0.001). The proportion of species number represented by CA in the last sampling period (14-year) was significantly lower than that in the first two sampling periods (1-year and 9-year, P ≤ 0.007). The proportion of abundance represented by SD in the second sampling period (9-year) was lower than that in the other two sampling periods (1-year and 14-year) but exhibited significant differences only between 1-year and 9-year (P = 0.015); the proportion of biomass represented by SD decreased over time but exhibited significant differences only between 1-year and 14-year (P = 0.001). The proportions of species number, abundance, and biomass represented by SSD in the second sampling period (9-year) were significantly higher than those in the other two sampling periods (1-year and 14-year, P ≤ 0.003) and reached minimum in the last sampling period (14-year) except the proportion of the biomass, which the minimum occurred in the first sampling period (1-year). The proportions of the species number, abundance, and biomass represented by OM increased over time but exhibited significant differences only between the first (1-year) and last (14-year) sampling periods in terms of the proportions of the abundance (P = 0.023) and biomass (P = 0.018).
Significant seasonal changes were observed in the proportions of species number represented by OM, abundance represented by PL, SD, and OM, and biomass represented by PL (Table S3). The proportions of abundance and biomass represented by PL in spring were significantly higher than those in the remaining seasons (P ≤ 0.040). The proportion of abundance represented by SD in spring was lower than that in the remaining seasons but exhibited significant differences only between spring and summer (P = 0.028) and between spring and winter (P = 0.038). The proportion of species number represented by OM in spring was significantly higher than that in autumn (P = 0.026), whereas no significant differences were detected for the proportion of abundance by pairwise comparisons.
3.4 Community structure
At the 30% similarity level, three groups with significant differences (SIMPROF test, P < 0.05), which were consistent with the stand age groups, can be obtained through CLUSTER analysis (Fig. S1). More importantly, the nMDS ordination plot, overlaying the minimum spanning tree, indicated the gradual changes of macrobenthic community over time (Fig. 5).
The SIMPER analysis identified 30 species as most contributing to the intergroup dissimilarities (Table 1). Among the 30 species, the mean abundance of most epifauna (9/14) declined dramatically during the first two sampling periods (1-year and 9-year) and then remained stable or declined imperceptibly during the last two sampling periods (9-year and 14-year), while the mean abundance of two epi- crustaceans, i.e., Sesarma dehaani and S. plicata, with PH feeding mode increased slightly during the last two sampling periods (9-year and 14-year); the mean abundance of most infauna (9/16) increased during the first two sampling periods (1-year and 9-year) and then declined during the last two sampling periods (9-year and 14-year), however, the mean abundance of several infauna, e.g., oligochaetes Limnodriloides sp. and polychaetes Paraprionospio cristata, declined over time. The top five contributive species to the dissimilarities of macrofaunal communities between the first (1-year) and second (9-year) sampling periods and between the first (1-year) and last (14-year) sampling periods could be both epifauna and infauna, whereas the top five contributive species to the dissimilarity between the second (9-year) and last (14-year) sampling periods were infauna only. In addition, the feeding modes of the top five contributive species were among PL, SD, and SSD.
Table 1. The abundance and contribution rates of species to the dissimilarity of macrofaunal communities between the temporal groups (cut-off applied at 70%). The contribution rates of the top five contributing species are in bold. PH, PL, CA, SD, SSD, and OM represent phytophages, planktophages, carnivores, surface deposit feeders, subsurface deposit feeder and omnivores, respectively.
|
Species
|
Functional feeding groups (FFGs)
|
Abundance (ind./m2)
|
Contribution rate (%)
|
|
1-year
|
9-year
|
14-year
|
1-year
vs.
9-year
|
1-year
vs.
14 -year
|
9-year
vs.
14 -year
|
|
Epifauna
|
|
|
|
|
|
|
|
|
Gastropods
|
|
|
|
|
|
|
|
|
Assiminea brevicula
|
SD
|
128.5
|
0.8
|
0.0
|
6.3
|
7.9
|
|
|
Cerithidea cingulata
|
PH
|
10.5
|
0.0
|
0.0
|
2.2
|
2.6
|
|
|
Littoraia melanostoma
|
PH
|
6.0
|
0.0
|
0.0
|
1.6
|
2.0
|
|
|
Crustaceans
|
|
|
|
|
|
|
|
|
Alpheus sp.
|
CA
|
1.0
|
4.8
|
1.2
|
|
|
2.6
|
|
Chasmagnathus convexus
|
SD
|
0.0
|
5.2
|
2.8
|
|
|
2.6
|
|
Corophium sp.
|
PL
|
663.5
|
0.8
|
0.0
|
7.0
|
7.9
|
|
|
Exopalaemon orientalis
|
CA
|
46.5
|
4.8
|
0.4
|
3.2
|
4.4
|
|
|
Ilyoplax tansuiensis
|
SD
|
49.0
|
10.8
|
4.0
|
3.2
|
3.2
|
3.2
|
|
Macrophthalmus definitus
|
SD
|
62.0
|
4.8
|
4.4
|
4.4
|
4.8
|
2.2
|
|
Metapenaeus ensis
|
CA
|
11.5
|
2.4
|
0.8
|
1.5
|
1.8
|
|
|
Metaplax longipes
|
SD
|
0.5
|
5.6
|
0.0
|
|
|
2.4
|
|
Sesarma dehaani
|
PH
|
0.0
|
0.4
|
10.4
|
|
2.5
|
4.1
|
|
Sesarma plicata
|
PH
|
0.0
|
0.0
|
4.0
|
|
|
2.2
|
|
Uca arcuata
|
SD
|
16.0
|
1.6
|
0.8
|
2.0
|
2.5
|
|
|
Infauna
|
|
|
|
|
|
|
|
|
Nemertean
|
|
|
|
|
|
|
|
|
Cerebratulina sp.
|
CA
|
6.5
|
12.4
|
0.0
|
|
1.9
|
3.9
|
|
Oligochaetes
|
|
|
|
|
|
|
|
|
Limnodriloides sp.
|
SSD
|
41.5
|
2.0
|
0.0
|
2.9
|
4.0
|
|
|
Polychaetes
|
|
|
|
|
|
|
|
|
Capitella capitata
|
SSD
|
0.5
|
8.4
|
1.6
|
1.6
|
|
2.8
|
|
Ceratonereis tripartita
|
OM
|
10.0
|
0.0
|
0.0
|
1.7
|
2.0
|
|
|
Chaetozone setosa
|
SSD
|
1.5
|
208.4
|
1.2
|
6.3
|
|
11.9
|
|
Eteone delta
|
CA
|
13.0
|
0.0
|
0.0
|
2.5
|
3.0
|
|
|
Glycera chirori
|
CA
|
3.0
|
3.2
|
0.0
|
|
|
2.1
|
|
Mediomastus chinensis
|
SSD
|
134.0
|
0.0
|
1.2
|
6.5
|
7.2
|
|
|
Neanthes glandicinta
|
OM
|
0
|
19.6
|
6.0
|
1.8
|
1.9
|
3.1
|
|
Nephtys oligobranchia
|
SSD
|
6.0
|
24.8
|
0.8
|
1.8
|
|
5.2
|
|
Notomastus latericeus
|
SSD
|
3.0
|
12.4
|
0.0
|
|
|
4.3
|
|
Paraprionospio cristata
|
PL
|
103.5
|
89.6
|
0.8
|
6.4
|
7.3
|
4.4
|
|
Prionpspio japonica
|
PL
|
1.0
|
17.6
|
0.0
|
2.4
|
|
5.7
|
|
Scoloplos rubra
|
SSD
|
2.0
|
10.4
|
0.4
|
|
|
3.2
|
|
Spio martinensis
|
PL
|
7.0
|
0.8
|
0.0
|
1.5
|
2.2
|
|
|
Sipuncula
|
|
|
|
|
|
|
|
|
Phascolosoma arcuatum
|
SSD
|
0.0
|
21.2
|
1.2
|
3.0
|
|
5.5
|
|
Dissimilarity (%)
|
|
|
|
|
79.5
|
90.0
|
80.8
|