Patients
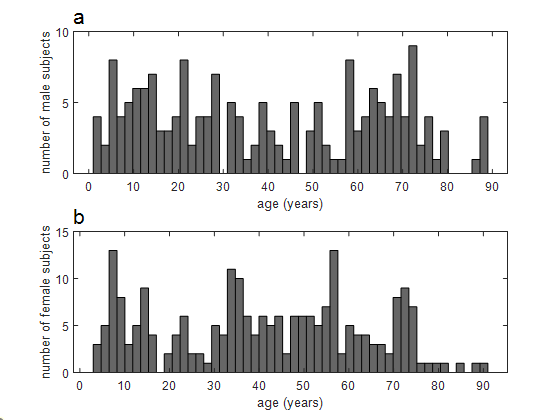
The data used in this study was acquired from patients receiving standard of care 18F-FDG scans at our institution, mostly for the diagnosis and monitoring of cancerous lesions. Patients were excluded if they were diagnosed with a non-solid tumor type, had extensive disease, had any indication of lesions within an organ being measured or were imaged outside of the 55–75 minute post injection time window recommended by the European Association of Nuclear Medicine (EANM) [17] and the Quantitative Imaging Biomarkers Alliance (QIBA) [18]. A total of 481 patients meeting these criteria were included in the study. A subset of these (100 in all) were specifically sought after, selected based on their age (15 or under) in order to enrich the sample with smaller sized subjects.
Of the 481 patients, 65 had only their normal brain 18F-FDG uptake measured. The remaining 416 patients were randomly divided into a 330 subject training group that received only normal liver uptake measurements and an 86-member test group within which normal liver, spleen and blood 18F-FDG concentrations were measured. Of the 330 training group members, 153 were adult women, 116 were adult men and 61 were pediatric patients (note – here the division between pediatric and adult was taken to be 12 years of age, i.e. “adults” > 12 y). Within the test cohort there were 45 adult women, 31 adult men and 10 pediatric patients. And within the brain-only cohort, there were 14 adult women, 29 adult men and 22 pediatric patients.
Subjects were included regardless of what PET scanner model was used, so the cohort includes a mixture of scans from various GE PET cameras including Discovery PET/CT models DST, DSTE, D600, D690, D710, 3-ring DMI, 5-ring DMI and a Signa PET/MR. This data was reviewed under the auspices of a retrospective research protocol which, given the lack of risk posed to the patients by this study, allowed for a waiver of consent.
Measurements: Within the training and test cohort patient scans a single large region of interest (ROI) representing a volume of approximately 14 ml, was drawn over a representative homogeneous central region of the liver, well away from the diaphragm. Within the test cohort scans, addition ROIs were placed over homogenous regions well within the descending aorta (to measure the blood concentration), and spleen. Within scans of the brain-only test cohort, a single ROI was placed over a frontal grey matter region. In addition to the mean radioactivity concentration within these regions, the following measures describing the patient scan were compiled: patient age at time of scan, weight, height, sex, injected radioactivity and the time interval between the injection and when the bed position over a measured region was acquired. All radioactivity concentration measures were appropriately decay corrected and divided by the injected activity to arrive at units of %ID/ml. This value was then multiplied by the patient’s body weight in grams, which if one assumes 1 g/ml, results in unitless SUVbw values. The values were also multiplied by the calculated body surface-area and lean-body mass to arrive at SUVbsa and SUVlbm measures, respectively; making use of the body-surface area estimation function proposed by Du Bois [19] and the lean-body mass function used by Lodge and Wahl for PERCIST [20].
Model Development
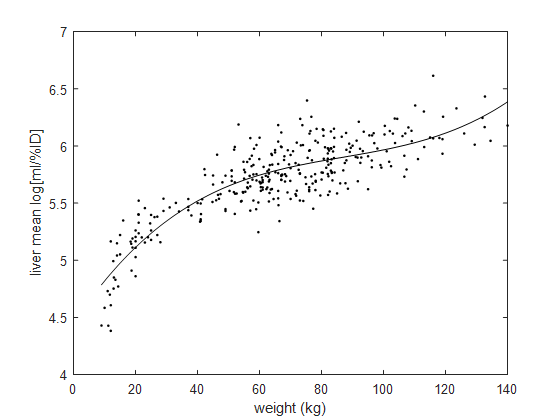
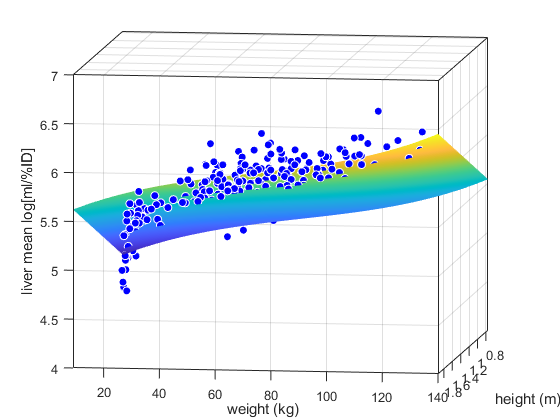
In seeking an empirical functional form that would well describe the relationship between the liver mean %ID/ml and body habitus, we first reasoned that these two quantities should be roughly inversely proportional and therefore chose to attempt to model the multiplicative inverse of the liver %ID/ml (i.e. its mean concentration in units of ml/%ID). Moreover, since it was our preference that our model achieve specifically a high percent accuracy and result in only positive normalizing values, we chose to fit its log values (i.e. log[ml/%ID]).
Through some experimentation with the training set, least squares fits of various functions were compared [Curve Fitting Toolbox v 3.5.11, The MathWorks, Inc.] and a subjective “best” was selected making use of Bayesian (BIC) [21] and Akaike information criteria (AIC) [22], the adjusted R-squared value [23] of the fits and a visual examination of the residuals.
Model Validation and Testing
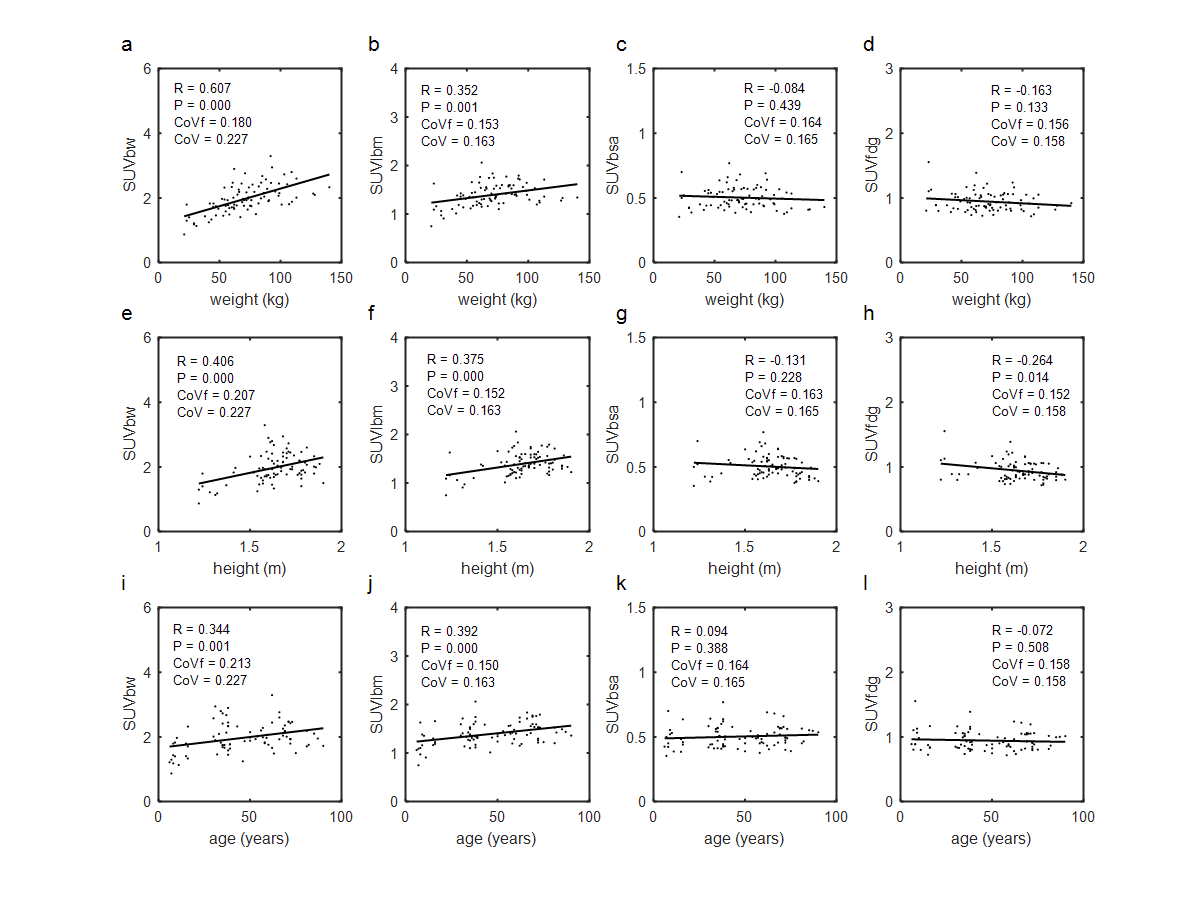
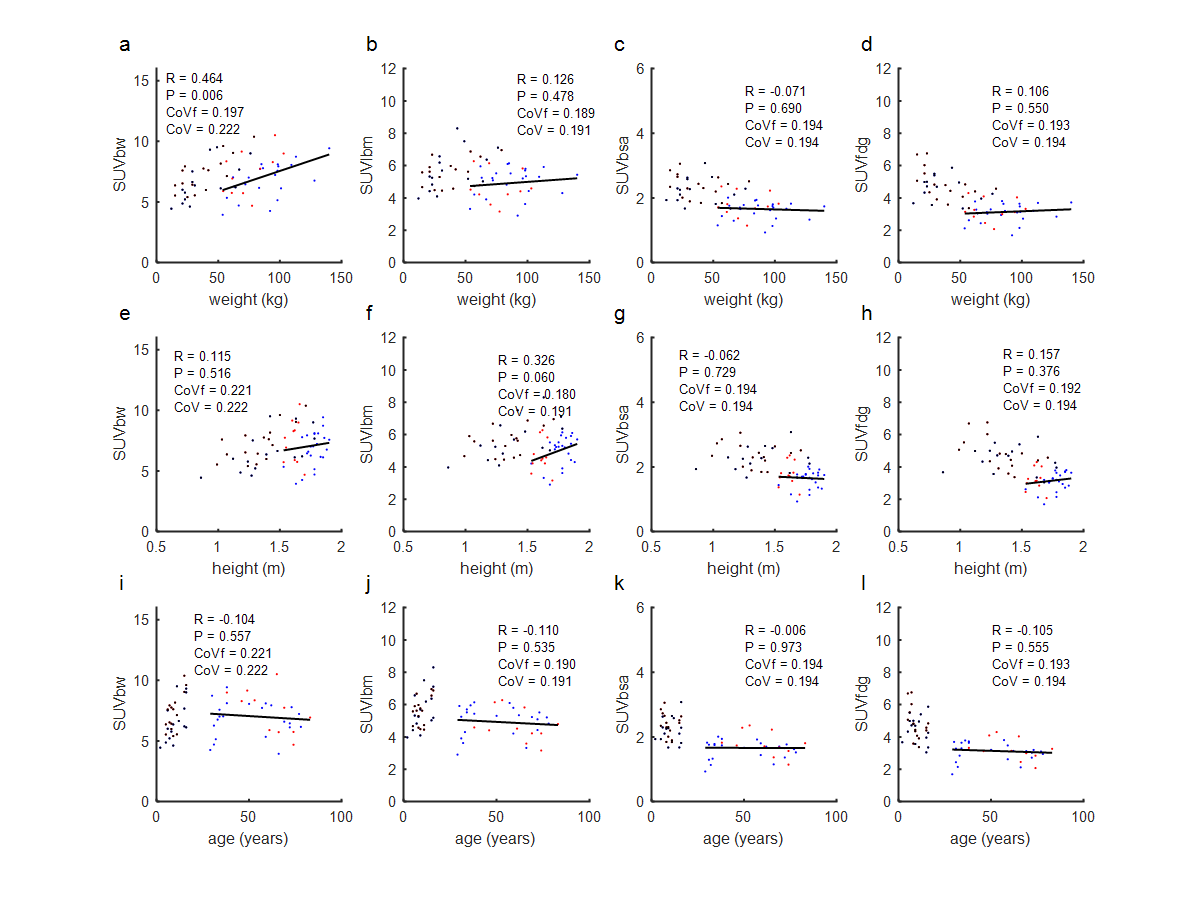
Using the selected fitting function model, the training set was then entered into a 5-fold cross-validation study. In this study the training set was first randomly divided into five subgroups each containing 20% (i.e. 66) of the patients. Each of the 5 groups was then, in turn, used as a validation set, with the remaining 80% (264 patients) used to train (i.e. fit) the model. In each of the five validations, CoVs and correlations to height and weight for each of the four SUV metrics (SUVbw, SUVlbm, SUVbsa and SUVfdg) were calculated and based on these numbers the performance of our proposed body habitus normalizing (BHN) function was assessed.
Following this validation, a single fitting procedure using the selected BHN model was applied to the entire 330 patient training set to determine its parameter values. This BHN function was then used to calculate the SUVfdg values for all the normal tissue measurements taken from the two test sets. As was done in the cross-validation, SUVbw, SUVlbm and SUVbsa values were determined and compared based on their CoVs and correlations to height and weight, but in addition for the test cohorts correlation to age was also tested.
Statistics
For every test of a linear relationship between a variable (SUV, residual, etc.) to patient height, weight or age, a Pearson’s correlation coefficient R and associated P value were determined. This P value indicates the probability of seeing a sample correlation coefficient of that magnitude when the true population correlation is zero and was calculated using two tails of a t-distribution with n-2 degrees of freedom (where n is the number of samples) after first converting the R value to a t-statistic using the formula  In all cases significance was assessed at an alpha level of 0.05, corrected for multiple comparisons following Bonferroni [24] where indicated. The comparison of adult and pediatric brain SUVfdg values was made with an unpaired two-tailed, two sample t-test assuming unequal variances.


