3.1. ELF Topological analysis in the GS of the reagents
The topological analysis of the ELF [43, 44] allows characterizing the electronic structure of three atom components (TACs) and consequently establishing the correlation of the electronic structure with its molecular reactivity to participate in 32CA reactions. TACs can be classified as pseudodiradical [71], pseudo(mono)radical [72], carbenoid [73] and zwitter-ionic [28, 29] types with decreasing order of reactivity. A pseudodiradical TAC shows the highest reactivity and is characterized by the presence of two pseudoradical centers (monosynaptic basin integrating less than 1 e), while a pseudo(mono)radical TAC with relatively reduced reactivity shows the presence of one pseudoradical center. The simplest azomethine ylide (AY) is classified as a pseudodiradical TAC with non-appreciable energy barrier of 1 kcal mol− 1 in the 32CA reaction with ethylene [71]. Herein, the ELF of the cyclic AY 1 is performed and the localization domains along with the most significant valence basin populations are given in Fig. 1. The ELF of 1 shows the presence of V(O1) and V'(O1) integrating the total population of 5.54 e associated with the non-bonding electron density in O1 oxygen, disynaptic V(N2,C1) and V(N2,C3) basins integrating 2.77 and 2.37 e associated respectively with the N2-C1 and N2-C3 bonding regions. The ELF does not show the presence of any pseudoradical center, implying the change in the pseudodiradical electronic structure of the simplest AY to zwitterionic one in the cyclic AY 1. The ELF of alkene 2 shows the presence of V(C4,C5) and V'(C4,C5) disynaptic basins integrating total population of 3.30 e associated with the underpopulated C4-C5 double bond.
The Lewis like structure proposed on the basis of ELF study is represented in Fig. 2 along with the natural atomic charges. The C1 and C3 carbon of simpler AY shows a negative charge of -0.35 e, while AY 1 shows negligible charge of 0.03 e at C1 and negative charge of -0.18 e at C3, owing to the change in the electronic structure due to substituent effect. The negative charge of -0.29 e at N2 nitrogen discards the commonly used zwitter-ionic structure of AY, implying that the electronic structure is the outcome of the overall molecular electron density distribution.
3.2. Analysis of the CDFT indices at the GS of the reagents
Analysis of the global reactivity indices defined within the CDFT [45, 46] allows assessing the electronic behavior of the reagents and accordingly the polarity of the corresponding 32CA reaction. Herein, the electronic chemical potential [18] µ, chemical hardness [74] η, electrophilicity [75, 76] ω, and nucleophilicity [77] N, are calculated at the B3LYP/6-31G(d) level of theory and listed in Table 1 to characterize the reagents within the standard scales defined at the same computational level [75–77]. The electronic chemical potential µ of AY 1 (µ = -3.50 eV) is higher than that of alkene 2 (µ = -3.50 eV), suggesting electronic flux from 1 to 2. Although 1 and 2 both are classified as strong electrophiles within the standard scale, the relative nucleophilicity of 1 classified as a strong nucleophile is much higher than that of 2 classified as a moderate nucleophile. Thus, along the corresponding polar 32CA reaction, reactant 1 will behave as a nucleophile and 2 as the electrophilic counterpart.
Table 1
B3LYP/6-31G(d) electronic chemical potential µ, chemical hardness η, electrophilicity ω, and nucleophilicity N, in eV, of the reactants 1 and 2
| |
µ
|
η
|
ω
|
N
|
|
1
|
-3.50
|
2.75
|
2.22
|
4.24
|
|
2
|
-4.83
|
4.22
|
2.77
|
2.18
|
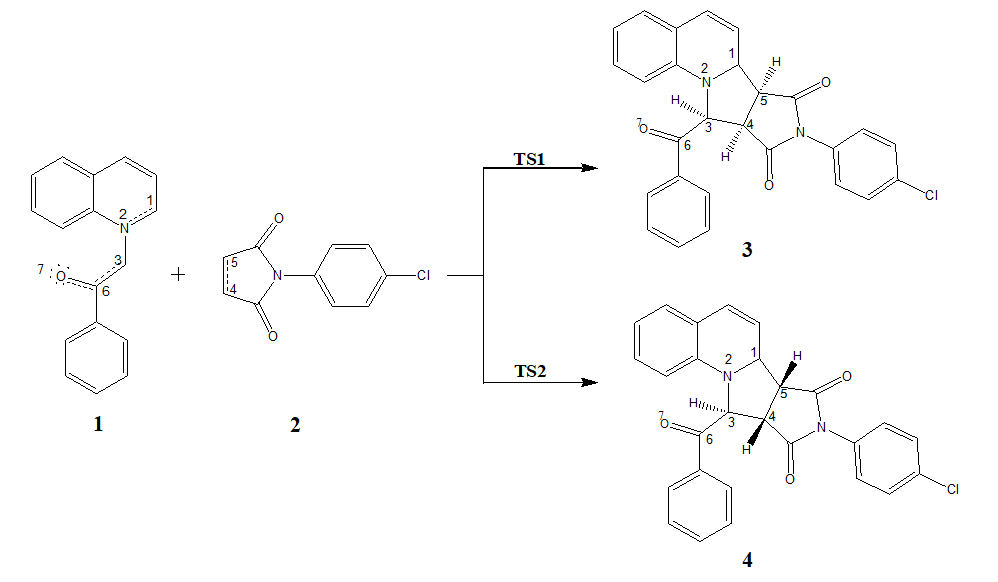
3.3 Analysis of the potential energy surface (PES) along the feasible reaction paths associated with the 32CA reaction of 1 and 2
The 32CA reaction of 1 and 2 can take place along two feasible stereoisomeric reaction paths. Search for the stationary points along these two reaction paths allowed locating the reagents, products and only one TS along each reaction path, namely TS1 and TS2 leading to pyrrolo [1,2-a] quinolines 3 and 4 respectively, implying one-step mechanism for this 32CA reaction (Scheme 3).
The relative electronic energies of the TSs and the products in gas phase and in water, methanol, ethanol, acetonitrile and chloroform along with the relative enthalpies, entropies, and free energies in the solvents are given in Table 2. The energy profile study allows arriving at some appealing conclusions. (1) The 32CA reaction of 1 with 2 is exergonic with negative reaction free energies in the organic solvents (methanol, ethanol, acetonitrile and chloroform) and water, suggesting kinetic control in the generation of the cycloadducts (2) The activation free energy of TS2 is lowered than that of TS1 by 1.9 kcal mol− 1 in water, 2.5 kcal mol− 1 in methanol and acetonitrile, 2.6 kcal mol− 1 in ethanol and 3.7 kcal mol− 1 in water. This is in complete agreement with the experimental outcome showing the generation of pyrrolo [1,2-a] quinoline 4 in each case (3) Note that the activation free energy in water and the organic solvents are comparable, indicating minimal solvent effects on the course of the reaction, which makes the system more feasible for green synthesis using water as reported experimentally [17, 66]. (4) The activation enthalpies are increased between 1.5 and 6.3 kcal mol− 1 relative to the activation energies, the highest thermodynamic correction is observed in chloroform. (5) The activation free energies are increased between 11.3 and 12.5 kcal mol− 1 relative to the activation enthalpies, and the reaction free energies are decreased between 12.2 and 13.3 kcal mol− 1 relative to the reaction enthalpies due to the presence of unfavourable entropies associated with this bimolecular reaction.
Table 2
B3LYP/6-311 + + G(d,p) relative electronic energies (∆E, in kcal·mol− 1) in gas phase and solvents and the relative enthalpies (∆H, in kcal·mol− 1), entropies (∆S, in cal·mol− 1K− 1) and Gibbs free energies (∆G, in kcal·mol− 1), in solvents, of the stationary points involved in the 32CA reaction of 1 and 2
| |
|
TS1
|
TS2
|
3
|
4
|
|
∆E
|
Gas phase
|
9.0
|
3.9
|
-23.8
|
-27.2
|
|
Water
|
10.6
|
7.6
|
-19.0
|
-22.0
|
|
Methanol
|
10.1
|
7.5
|
-19.0
|
-22.1
|
|
Ethanol
|
10.3
|
7.2
|
-19.1
|
-22.4
|
|
Acetonitrile
|
10.6
|
7.6
|
-14.9
|
-22.1
|
|
Chloroform
|
5.6
|
2.7
|
-23.8
|
-26.9
|
|
∆H
|
Water
|
12.1
|
9.1
|
-15.3
|
-18.3
|
|
Methanol
|
12.1
|
9.0
|
-15.5
|
-18.4
|
|
Ethanol
|
12.1
|
8.9
|
-15.5
|
-18.5
|
|
Acetonitrile
|
12.1
|
9.0
|
-15.4
|
-18.4
|
|
Chloroform
|
11.9
|
8.0
|
-16.4
|
-19.7
|
|
∆S
|
Water
|
-37.9
|
-41.6
|
-42.6
|
-43.5
|
|
Methanol
|
-39.1
|
-40.9
|
-40.6
|
-44.1
|
|
Ethanol
|
-38.9
|
-40.7
|
-42.3
|
-44.0
|
|
Acetonitrile
|
-38.9
|
-40.9
|
-42.7
|
-44.0
|
|
Chloroform
|
-41.2
|
-42.0
|
-42.0
|
-44.5
|
|
∆G
|
Water
|
23.4
|
21.5
|
-2.6
|
-5.3
|
|
Methanol
|
23.7
|
21.2
|
-3.3
|
-5.3
|
|
Ethanol
|
23.7
|
21.1
|
-2.9
|
-5.3
|
|
Acetonitrile
|
23.7
|
21.2
|
-2.7
|
-5.2
|
|
Chloroform
|
24.2
|
20.5
|
-3.9
|
-6.4
|
The B3LYP/6-311 + + G(d,p) optimized gas phase geometries of TS1 and TS2 are shown in Fig. 3 and the forming C3-C4 and C1-C5 bond distances along with the bond development indices and asymmetry index are listed in Table 3.
The forming C1-C5 bond distance is greater than that of C3-C4 in each case and the bond development index [66] lC3−C4 is higher than lC1−C5 with the asymmetric index between 0.194 and 0.432, suggesting early C3-C4 bond formation in agreement with the topological analysis of the ELF along the reaction path (see later). Now, considering the formation of C-C bond at the distance of 1.9 Å, it is implied that the formation of C-C covalent bond has not been started at the TSs showing the bond distances above 2.0 Å in each case (Table 3).
The GEDT [47] at the TSs show values between 0.31 e and 0.61 e, suggesting polar character of this 32CA reaction with the electronic flux from 1 to 2, allowing classification as forward electron density flux [78] (FEDF) consistent with the global reactivity indices defined within the CDFT (Table 1).
Table 3
The forming C3-C4 and C1-C5 bond distances in angstrom units along with the bond development indices lC3−C4 and lC1−C5, asymmetry index ∆a and the global electron density transfer (GEDT) in average number of electrons at the TSs associated with the 32CA reactions of 1 and 2.
| |
TSs
|
C3-C4
|
C1-C5
|
lC3−C4
|
lC1−C5
|
∆a
|
GEDT
|
|
Gas Phase
|
TS1
|
2.111
|
2.430
|
0.644
|
0.450
|
0.194
|
0.31
|
|
TS2
|
2.078
|
2.640
|
0.671
|
0.305
|
0.366
|
0.37
|
|
Water
|
TS1
|
2.070
|
2.703
|
0.669
|
0.276
|
0.392
|
0.61
|
|
TS2
|
2.104
|
2.772
|
0.653
|
0.221
|
0.432
|
0.24
|
|
Methanol
|
TS1
|
2.070
|
2.701
|
0.680
|
0.263
|
0.417
|
0.44
|
|
TS2
|
2.102
|
2.772
|
0.651
|
0.226
|
0.425
|
0.45
|
|
Ethanol
|
TS1
|
2.070
|
2.701
|
0.680
|
0.263
|
0.417
|
0.44
|
|
TS2
|
2.102
|
2.772
|
0.651
|
0.226
|
0.425
|
0.45
|
|
Acetonitrile
|
TS1
|
2.070
|
2.703
|
0.680
|
0.263
|
0.417
|
0.44
|
|
TS2
|
2.104
|
2.772
|
0.649
|
0.226
|
0.423
|
0.45
|
|
Chloroform
|
TS1
|
2.070
|
2.701
|
0.680
|
0.263
|
0.417
|
0.41
|
|
TS2
|
2.101
|
2.769
|
0.651
|
0.228
|
0.423
|
0.43
|
2.4. BET study of the molecular mechanism of the 32CA reaction of 1 with 2
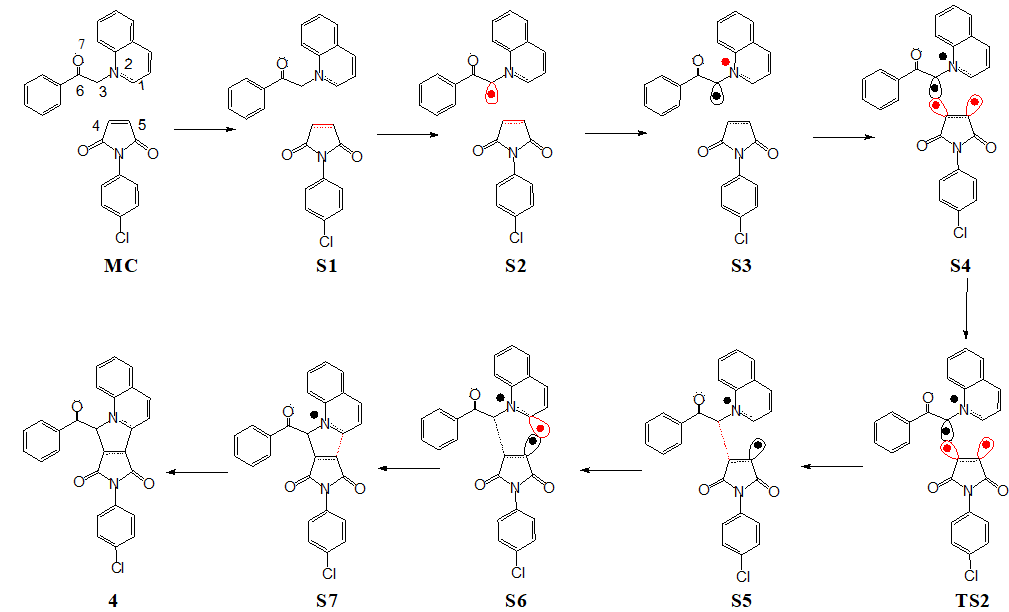
The bonding evolution theory [48] (BET) analysis, represents the conjunction of ELF topological analysis [43, 44] and the Thom Catastrophe theory [48] and has been applied herein to propose the molecular mechanism throughout the preferred reaction leading to pyrrolo [1,2-a] quinoline 4. The plot of basin population in average number of electrons along the reaction coordinate associated with the 32CA reaction of 1 and 2 is represented in Fig. 4 defining the eight ELF topological phases, while the basin attractor positions along with their localization domains associated with the formation of new C1-C4 and C3-C5 bonds are shown in Fig. 5. The molecular mechanism arising out of the BET study is represented in Scheme 4.
The 32CA reaction of 1 with 2 can be divided into eight ELF topological phases. Phase I begins at the molecular complex MC that corresponds with the minimum of the IRC similar to the initial separated reagents (see Fig. 1). Phase II begins at the structure S1 (dC1−C4 = 2.98 Å; dC3−C5 = 2.71 Å). In this phase, the V(C4,C5) and V’(C4,C5) disynaptic basins are merged into a single V(C4,C5) disynaptic basin associated with the C4-C5 bonding region. Phase III begins at the structure S2 (dC1−C4 = 2.76 Å; dC3−C5 = 2.38 Å), at the energy cost of 1.9 kcalmol− 1. In this phase, the V(C3) monosynaptic basin integrating 0.45 e associated with the pseudoradical center at C3 carbon is created. Phase IV begins at the structure S3 (dC1−C4 = 2.69 Å; dC3−C5 = 2.20 Å), where, the V(N2) monosynaptic basin integrating 0.40 e associated with the non-bonding electron density at N2 nitrogen is created, which derives electron density from the N2-C1 bonding region experiencing depopulation of 0.34 e from S2 to S3. Phase V begins at the structure S4 (dC1−C4 = 2.66 Å; dC3−C5 = 2.14 Å), and is characterized by the formation of V(C4) and V(C5) monosynaptic basin integrating 0.18 e and 0.07 e associated with the creation of pseudoradical center at C4 and C5 carbons respectively by deriving electron density from the C4-C5 bonding region. The transition state TS2 (dC1−C4 = 2.64 Å; dC3−C5 = 2.08 Å) is observed in this phase at the energy cost of 3.9 kcalmol− 1. Thus, the activation energy of this 32CA reaction is associated with the depopulation of the N2-C1 and C4-C5 bonding regions, formation of non-bonding electron density at N2 nitrogen and creation of pseudoradical centers at C3, C4 and C5. Phase VI begins at the structure S5 (dC1−C4 = 2.59 Å; dC3−C5 = 1.96 Å) in which the first most significant change takes place with the formation of V(C3,C5) disynaptic basin integrating 1.24 e at the distance of 1.96 Å by coupling of the C3 and C5 pseudoradical centers. Phase VII begins at the structure S6 (dC1−C4 = 2.32 Å; dC3−C5 = 1.64 Å). In this phase, the V(C1) monosynaptic basin integrating 0.22 e associated with the pseudoradical center at C1 carbon is created, which derives electron density from the N2-C1 bonding region experiencing depopulation of 0.28 e from S5 to S6. Finally, Phase VIII begins at the structure S7 (dC1−C4 = 2.01 Å; dC3−C5 = 1.61 Å), in which the second most relevant change takes place with the creation of V(C1,C4) disynaptic basin integrating 1.32 e associated with the formation of C1-C5 single bond at the distance of 2.01 Å by coupling of the C1 and C5 pseudoradical centers. The molecular geometry is finally relaxed by 27.2 kcalmol− 1 in the pyrrolo [1,2-a] quinoline 4.
2.5. Topological analysis of the ELF and AIM at the TSs associated with the 32CA reaction of 1 and 2
The topological analysis of the ELF [43, 44] at the TSs associated with the 32CA reaction was performed to study the electronic structure. The ELF localization domains along with the most significant ELF valence basin population at TS1 and TS2 are shown in Fig. 6. The ELF of both TSs show the presence of V(N2) monosynaptic basin integrating 0.78 e and 0.58 e respectively at TS1 and TS2, which is created along the reaction path and is not found in 1. The N2-C1 and N2-C3 bonding regions integrating 2.77 e and 2.37 e in 1 experience depopulation to 2.34 e and 2.08 e in TS1 and to 2.48 e and 2.11 e at TS2 to create the non-bonding electron density at N2 nitrogen. The ELF of both TS1 and TS2 also show the presence of V(C3) monosynaptic basin integrating 0.79 e and 0.75 e respectively associated with the creation of pseudoradical center at C3, and the V(C4) and V(C5) monosynaptic basins integrating 0.30 e and 0.24 e at TS1 and 0.26 e and 0.16 e at TS2 associated with the creation of pseudoradical centers at C4 and C5 carbons. Note that the C4-C5 bonding region integrating 3.30 e in 2 is depopulated to 2.70 e in TS1 and 2.77 e in TS2 along the reaction path to create the pseudoradical centers at C4 and C5. Both TS1 and TS2 do not show the presence of V(C3,C4) and V(C1,C5) disynaptic basins, indicating that the formation of new C3-C4 and C1-C5 bonds has not been started at the TSs.
The topological analysis of the atoms in molecules (AIM) proposed by Bader and coworkers [50, 51] has been applied herein to study the interatomic interactions at the TSs. The calculated QTAIM parameters, namely the total electron density and Laplacian of electron density at the TSs are listed in Table 4. The total electron density at BCP1 associated with the C1-C5 interatomic region is less than that at BCP2 associated with the C3-C4 interatomic region, consistent with the earlier C3-C4 bond formation implied from the BET study. The positive Laplacian of electron density and total electron density less than 0.1 e imply non-covalent interactions [52] (NCIs), which are revealed as weak interactions from visualization of NCI isosurfaces shown in Fig. 7.
Table 4
B3LYP/6-311 + + G(d,p) total electron density, ρ (e·Å−3), and Laplacian of electron density, (e·Å−5), at BCP1 and BCP2 of the TSs associated with the 32CA reaction of 1 and 2.
| |
BCP1 (C1-C5)
|
BCP2 (C3-C4)
|
| |
ρ
|
|
ρ
|
|
|
TS1
|
0.022
|
0.047
|
0.078
|
0.016
|
|
TS2
|
0.019
|
0.045
|
0.073
|
0.024
|