3.1 Mechanical properties
Tensile properties are the most frequently used indicator of changes caused by plasticization. Results of the tensile measurements, including tensile strength, tensile modulus and elongation at break are displayed graphically in Figures 1, 2 and 3. Figure 1 shows that the addition of gradual amounts of ESBO, ESO5.5% and ESO6.5% plasticizers into PLA matrix improved the tensile strength of PLA. At 20 wt %, the most efficient plasticizer is the ESO6.5% that reduced tensile strength from 13.3 MPa to 8 MPa. At low loading of 10 wt % as at high loading of 40 wt %, there were no significant differences in tensile strength between plasticizers.
Tensile strength of plasticized PLA decreased with increasing amount of plasticizers. At higher plasticizer loading, only a part of the plasticizer was located in the interfacial area, while the rest is penetrated into the polymer mass, separating chains and thus reducing intermolecular forces between them and consequently reducing the tensile strength of the plasticized PLA [24-25].
The shape of tensile modulus curves is analogous to that of tensile strength. The decrease of tensile modulus indicates an increase in samples’ flexibility due to the diminution of chains interactions induced by the presence of plasticizers.
Neat PLA exhibited an elongation at break of 5 % (Figure 3). The addition of plasticizers increased elongation at break of PLA. An optimum (9.02%, 15.55% and 33.67% for ESBO, ESO5.5% and ESO6.5% respectively) is reached at a content of 20 wt % of plasticizer. . Beyond that, the addition of
An optimum is reached at a content of 20% by weight of plasticizer.Un optimum est atteint à une teneur de 20% en poids de plastifiant. Elongation at break is defined as the ability of film to deform before finally breaking. This parameter helps to determine the flexibility and stretch ability of films. Elongation of polymeric materials depends on the mobility of their molecular chains. The increasing in films elongation can be explained by the fact that plasticizers decrease the intermolecular bonds between polymer chains and substitute them with hydrogen bonds formed between plasticizer and polymer chains. Such disruption and reconstruction of polymer chains interactions reduce the rigidity and promote the flexibility of films by allowing more chains mobility [26, 27].
Figure 4 shows the evolution of Shore D hardness as a function of plasticizers contents (ESBO and ESO). The addition of plasticizers leads to softer materials with decreasing hardness as the plasticizer content increases. Nevertheless, the best efficiency can be observed for PLA/ESO6.5% by a decrease from 71 to 46 at a level of 20 wt %. These results are in total agreement with previous mechanical characterization, thus indicating the high efficiency of ESO6.5% versus ESO5.5% and ESBO for PLA plasticization.
According to the results of mechanical characterization, the use of 20 wt.% EVO reduced the intermolecular interactions between the polymeric chains and increased their mobility improving the flexibility and plastic deformation of PLA.
The most efficient plasticizer is ESO6.5% at 20 wt % due to more important intermolecular interactions with PLA. In the rest of this study the effect of plasticizers at 20 wt % was investigated.
3.2 FT-IR spectroscopy
FT-IR spectroscopy was used to control the known functional group interactions of PLA with epoxidized vegetable oils and compare different plasticized PLA. Yin et al. [28] stressed that when two or more substances are mixed, physical blends versus chemical interactions are reflected by changes in the characteristic spectral bands. Figure 5 shows the FT-IR spectra of PLA in absence and presence of 20 wt % of ESBO, ESO5.5% or ESO6.5% from 500 to 4000 cm-1.
Ester group of PLA exhibits characteristic peaks at 1748, 1187 and 1090 cm-1 corresponding respectively to C=O stretching vibration, the asymmetrical valence vibrations of C-O-C and symmetrical valence vibrations of C-O-C of the aliphatic chain as Ristić and al. reported [29]. Changes in the position and intensity of these peaks were observed for the blends materials. The peak at 871 cm-1 can be assigned to the amorphous phase, while the peak at 756 cm-1 can be assigned to the crystalline phase as reported by Younes and Cohn [30]. Similar findings were reported by Auras and al. [31].
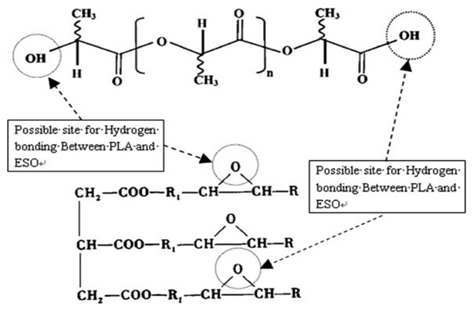
A relatively small peak at approximately 3500 cm-1 is visible for neat PLA due to the presence of hydroxyl groups. The FTIR spectra indicate that there are interactions between PLA and plasticizers. The characteristic peak of PLA at 1748 cm-1 has neutralized at 1752 cm-1 with the incorporation of plasticizers, and the peak at 3465 cm-1 was shifted to a broad peak at 3500 cm-1. Hydrogen bonding could occur between the carbonyl group (from ester linkage) in PLA and the epoxy group in plasticizers [32, 33]. Proposed possible sites for interactions between PLA and ESO are shown in Scheme 2.
3.3 Differential scanning calorimetry investigation
DSC is a very useful technique to study the glass transition temperature, crystallization temperature, and melting behavior. DSC thermograms of neat and plasticized PLA are shown in Figure 6.
Neat PLA showed a clear Tg at 71.81°C. The addition of 20 wt % of ESBO, ESO5.5% and ESO6.5% decreased Tg to 69.07°C, 70.31°C and 68.45°C respectively indicating that these plasticizers are miscible with PLA. With similar loading of plasticizers incorporated, ESO6.5% exhibited relatively the most important effect on Tg which indicates the best plasticizing effect. This decrease in Tg can be explained on the base of increased mobility of the soft segments because of the penetration of plasticizers molecules into PLA hard segments [35]. The incorporation of plasticizers at various loadings did not result in any trace of separate melting or crystallization of EVO, indicating that the phase separation of EVO did not occur.
Furthermore, cold-crystallization was chosen as a crystallization method because it leads to a more intense spherulite nucleation resulting in shorter crystallization time and smaller spherulite sizes [35]. Figure 6 shows that neat PLA present a cold-crystallization temperature (Tcc) at about 124.11°C. Tcc of PLA decreased by the addition of plasticizers, which suggests that plasticizer enhanced the ability to cold-crystallization of PLA. It is apparent that the (Tcc) of PLA decreased with plasticizers addition, in parallel with the shift in Tg. The Tcc decreased to 113.40 °C, 115.06 °C and 108.43 °C for ESBO, ESO5.5 and ESO6.5 respectively. The significant drop of Tcc and the decrease in Tg indicates that the EVO are compatible with PLA. The decrease of Tcc and Tg of PLA occurred because of enhanced chains mobility with the plasticizer content [36]. Enhanced chain mobility increased the rate of crystallization, which allowed PLA to crystallize at lower temperature [37].
Neat PLA showed an endothermic peak of melting, Tm = 145.68 °C. A minor decrease in the melting temperature (3.10 °C for PLA/ESBO, 1.57 °C for PLA/ESO5.5% and 0.95 °C for PLA/ESO6.5%) was observed, indicating that the melting temperature of PLA was not greatly affected by the addition of plasticizers.
3.4 Optical microscopy analysis
To give a clearer view of surface modification of PLA and PLA/EVO blends, surfaces were characterized by optical microscopy. Figures 7(a) to (d) show the optical images of neat PLA, PLA/ESBO, PLA/ESO5.5% and PLA/ESO6.5%. Neat PLA (Fig. 10(a)) displays smooth surface as compared with PLA/EVO blends while morphology of plasticized samples is heterogeneous and displays a skin-core distribution. EVO plasticizers are located below PLA skin as droplets in the polymer as it is clearly showed in Figures 7(b) to 7(d). These droplets cause the improvement of the mechanical properties.
3.5 Scanning electron microscopy analysis
Scanning electron microscopy analysis shows the surface morphology of the fractured tensile specimens and the state of dispersion of the epoxidized vegetable oils in the PLA matrix. A typical fracture surface of PLA exhibits smooth, homogeneous and a flat surface, corresponding to brittle crack growth behavior [3]. The addition of 20 wt % of epoxidized vegetable oils to PLA results in a significant change in morphology with improved adhesion and interfacial dispersion (Figures 8(b) to (d)). The incorporation of 20 w% EVO didn’t create a brittle fracture, as observed in the neat PLA. Evident signs of plasticization were observed in EVO/PLA samples. However, the presence of fibrils and microvoids was observed indicating the formation of EVO rich phase in PLA matrix by phase separation [38].
3.6 Thermogravimetric analysis
The study of plasticized polymers must take into account the impact of the plasticizer on the thermal stability. The thermal degradation of plasticized PLA was investigated by thermogravimetric analysis. Figures 9(a) and (b) illustrate, respectively, the weight loss and the weight loss derivative of PLA/EVO samples. The corresponding data are given in Table 3.
The thermal stability of a polymeric material depends on the inherent characteristics of the macromolecules as well as on the molecular interactions between the different molecules. The chain cleavage or the bond dissociation of the macromolecules takes place when the supplied thermal energy exceeds the bond dissociation energy of the respective chemical bonds [34]. It is observed that the degradation onset temperatures of PLA/ESBO (290.70°C), PLA/ESO5.5% (292.20°C) and PLA/ESO6.5% (291.20 °C) are higher than that of neat PLA (280.40 °C). Hydrogen bonding between PLA and EVO increased the thermal stability of plasticized PLA. On the other hand, the weight loss of PLA in presence of ESO5.5% (88.39 %) or ESO6.5% (88.02 %) is similar to that of PLA (86.62 %) and lower than that of PLA in presence of ESBO (90.10 %).