Overview of Transcriptome and Proteome
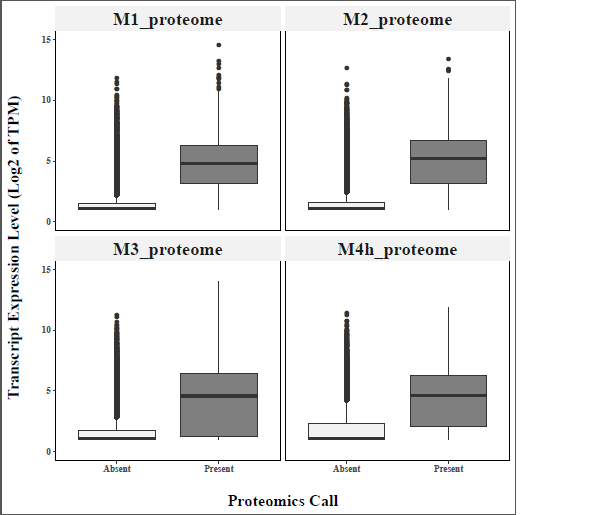
The digestive tract of adult N. viridula individuals was dissected into 4 midgut sections and the remaining carcass. Each of these tissues was sequenced with 4 biological replicates yielding a total of 1,426,685,586 Illumina short reads which were assembled into 314,260 de novo transcripts (Table 1A) that encoded a total of 73,752 unique peptides. This peptide set was used as the theoretical database to identify proteins from gel-free proteomics in each of the 4 midgut compartments, which found a total of 3,472 unique proteins among our samples (Table 1B). No differences in terms of the enrichment of membrane proteins were observed between the supernatant and pellet fractions of the proteomic analysis (Table S2). Lastly, we tested whether the presence/absence of a protein in the proteomics set was associated with its expression in the transcriptome and found that proteins identified in the proteome showed on average far higher expression values on average compared to the non-detected proteins (Figure S1). Full tables showing the expression counts reported in transcripts per kilobase million (TPM) and proteomics abundance estimates are reported in Table S3 and S4.
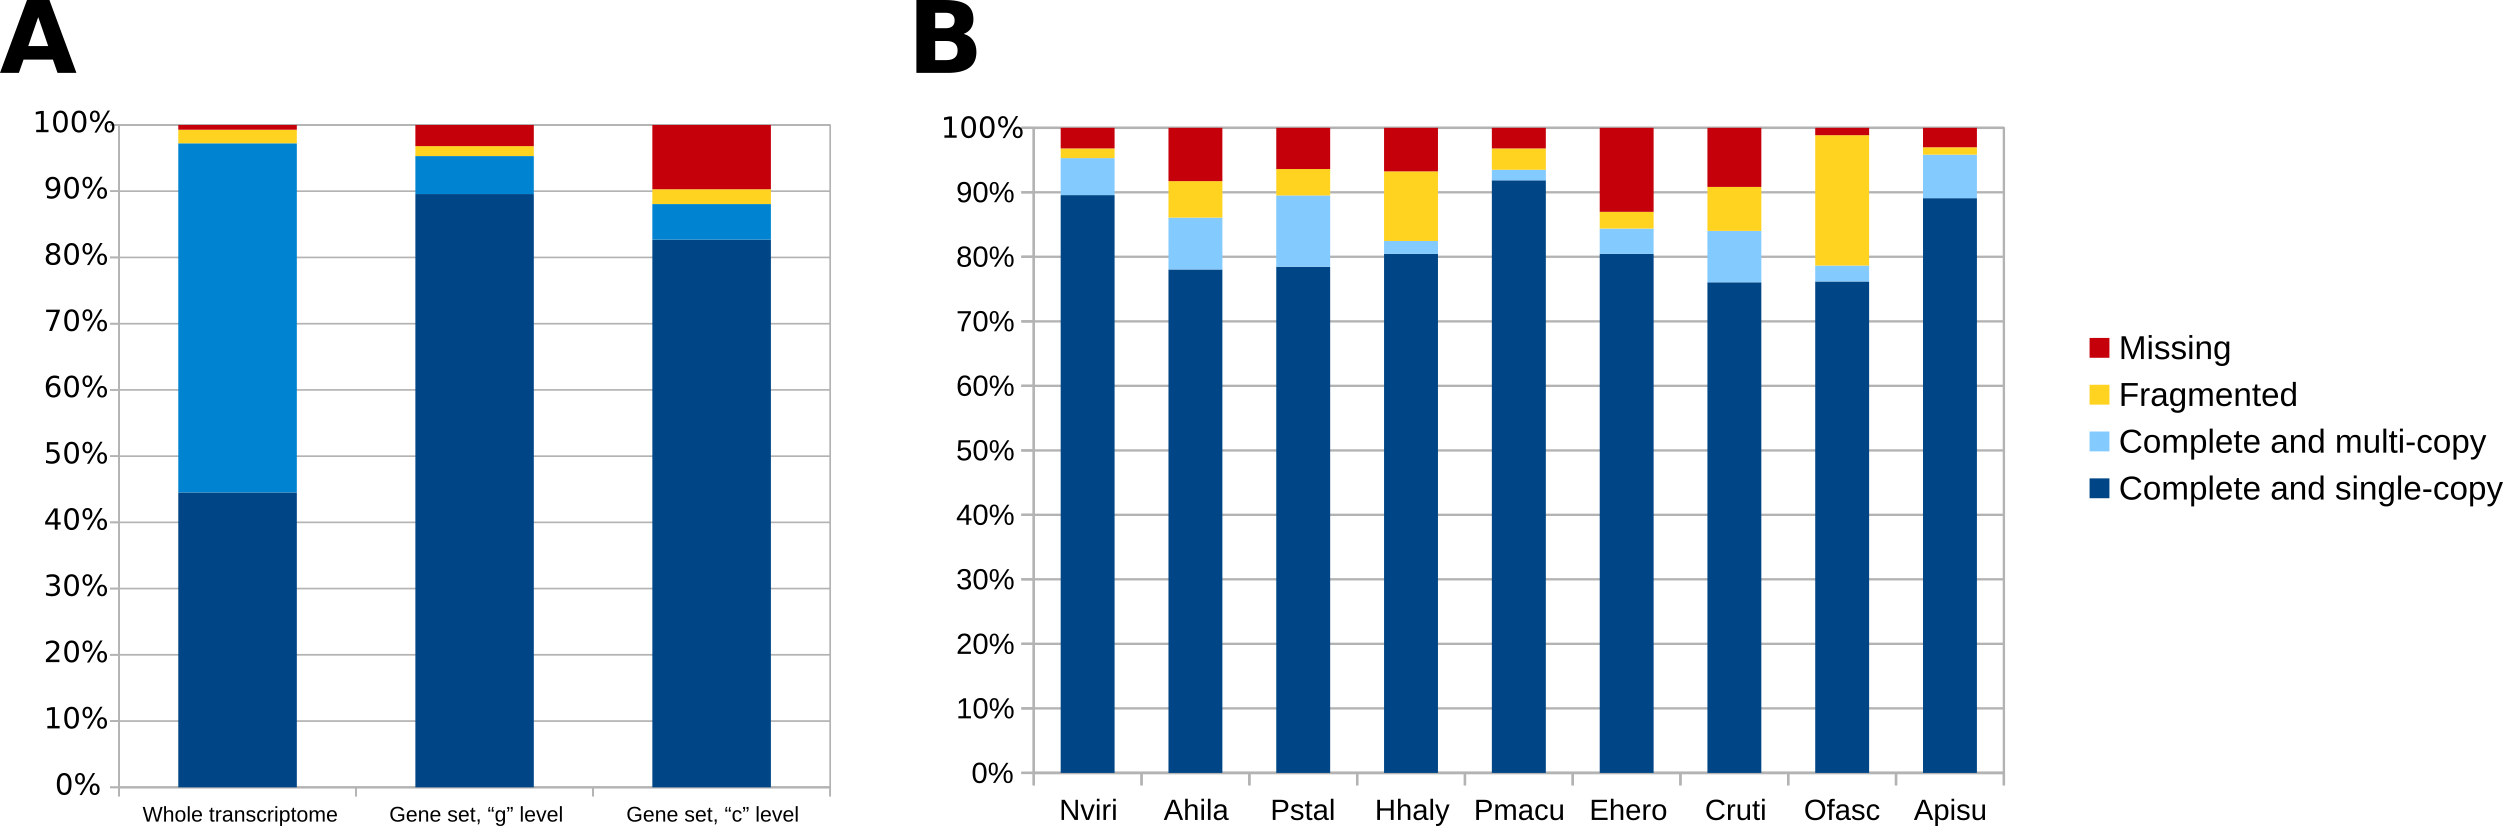
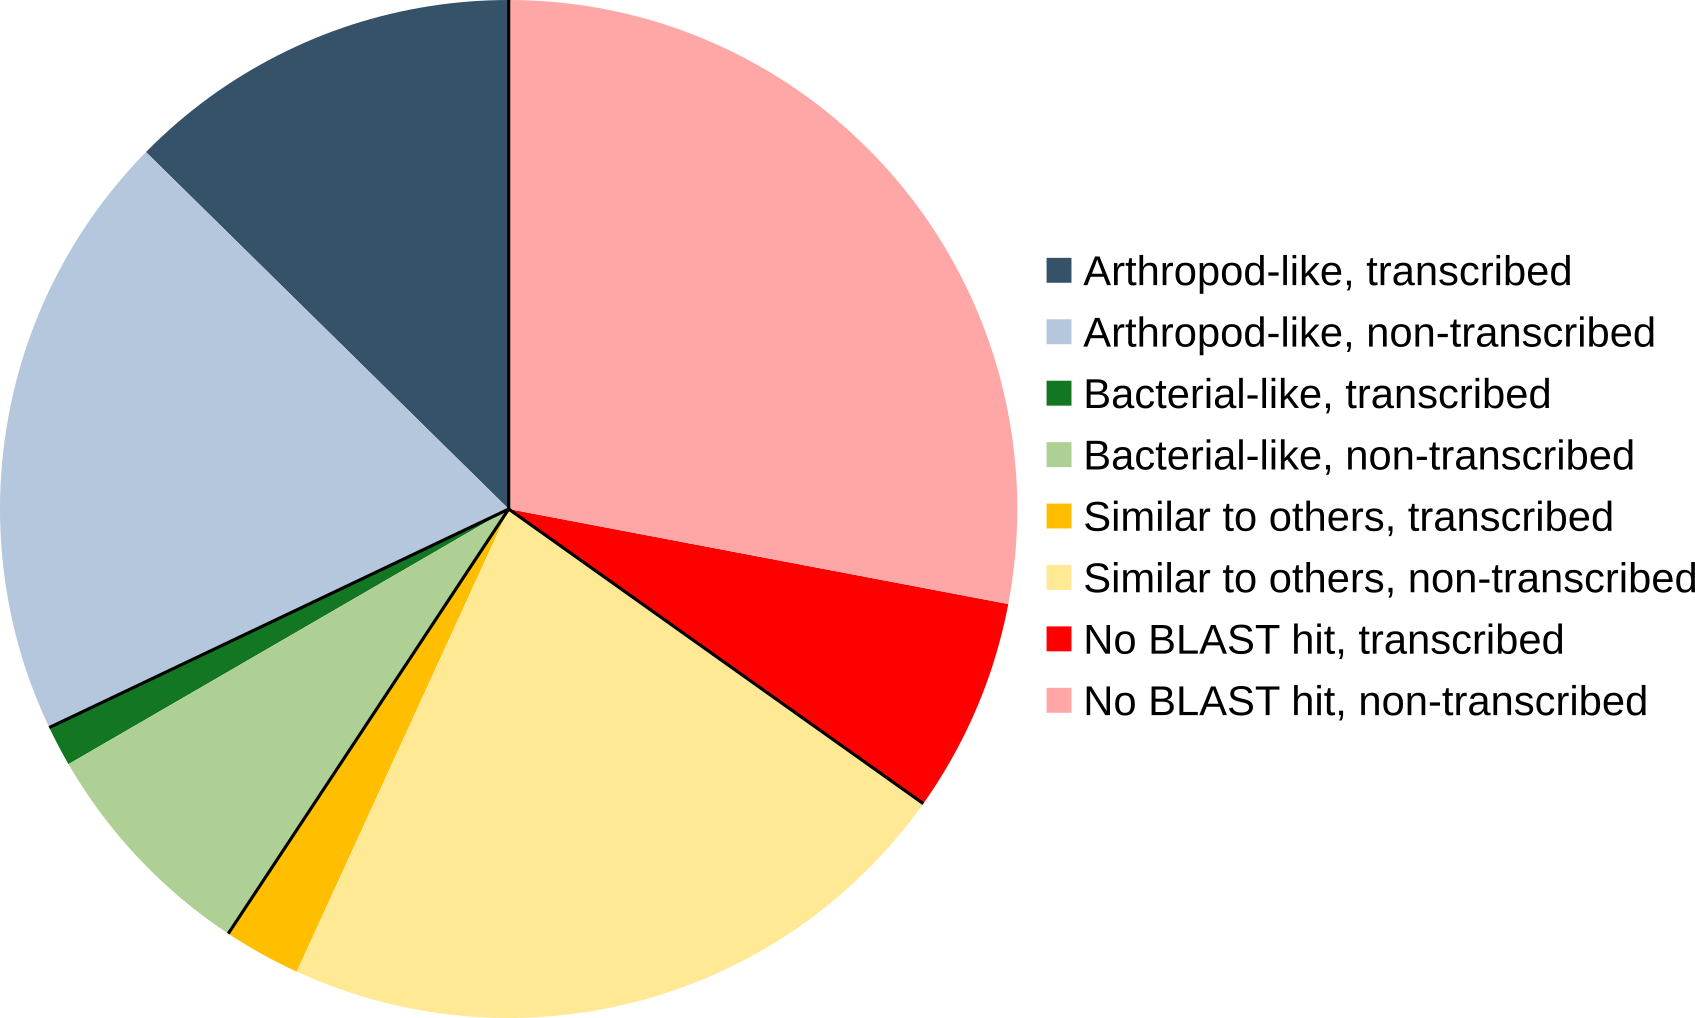
For the phylogenomic analysis, the protein set was filtered to 31,420 unigenes by grouping transcripts at the gene level, which yielded superior BUSCO scores (Figure S2). These genes were compared to other stink bug and insect protein sets using publicly available genomes and transcriptomes (Table S5) and mapped on the ortholog clusters of OrthoDB v9. All stink bugs clustered together and formed a monophyletic clade, as they all belong to the Pentatomidae family (Figure 1A).The phylogeny was complemented by a comparison of gene copy number broken down by conservation across various insect lineages (Figure 1B). Interestingly, the unigene set for N. viridula contained a large number (n=7,416) of unigenes that have no ortholog with other arthropod species. This number is elevated in N. viridula even when compared to P. stali which was analyzed using the exact same pipeline. The majority of these genes (n=4,833) has a BLAST match (e-value <1e-05) in the Uniref50 database, with almost half of them (n=2,378) being similar to an arthropod protein (Figure S3). A smaller fraction (n=641) are similar to bacterial proteins, which could originate either from the microbial symbionts associated with N. viridula [9], or from genes of bacterial ancestry that have been horizontally transferred to the stink bug, a phenomenon that has been increasingly reported for various insect orders [23, 24]. Of the 2,583 genes that do not have a BLAST match in Uniref, 507 are transcribed with a TPM value >1 in at least one midgut compartment. Taken together, these lines of evidence suggest that a large number of N. viridula proteins without an arthropod ortholog, could be playing some functional role, given their transcriptional activity.
Analysis of enriched functions in each gut compartment
In order to obtain an overview of the expression profile along the midgut, transcripts expressed >1 TPM and proteins detected with gel-free proteomics along the N. viridula midgut were compared visually with Venn diagrams (Figure 2 A,B). Despite the obvious morphological differences of these segments, the majority of transcripts (62%; n =7908) and a significant amount of proteins (37.8%, n =1313) were present in all compartments. In both analyses the M1 and M4 regions had the highest number of features detected in only one compartment. These data suggest that while most genes detected in the analysis were commonly shared among all compartments, the M1 and M4 regions were the most distinct.
A more detailed understanding of each midgut compartment was obtained by identifying groups of transcripts and analyzing them for enrichment in family membership (Pfam) or gene ontology (GO) terms. Fuzzy C-means clustering yielded eight groups of genes which displayed differing expression patterns along the midgut, referred to as fuzzyclusters1-8 (Figure 3). Four out of the eight fuzzyclusters reflected transcripts specific to a single compartment (M1=fuzzycluster7, M2=fuzzycluster5, M3=fuzzycluster8, M4=fuzzycluster6). The remaining four fuzzyclusters showed more complex patterns of expression along the gut. For example, fuzzycluster 4 showed transcripts which gradually increased in expression level from anterior to posterior (M1<M2<M3<M4). The 500 most highly expressed genes were also grouped from each compartment in order to estimate the predominant function of each section. These analysis yielded 12 groups of genes (8 fuzzyclusters and 4 Top500 groups) which would be analyzed in bulk by looking for enriched gene families and GO terms.
The M1-M3 region tended to display similar arrays of enriched protein families and GO terms with regards to both specificity and overall expression level. In all three compartments families like cysteine proteases or GO terms related to proteolysis were found significantly enriched in either the top 500 most highly expressed genes or in the compartment specific fuzzycluster corresponding to M1, M2, or M3 (Table 2; Table S6). Likewise, families associated with xenobiotic metabolism (P450s, carboxylesterases) or GO terms associated with these reactions (oxidation-reduction process) were frequently found in the the anterior sections. The M4, while also being enriched for some protease terms, displayed GO terms relating to transmembrane transporter proteins and an enrichment in proteins from the sugar porter family (PF00083; Table 2; Table S6). Of all of the other fuzzyclusters containing genes with more complex expression patterns, only fuzzycluster 4 (continually increasing expression; M1<M2<M3<M4) showed a significant enrichment in any GO term or family; the zinc finger C2H2 family were overrepresented in this fuzzycluster. From the GO term and Pfam enrichment analysis it can be inferred that the anterior portion of the midgut (M1-M3) has a predominant role in metabolism of xenobiotics and nutrients, while the posterior has a role in the transport of nutrients.
Identification and analysis of detoxification enzymes and nutrient transporters
The enrichment of P450s in the anterior region of the midgut region led us to annotate individual members of this gene family using a pipeline centered around homology searches and motif analysis. Testing our pipeline on several well-annotated proteomes, suggested that our method predicted a number of P450 genes that was close to those previously reported in the literature for other insects, although it gave slightly more conservative estimates likely due to our filtering for nearly full length P450s (Table S7). A total of 74 P450s were identified, in our N. viridula unigene protein set which contained members of the four P450 clans present in accordance with all published insect P450 sets (Figure 4; File S1; Table S8). The expression profile of these P450s was then analyzed by family to observe any compartmentalization of functions. Of particular interest was the CYP6 family, which has a known role in insecticide metabolism [18] and showed high expression across all midgut compartments in our dataset with a slight enrichment in the anterior portion of the midgut (M1-M3). Also of note were five CYP4G genes that are commonly implicated in cuticular hydrocarbon biosynthesis [25]. Four out of 5 of these genes in N. viridula showed high levels of expression only in the carcass sample (Table S8). Averaging the expression of all P450s, there was roughly twice the expression in the anterior portions of the midgut compared to the posterior section.
The enrichment of transporter proteins in the M4 region of the midgut was expanded further by identifying individual members of several families of sugar and amino acid transporters using an in house pipeline (see Materials and Methods). Sugar transporters belonging to the SP, SSS, and SWEET families were identified and analyzed for their expression pattern along the midgut (File S2; Table S9). The 11 SSS transporters that were identified, were expressed at very low levels in all midgut compartments. Only two SWEET transporters were detected, one of which showed high expression and 2-4 fold enrichment in all midgut compartments compared to the carcass. However, by far the largest group of sugar transporters was the SP family with 91 detected transporters. This group was incredibly diverse in its expression pattern; different SPs showed specificity or enrichment in different midgut compartments. However, in accordance with the Pfam enrichment of sugar transporters in the M4 region (Table 3), the highest total expression and the largest number of highly expressed genes (>50 TPM) were found in the M4 region of the midgut (Table 3).
Amino acid transporters belonging to the families NSS, APC, POT, and AAAP families were all represented by at least four members in N. viridula (File S2; Table S9). The ten NSS family members generally showed low expression, and only one NSS showed expression values of >10 TPM. The five POT family members showed a similar low expression apart from DN111091_c2_g2, which showed very high (>200 TPM) expression in the M2 and M3 regions of the midgut. The APC and AAAP families were larger, with 22 and 15 members respectively. Furthermore, transporters in these families tended to concentrate in the M4 region of the midgut. The number of transcripts from both APC and AAAP showing very high (>50 TPM) expression was elevated in the M4 tissue (Table 3) and the expression of this family in the M4 was higher than the average anterior midgut expression (Figure 5).