3.1 lncRNAs expression levels altered in GC
The summary of 13 studies reporting changes in lncRNA expression in GC tumor genesis and development is presented in Table 1. Different types of samples were used: Zhang et al. compared lncRNA between GC and non-GC patients using tissue and plasma [18]; gastric mucosae were used in one study [19]; all other studies analyzed GC cancer tissue and adjacent healthy tissue. Among all identified studies, differences in lncRNAs expression levels were detected for at least 75 lncRNAs [18]. Because of the re-annotation of the published microarray database, two studies did not provide fold changes of dysregulated lncRNAs [18, 20, 21]. A study from Hu et al. used a 1.5-fold change for selection criteria [22], while 2 fold change was used for other studies [18, 23-30]. The median age of GC patients enrolled in the analysis was at least 57.8 years, except one study [29] that did not have detailed information. Gender distribution and histopathological information of GC patients are shown in Table 1.
In summary, the analysis of identified microarray data showed substantial lncRNAs alteration in GC patients. However, data reported by different research groups were extremely variable. Thus, we concentrated on the potential of lncRNAs for GC diagnosis.
3.2 Meta-analysis of differentially expressed lncRNAs in GC patients.
To further investigate the diagnostic value of lncRNAs in GC, all articles exploring lncRNAs as a novel biomarker for GC patients were collected using the search strategy indicated in the flowchart in Fig. 1. Twenty-three studies were included and pooled into meta-analysis.
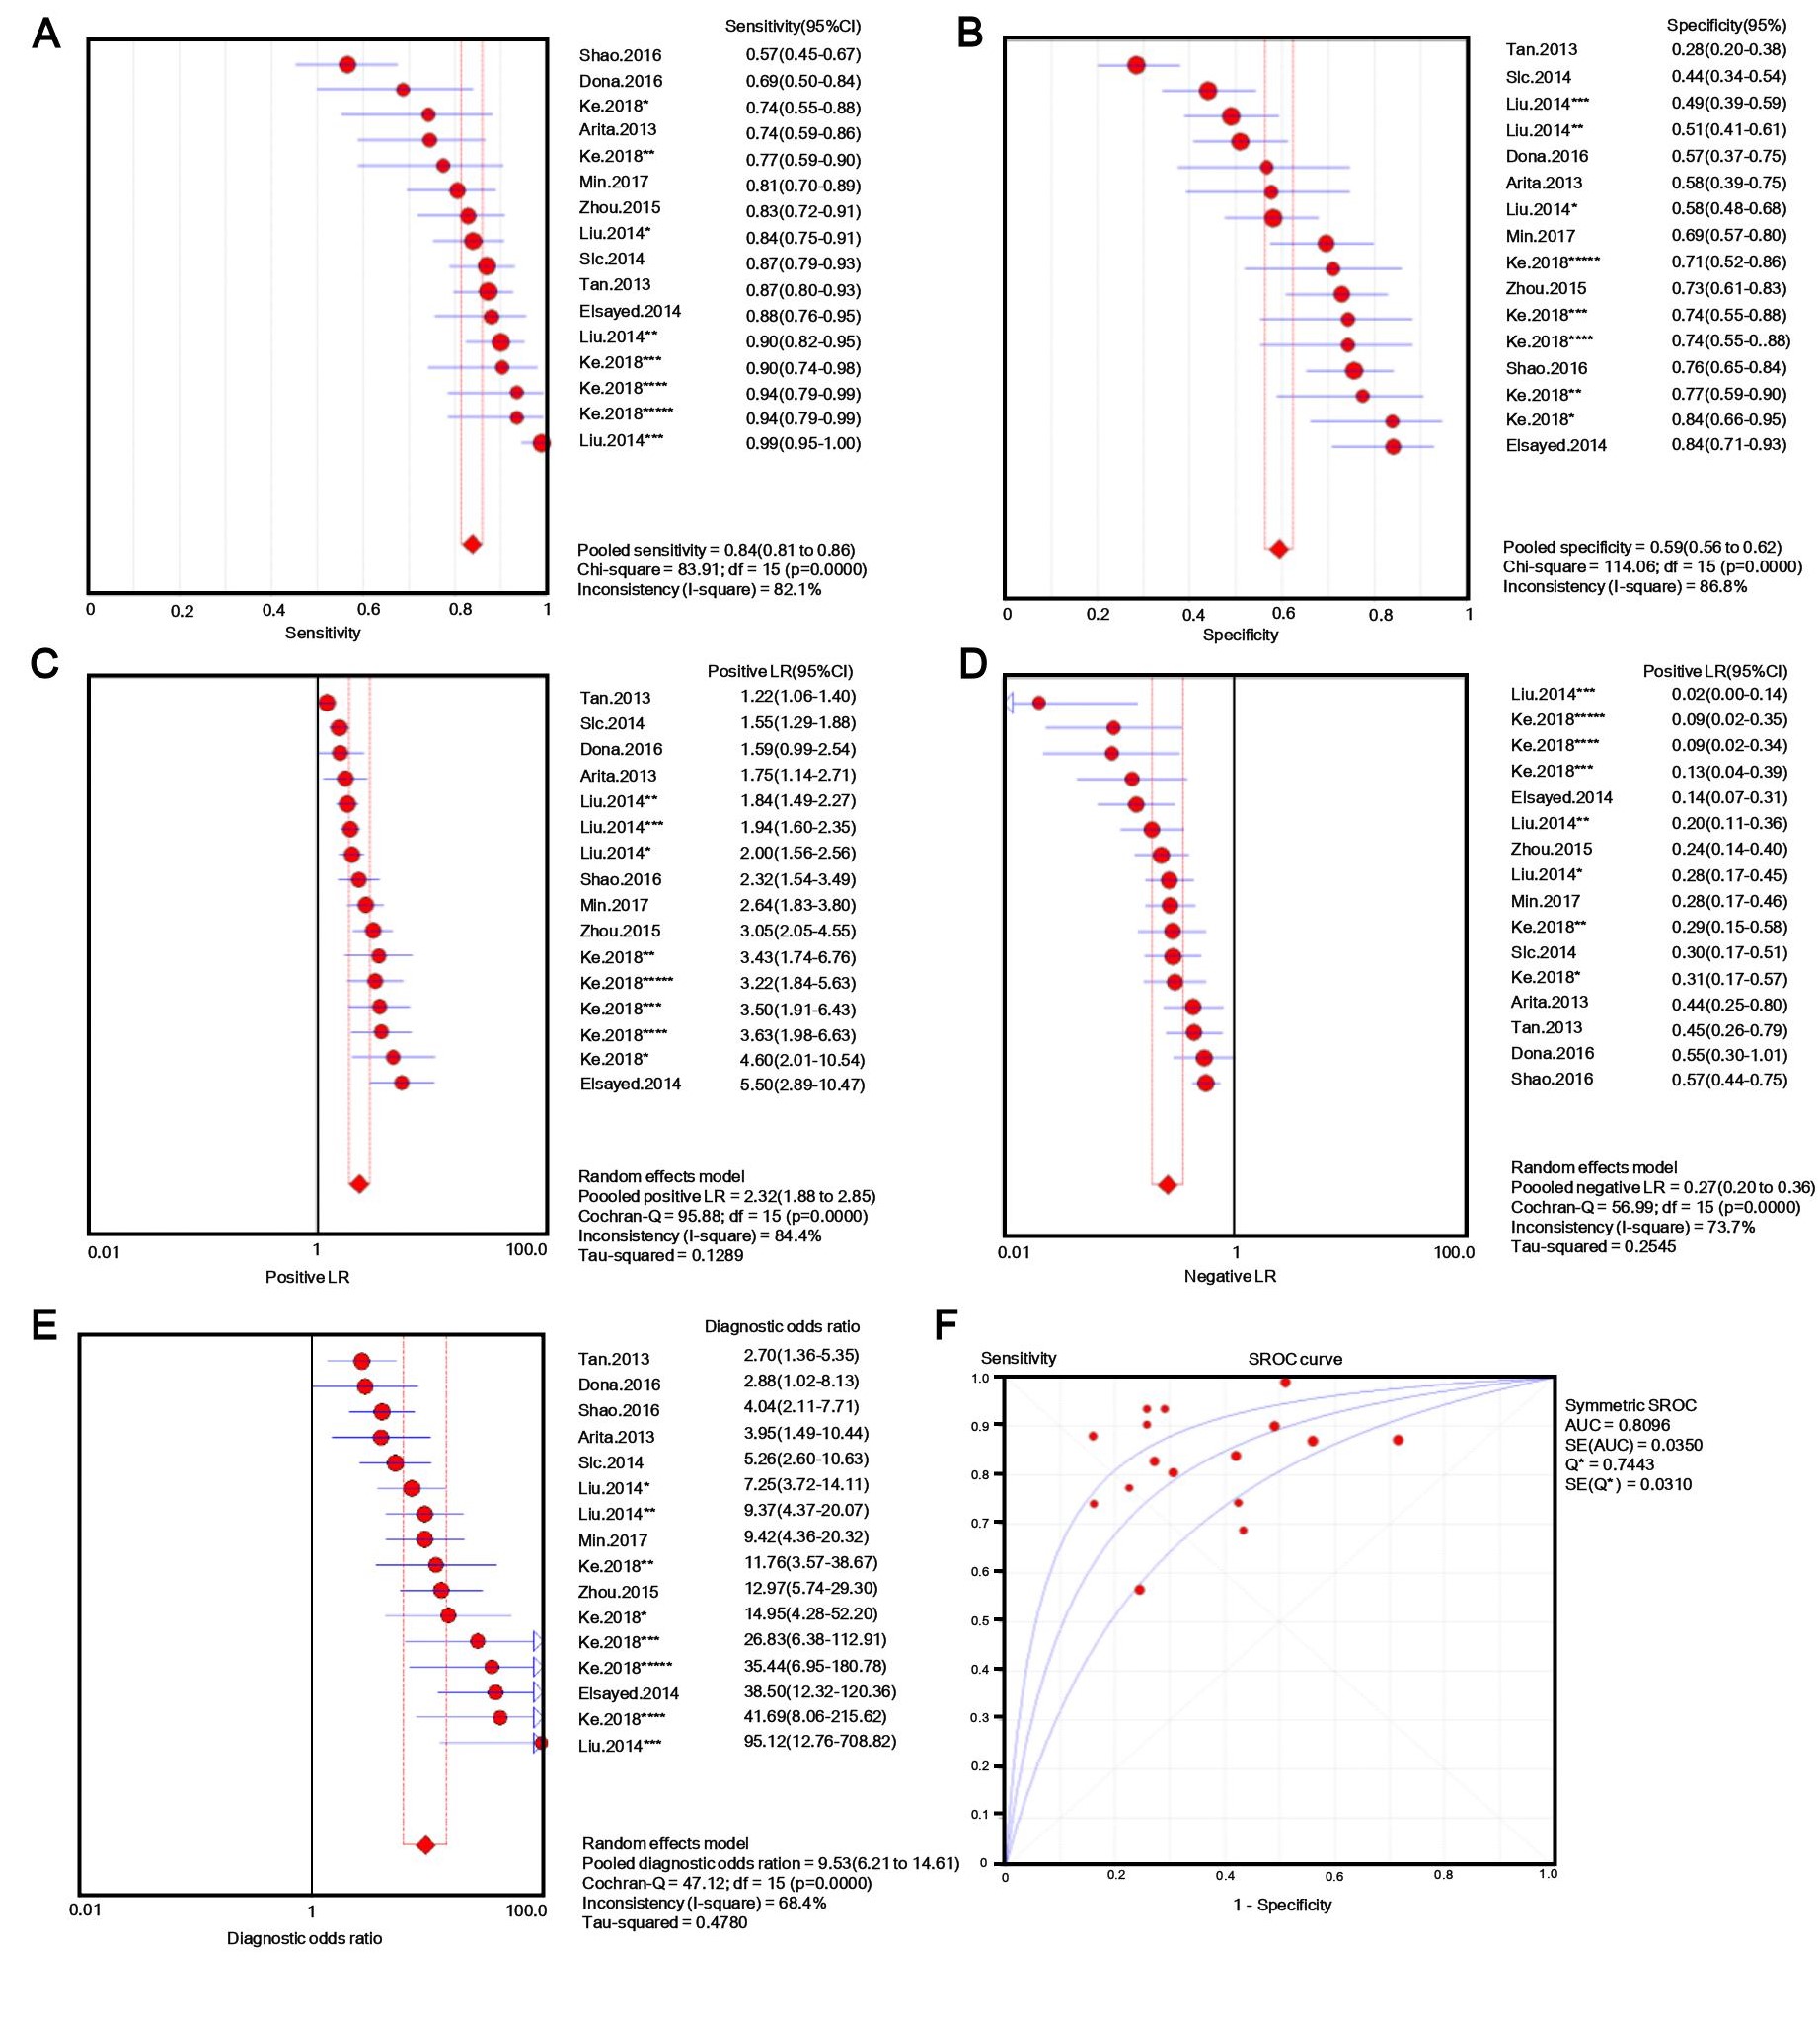
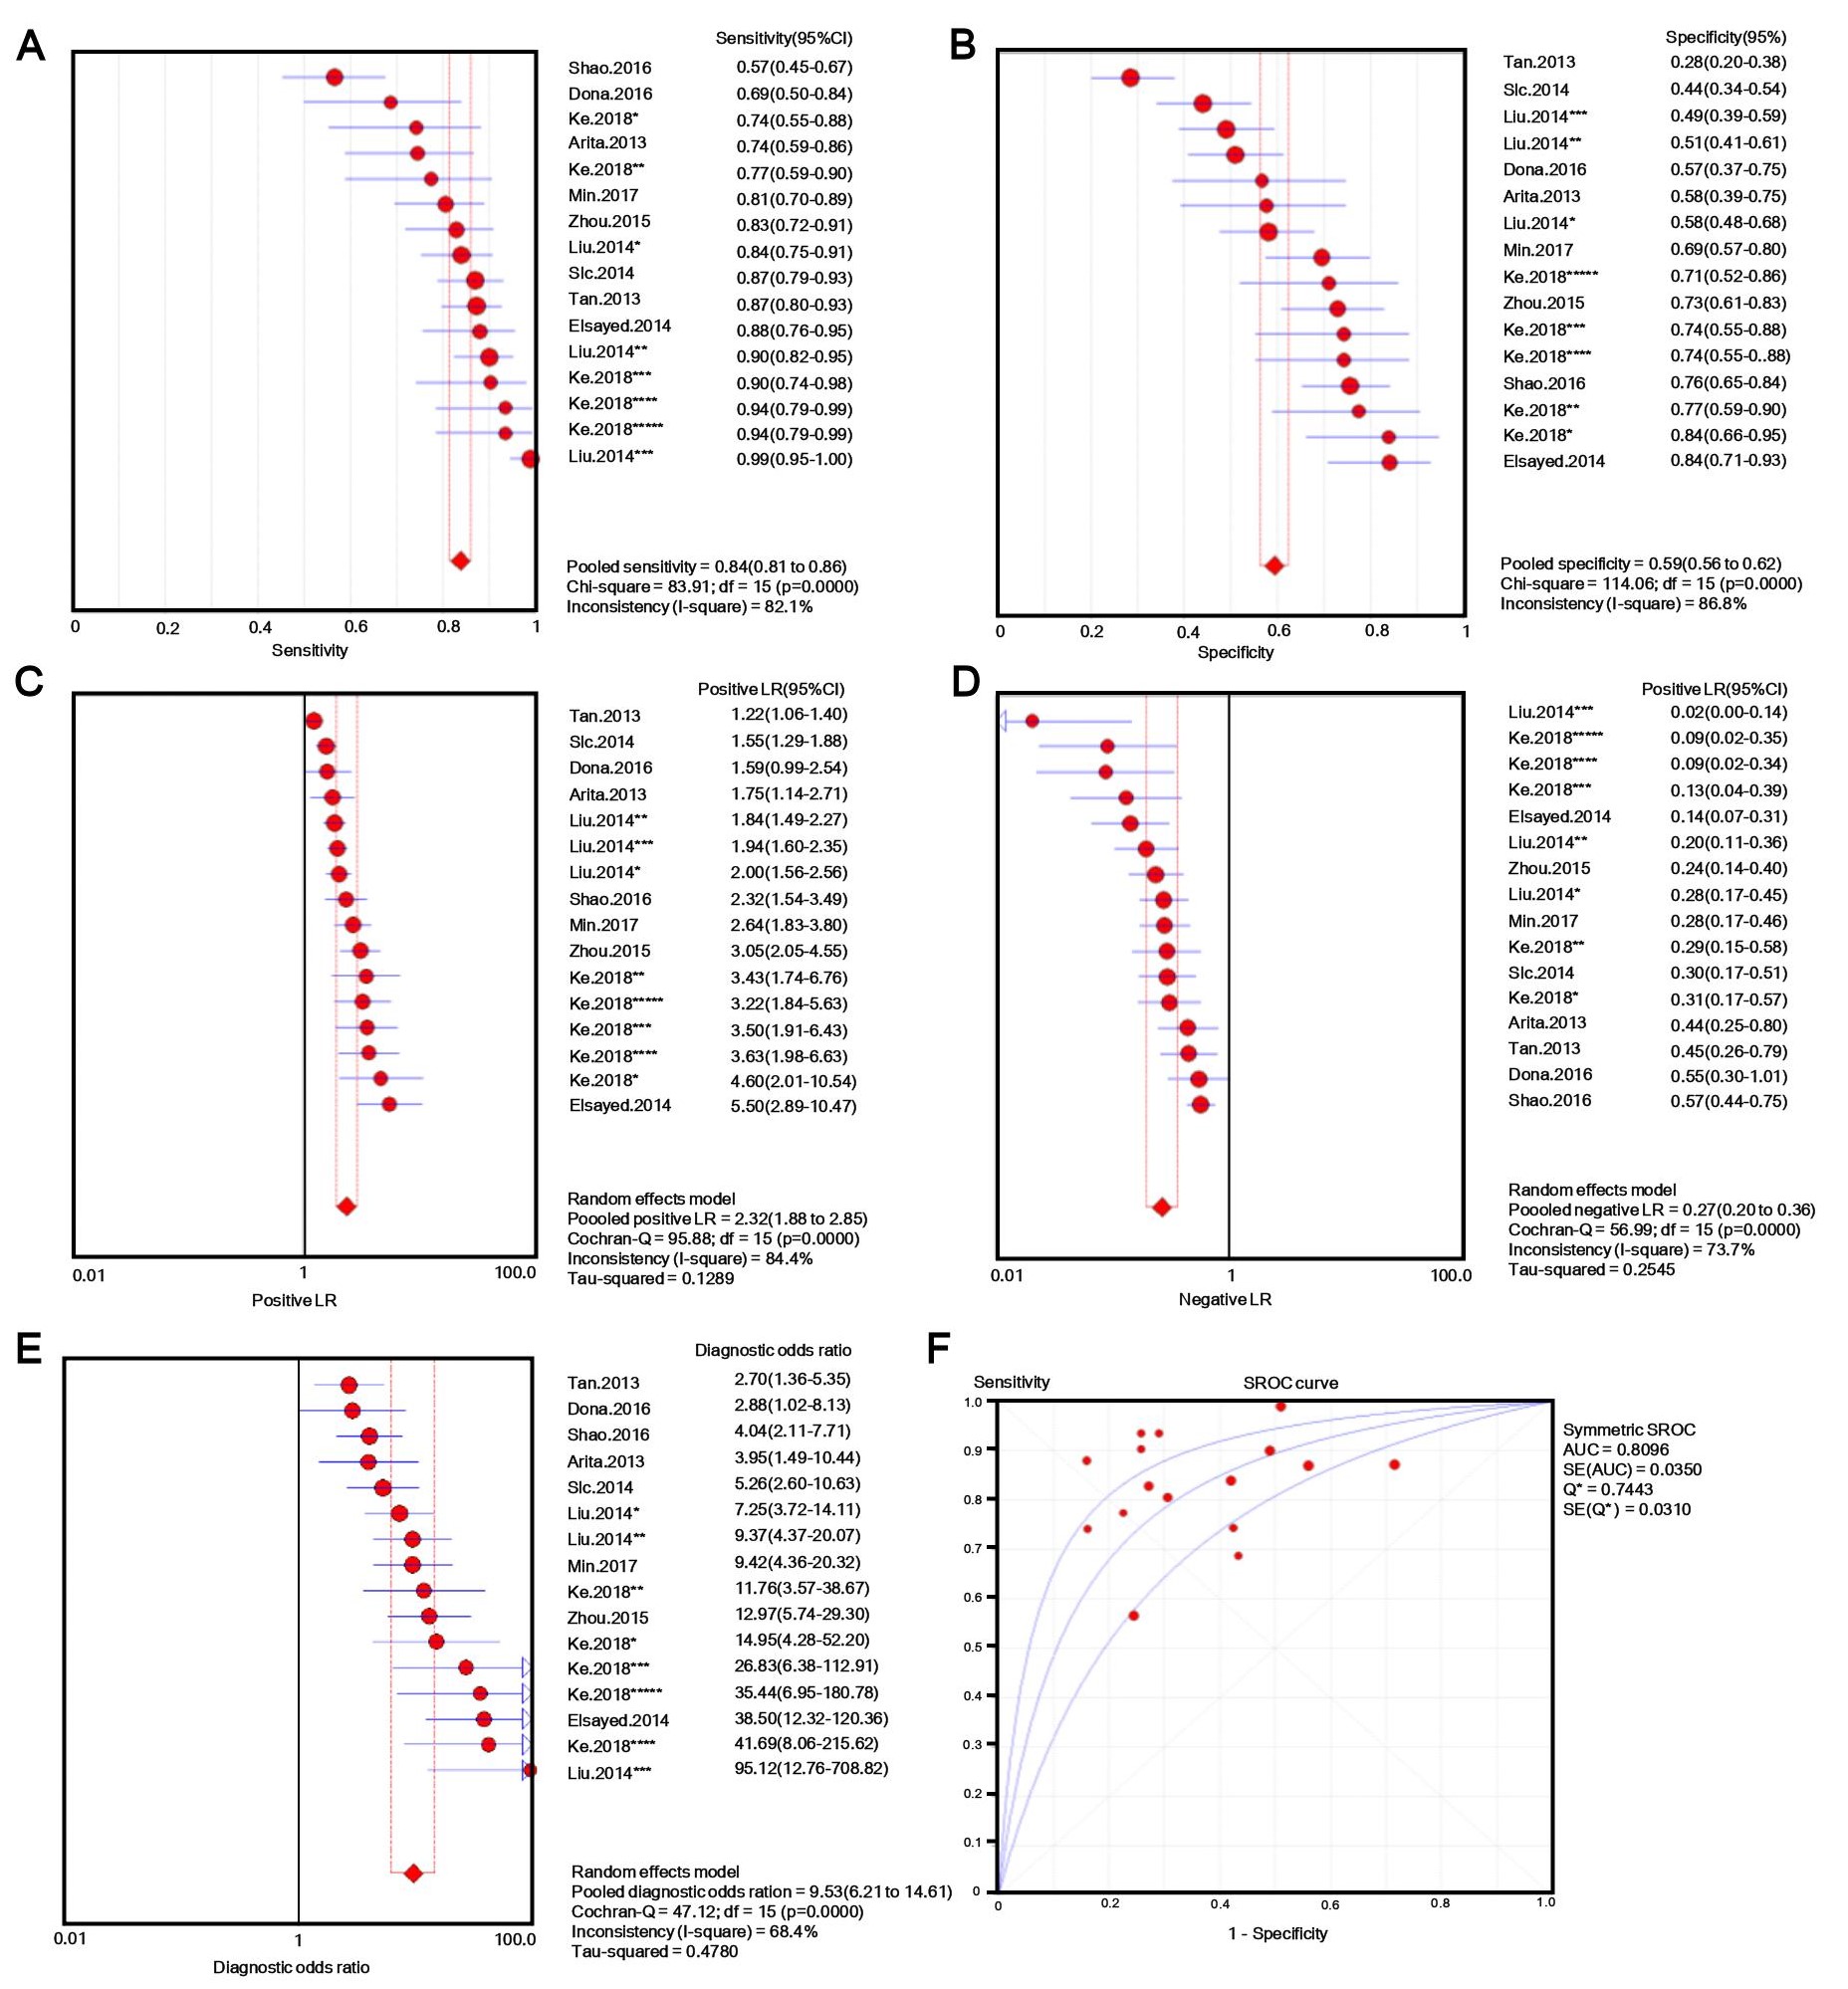
The number of patients in each study ranged from 30 to 132, and tissue, plasma, serum, or gastric juice samples were used. Besides b-actin or GAPDH, U6 [31, 32] and 18s RNAs [33] were used as endogenous standards for diagnostic evaluation. Quantitative methods and cut-off values were also different in different studies, and both individual lncRNAs and panels [33, 34] were selected as novel diagnostic biomarkers for GC. Additionally, classic GC biomarkers (e.g. CEA and CA19-9) were compared with novel GC biomarkers [34], and the lncRNA panel showed markedly higher AUC value for discriminating GC patients from controls. Considering this evidence, we performed a meta-analysis with meta-disc software version 1.4. We pooled data from various specimens and generated forest plots shown in Fig. 2. The pooled sensitivity was 0.76 (95% CI: 0.74-0.77; Q =195.59, p =0.0000, I2% = 85.2%) and the specificity was 0.66 (95% CI: 0.64-0.68; Q =208.98, p =0.0000, I2% =86.1%), which indicated a presence of substantial heterogeneity. Then a random-effects model was used to re-analyze the diagnostic threshold of pooled data. The Spearman correlation coefficient was 0.238 (p =0.214, data not shown), suggesting no evidence of a diagnostic threshold. Afterward, forest plots of DOR were generated, which revealed that substantial heterogeneity was still present. This might result from the discrepancy of the studied populations, endogenous references, or specimen types. Meta-regression analysis on the possible factors indicated that specimen type was probably the reason for heterogeneity. Thus, the results (e.g. sensitivity) extracted from identified studies could not be simply pooled and were only suitable for subgroup analyses. Filtering studies based on specimen type reduced heterogeneity, however, it was still higher than acceptable levels. On the sROC curve of plasma samples, which included 16 LncRNAs, the maximum joint sensitivity and specificity (Q value) was 0.7443, and the area under the curve was 0.8096, indicating a moderate level of overall accuracy. The combined sensitivity, specificity, LR+, LR- and DOR in plasma were 0.84 (95% CI: 0.81-0.86; I2% =82.1%), 0.50 (95% CI: 0.56-0.62; I2% =86.8%), 2.32 (95% CI: 1.88-2.85; I2% =84.4%), 0.27 (95% CI: 0.20-0.36; I2% =73.7%), and 9.53 (95% CI: 6.21-14.61; I2% =68.4%), respectively (shown in Fig. S1). Thus, the results indicated that a pooled study was not appropriate. In the other 14 studies that used tissues as specimens the pooled sensitivity, specificity, LR+, LR-, and DOR were 0.69 (95% CI: 0.66-0.71; I2% =68.1%), 0.72 (95% CI: 0.69-0.74; I2% =76.9%), 2.50 (95% CI: 2.11-2.96; I2% =63.5%), 0.44 (95% CI: 0.38-0.50; I2% =52.2%), and 6.08 (95% CI: 4.65-7.96; I2% =51.8%), respectively (shown in Fig. S2). The data showed a lower pooled sensitivity for tissue.
3.3 Validation of lncRNAs expression by GEPIA
Since heterogeneity was not reduced to an acceptable level through subgroup analysis, we used GEPIA[35] analysis, a web-based tool to deliver fast and customizable functionalities based on TCGA [36]and GTEx data[37], to validate the expression of those lncRNAs between primary GC tissues and normal gastric tissues . We observed increased expression of six lncRNAS(ABHD11-AS1, H19, PVT1, UCA, HOTTIP, and SUMO1), and two lncRNAs (FER1L4 and LINC00982) decreased in GC tissues compared to normal stomach tissue . The specific data related to expression of those lncRNAs recorded by dataset is shown in Fig. 3.
3.4 Identification of DEGs in GCs and investigation of correlation to modulated lncRNAs by IPA
To investigate the underlying mechanism related to lncRNAs, we extracted 3944, 629 and 1406 DEGs from GSE54129, GSE19826[38] and GSE79973[39] via GEO2R online tools, respectively. The gastric samples used for those arrays were collected during surgery. Healthy gastric mucosa (GSE54129) or adjacent normal gastric tissue (GSE19826, GSE79973) was used as control. . Subsequently, Venn diagram software [40] was used to identify common DEGs in these datasets. A total of 226 common DEGs were identified, including 142 up-regulated genes (p< 0.05 & log2FC> 2) and 84 down-regulated genes (p< 0.05 & |log2FC| > 2) in the GC tissues (Fig. 4). Meanwhile, IPA analysis identified molecules that interacted with the altered lncRNAs in gastrointestinal diseases (Table 2). Then we pooled these molecules and DEGs in GC into the Venn diagram and identified two genes (IGF2BP3 and FOLR1), which probably interacted with altered lncRNAs in GC.
3.5 Validation of genes interacted with lncRNAs in GC
To investigate the potential role of these genes in GC, we further validated the expression of IGF2BP3 and FOLR1. GEPIA website [35] and Kaplan Meier plotter (http://kmplot.com/analysis), a website established on TCGA [36]and GTEx data[37] were used to recognise the correlation between the expression of those genes and the prognosis of GC patients. We found a dramatically increased expression of IGF2BP3 and significantly reduced expression of FOLR1 in GC patients compared to healthy controls, the altered expression of these two genes was reported to be correlated with poor overall survival time of GC patients, especially the altered expression of FOLR1 (P<0.01, shown in Fig. 5).