The study was conducted using the Institute for Health Metrics and Evaluation (IHME) openly published data on Covid-19 infections by sovereign country, to include daily infections/deaths as well as onset and discontinuation dates of state mandated social interaction interventions. As this was the primary source of information used for predictive modeling and setting public policy, it was chosen for its accuracy and regular updates.6
The primary goal was to quantify the decrease in the infection/mortality or decrease in the maximum infection/mortality rate as a result of defined state mandated social distancing measures. Mortality was chosen to define endpoint peaks and rates of change over registered infections within a state. Covid-19 registered infections are beset by inaccuracies due to: Inaccurate testing, asymptomatic patients, test availability, and regional variations in testing criterial. In most developed countries, the cause and time of death is typically consistently and accurately recorded.
IHME data accessed on April 12, 2020 at 1900 EST was used to preliminarily select more than 10 sovereign states which fit into a geographic area of similar genomic constituency and indicated by WHO to have developed healthcare standards.7 Each of the selected countries was an independent state which nationally instituted preventive social interaction law on a given date to include one of the four (4) possible mandates:
- Public School Closures
- Closure of non-essential businesses
- Severe travel restrictions
- Stay at home order
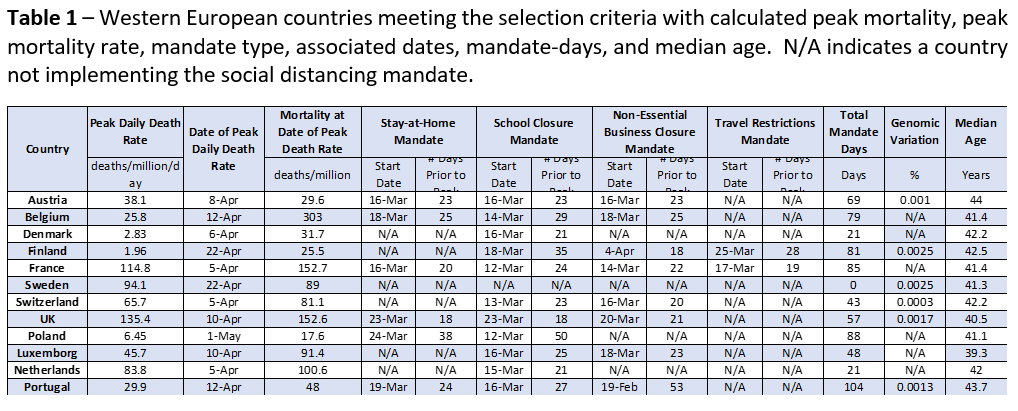
Countries which did not meet all of these criteria in the IHME data set were excluded from the analysis. Also, countries which did not maintain their state-wide mandated social distancing through the end of the examination period (May 1, 2020) were excluded. Twelve western European countries were included as listed in Table 1. These countries were in close geographically proximity, have a similar genomic alleles, have established and recognized healthcare systems, and have similar social behaviors.8,9,10 All states mandated social distancing universally across their respective country of the 4 variations listed above on a specific date provided by the IHME data set accessed on April 12, 2020 and maintained them through their peak infection rate.
Defined endpoints for the analysis included the date of the initial peak mortality in deaths per day. A state’s peak mortality was defined as the highest recorded daily deaths over a seven day moving average which was followed by a seven or more day decline in mortality with no other discernable peaks using these criteria. The dates of maximum mortality for all 12 countries were identifiable by the design criteria on the IHME data set accessed on May 1, 2020 at 2030 EST. (Table 1).7 The IHME data set was re-examined on May 15, 2020 to insure no secondary mortality rate peaks were noted and the rate was in a continued decline.7 The maximum daily mortality rate or peak infection rate was used an easily defined and universal endpoint in any infectious disease progression to examine the total viral mortality up to the maximum mortality rate.
Additionally, the maximum slope of the Covid-19 mortality was determined by evaluating the maximum of the derivative of the infection curve. Specifically, this slope was defined as the total recorded mortality five days after the maximum daily mortality rate minus the total recorded mortality five days before the maximum daily mortality rate divided by the 10 day interval. Both the total mortality and maximum mortality rate were normalized by dividing by the population of the selected state.
Equation 1 – Formula on how the estimate for the maximum mortality rate was calculated from the Covid-19 mortality data from IHME.

All data was analyzed with Matlab14 and Microsoft Excel software to determine correlation coefficients and probabilities. General linear mixed effects (GLME) was used to examine combined effects of the multiple variables.
The study was conducted within the ethical principles contained in Declaration of Helsinki, Code of Federal Regulations (CRF), Obligations of Clinical Investigators (21 CFR 812). All data was public and anonymous so no IRB was needed.
We conducted two high-level bivariate studies of this data: the first being the peak daily death rate (same as maximum mortality rate) against the total mandate days, and the second being the mortality on the peak date against the total mandate days. Each mandate, if implemented, was implemented some number of days before the peak. The total mandate days is the simple summation of these number of days from all four social mandate categories. For example, Belgium implemented stay-at-home orders 25 days prior to it peaks, school-closures 29 days prior to its peak, non-essential business closures 25 days prior to its peak, and did not implement travel restrictions, resulting in 79 total mandate days.
Equation 2 – Formula on how the Total Mandate Days are calculated from individual mandates and the number of days prior to the peak daily death rate that the mandates were implemented.

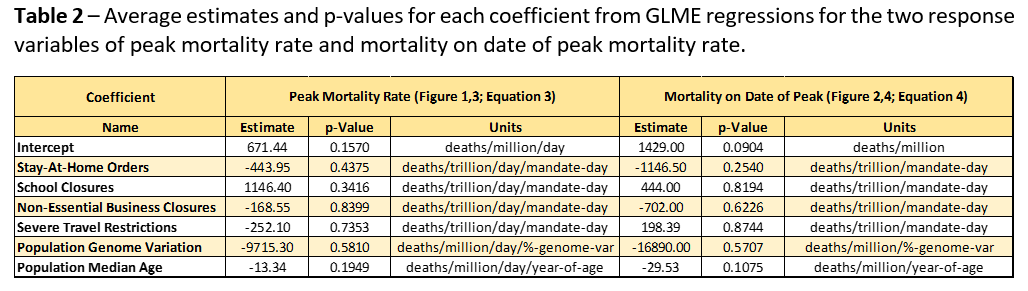
Then, we conducted two multi-variate studies of this data. The multivariate studies use the same response variables as in the univariate data: peak mortality rate and mortality at peak. The multivariate studies will then consider the effects of each mandate independently as well as incorporate genomic variation and median age in each country’s population.
Equation 3 – Peak mortality rate model studied in the multivariate analysis.

Equation 4 – Mortality at peak model studied in the multivariate analysis.

These models were then regressed onto the IHME data.