Ethics approval and consent to participate
Studies were performed following the ethical principles according to the Helsinki Declaration of 1975 and as revised in 2013. The IRCCS Policlinico San Donato (PSD) experimental protocol was approved by the Institutional Ethics Committee of the San Raffaele Hospital (protocol number 75/INT/2020, 20/04/2020). The IRCCS MultiMedica (MM) experimental protocol was approved by the institutional review board ethics committees (protocol number 497.2021). All the patients enrolled in these studies were asked for their informed consent as previously approved by the ethics committee of each center.
Patient enrollment
Patients were all positive for SARS-CoV-2 by qPCR assay and hospitalized either at PSD (Table 1, S1 and S2) or at MM (Table S6). Anagraphic and clinical data were collected at hospital admission and patients were categorized according to the most severe COVID-19 grade observed during hospitalization as: (1) patients not requiring oxygen therapy, (2) patients requiring oxygen therapy, (3) patients requiring continuous positive airway pressure (CPAP) therapy and (4) patients admitted to intensive care unit and intubated (ICU) (Table 1, S1, S2 and S5).
The study conducted at PSD included 111 hospitalized patients aged 18 years or older, recruited during the period from March 2020 to January 2021, corresponding to the first and second COVID-19 waves, and 15 healthy controls (65.0 ± 3.8 years old, range 53.0-67.0 years, 1 female and 14 males). Peripheral Blood Mononuclear Cells (PBMCs) and platelet-poor plasma samples from patients recruited at PSD were isolated by PSD BioCor Biobank at admission according to internal Standard Operating Procedures.
The study conducted at MM included 60 patients hospitalized for COVID-19 and consecutively enrolled from March to May 2021, corresponding to the third COVID-19 wave. PBMCs were isolated from the peripheral blood using the same Standard Operating Procedures used at PSD.
PBMC and plasma sample collection and RNA isolation
PBMC were isolated from 6 ml of peripheral blood in ethylenediaminetetraacetic acid dipotassium salt dihydrate (K2-EDTA) anticoagulant tubes by density gradient centrifugation at 1,200xg for 10 min at room temperature with brake using Ficoll Histopaque Plus (Millipore Sigma, US) and SepMate-15 tube (STEMCELL Technologies, Canada). Isolation of total RNA from PBMCs was performed using TRIzol RNA Isolation Reagent (Thermo Fisher Scientific Inc., US) and RNA concentration and purity were evaluated by NanoDrop One (Thermo Fisher Scientific Inc., US). Platelet-poor plasma was collected in K2-EDTA-anticoagulant tubes and isolated as previously reported [19]. Briefly, cell- and platelet-free plasma was prepared following a 2 step centrifugation protocol: samples were initially centrifuged at 1.500g for 15’ at 4°C. The supernatant was collected and centrifuged again at 14.000g for 15’ at 4°C and plasma aliquots were stored at –80°C. RNA was isolated using NucleoSpin miRNA Plasma (Macherey-Nagel, Germany) according to the manufacturer’s instructions.
RNA sequencing and data analysis
Library preparation
The Kapa biosystems’ KAPA Stranded RNA-Seq Kit with RiboErase (HMR) (Roche Diagnostics Corporation, US) was used to convert 500 ng of total RNA into a library of template molecules of known strand origin. The rRNA cytoplasmic component was removed by ribosomal depletion. Ribodepleted RNA was cleaned up using the Agencourt AMPure XP beads (Beckman Coulter, Life Sciences, US) and DNAse digestion was performed. After these steps, the first and the second strands of cDNA were synthesized and an A-tailing reaction was performed for Illumina adapters ligation. DNA fragments were enriched by PCR and quality was checked on the Agilent Technologies 2100 Bioanalyzer (Agilent, US) using a DNA 1000 chip according to the manufacturer’s recommendations.
FIMICS capture and sequencing
LncRNA quantification in PBMC samples was performed by using the FIMICS panel 2.0 which employs more than 55,000 probes of 120 nucleotides interrogating 2,906 lncRNAs [16]. This panel uses Celemics (Seoul, Korea) beads-based hybridization capture technology. In particular, biotinylated target capture probes were hybridized to the libraries at 65 °C for 24 hours, then, captured lncRNA sequences were purified on T1 streptavidin-coated magnetic beads, and captured sequences were enriched by PCR (14 cycles). After PCR products purification with Beckman Coulter™ Agencourt AMPure XP beads, the prepared libraries were sequenced by Illumina NextSeq 500 according to the manufacturer’s recommendation and a 100bp paired-ends reads (2x100bp) were generated.
Read mapping and quantification
Data were imported in the Partek Flow (flow version) 10.0.21.1015. The raw FASTQ files were trimmed at the 3’ end in function of their quality score (Phred score). The raw reads were aligned to the Homo sapiens hg19 reference genome using the software STAR v 2.7.3a and default parameters were used. Then, mapped reads were quantified against the annotation with all lncRNAs from FIMICS panel with the Partek Expectation/Maximization (E/M) algorithm. Differential expression analysis was performed using the Limma R package [20] with quantile normalization. 2 CPM in at least half of the samples was used as the detection threshold.
Analysis of single-cell transcriptomics datasets
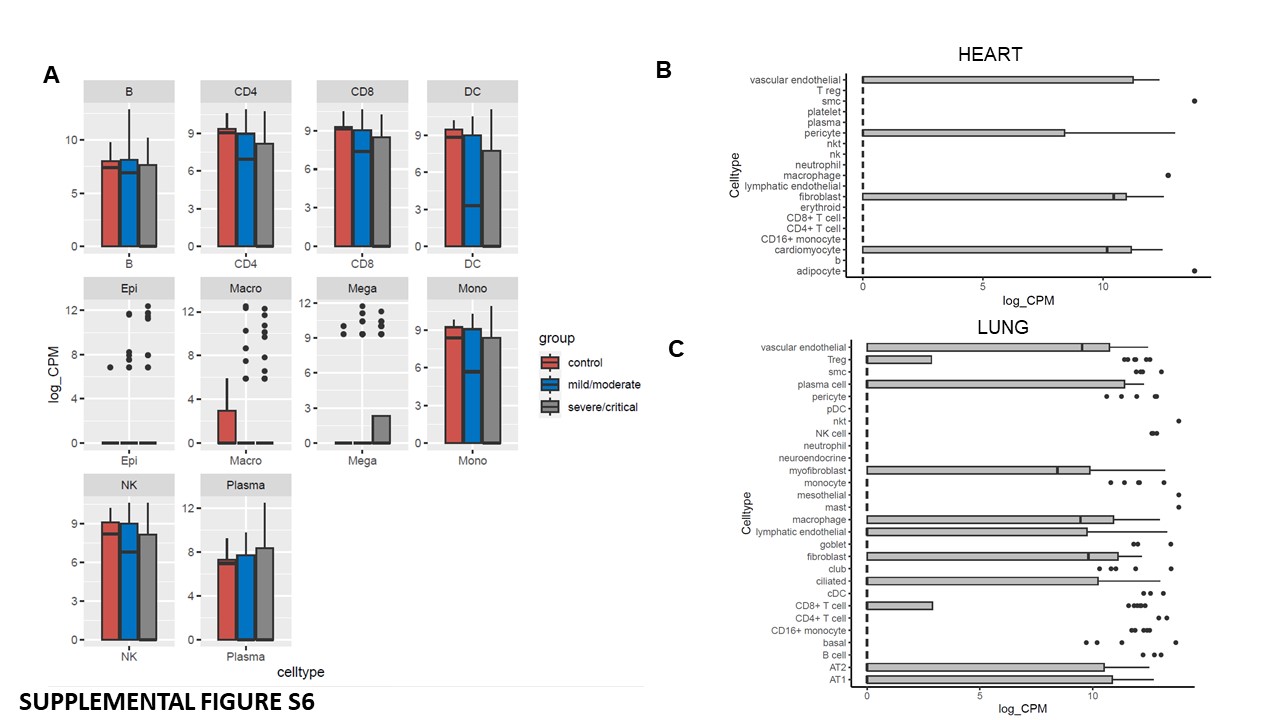
Count matrixes and annotations were downloaded from the data resource of the studies describing single-cell RNA-sequencing from the blood[21], as well as heart and lung [22] of COVID-19 infected patients. The count matrix was processed using Seurat R package. We combined the counts from the cells belonging to respective cell types (pseudo bulk). The pseudo counts per cell type per donor were further normalized into counts per million (CPM) values by edgeR R package, and then the expression values were extracted.
RT-qPCR
RNA was retro-transcribed using the GoScript Reverse Transcription kit (Promega Corporation, US) using 200 ng of total RNA according to the manufacturer’s instructions. cDNAs were analyzed using the GoTaq qPCR Master Mix (Promega Corporation, US) according to the manufacturer’s instructions on a StepOne Plus instrument (Thermo Fisher Scientific Inc., US). Sequences of the adopted primers are reported in Supplemental data, Table S3. After normalization for UBC expression levels (PBMC) or 18S (plasma), relative RNA expression was calculated using the 2-DDCt method [23].
FACS analysis
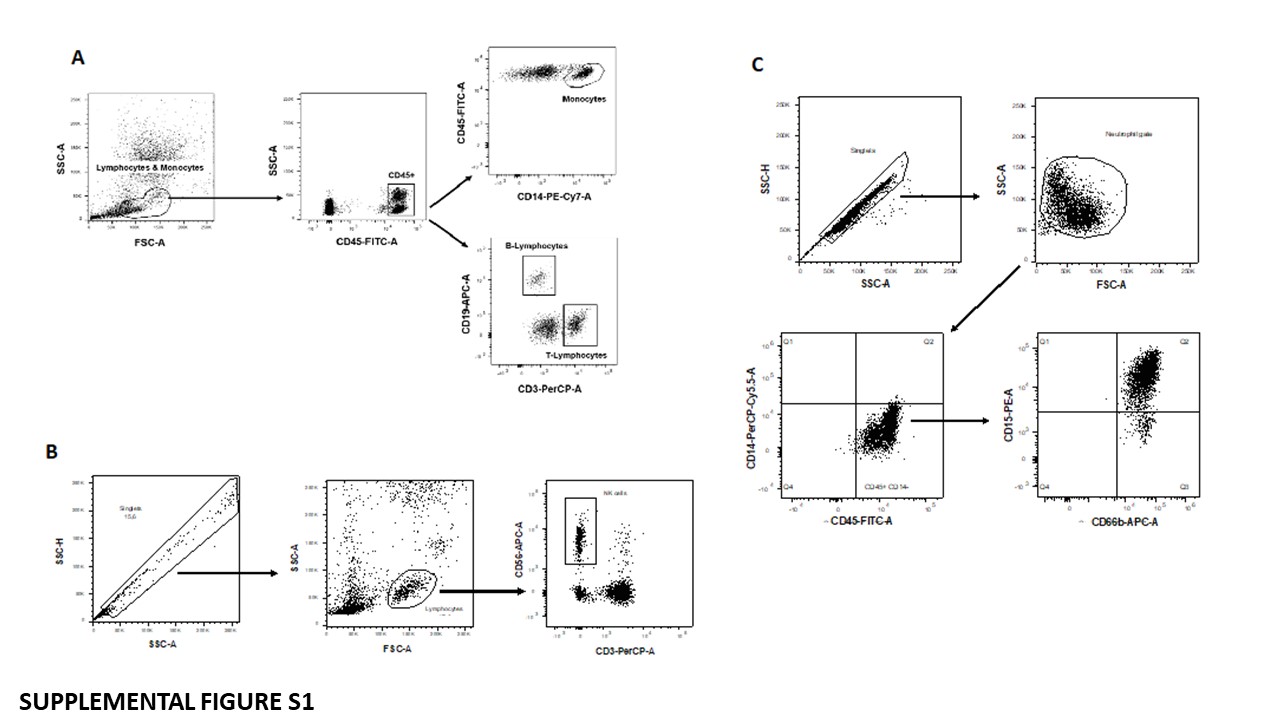
PBMCs and neutrophils were isolated from the peripheral blood (20 and 12 mL respectively, in K2-EDTA anticoagulant tubes) collected at MM from healthy volunteers by density gradient centrifugation at 1,200 rpm using Ficoll Histopaque®-1077 (Millipore Sigma, US). The white ring interface, composed of PBMNCs, was used for T-lymphocytes, B-lymphocytes, monocytes, and NKT cell isolation by FACS-sorting. The bottom layer, composed of granulocytes (mostly neutrophils) and erythrocytes, following the depletion of erythrocytes, was used for neutrophil quantification by multicolor flow cytometry. Briefly: neutrophils (n=14) were purified by lysis of erythrocytes, using ACK (Ammonium-Chloride-Potassium) Lysing Buffer. Neutrophils (105) were stained for 30 min at 4°C with the following monoclonal anti-human antibodies (mAbs): FITC-conjugated CD45 (REA747), PE-conjugated CD15 (VIMC6), APC-conjugated CD66b (REA306) and PerCP-Vio 700 conjugated CD14 (REA599), all purchased from Miltenyi Biotec (Germany). Following morphological gating on viable cells and singlets selection, neutrophil enrichment was verified by CD45+/CD14-/CD15+/CD66b+ surface antigen expression, assessed by flow cytometry, using BD LSR FortessaTM X-20 Cell Analyzer. The following mAbs were used for FACS Sorting of Monocytes, T- and B-lymphocytes (n=8), and NKT cell (n=6): FITC-conjugated CD45 (REA747), APC-conjugated CD14 (REA599), PerCP conjugated CD3 (BW264/56), PE-conjugated CD19 (REA675) and APC-conjugated CD56 (REA196). PBMNCs subpopulations were isolated by FACS-sorting using BD FACS-AriaII instrument as follows: CD45+/CD14-/CD19-/CD3+ (T-lymphocytes), CD45+/CD14-/CD3-/CD19+ (B-lymphocytes), CD45+/CD14+/CD3-/CD19- (monocytes) and CD3-/CD56+ (NKT). Gating strategies are shown in supplementary Figure S1.
Cell cultures and hypoxia experiments
Human T lymphoblast cell lines (THP-1) (ATCC, TIB-202) and Jurkat (Clone E6-1, ATCC, TIB-152) were maintained in RPMI 1640 medium (Lonza, Switzerland) containing 10% FBS (Lonza, Switzerland), 2 mM L-glutamine (Lonza, Switzerland), 1x non-essential amino acids (Lonza, Switzerland) and 100 units of Potassium Penicillin and 100 μg of Streptomycin Sulfate per 1 ml of culture media (Lonza, Switzerland).
For hypoxia experiments, THP-1 cells were incubated at 37°C in a Ruskinn hypoxia cabinet (Baker, US) with 1% O2 and 5% CO2 and compared to cells incubated in normoxic conditions (37°C; 21% O2; 5% CO2).
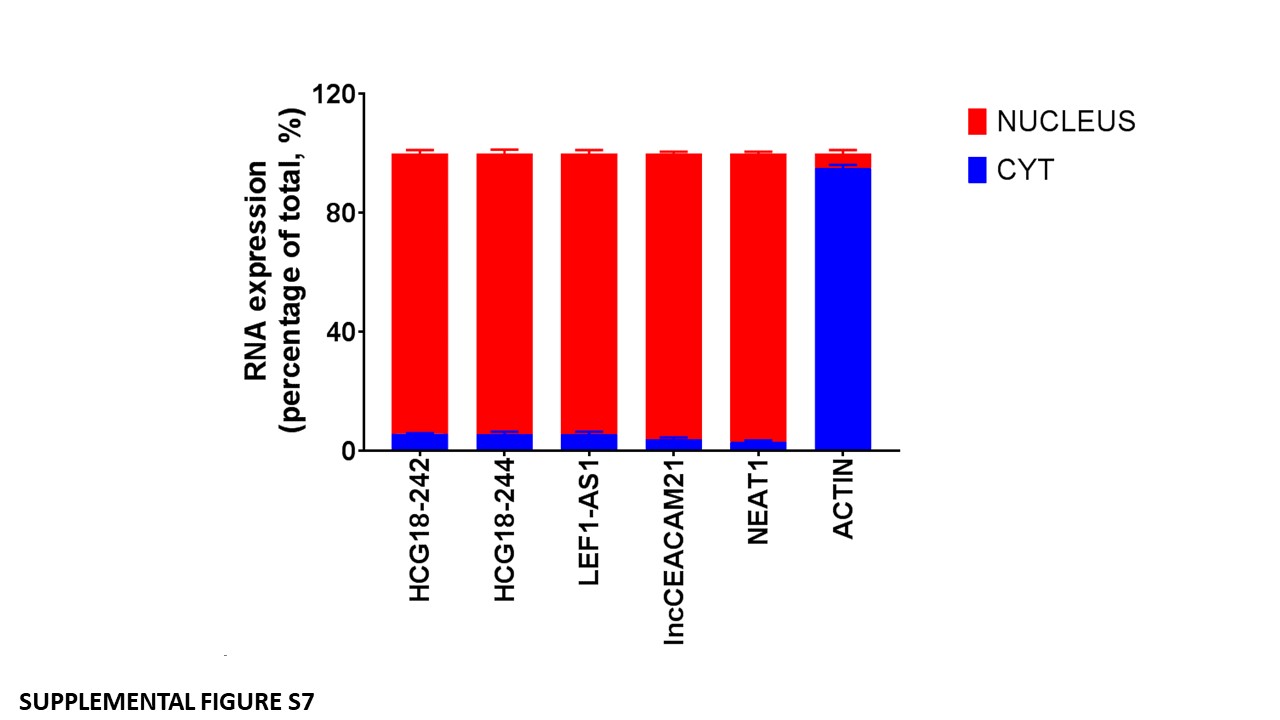
Nuclear/cytoplasm fractionation
Nuclear/cytoplasm fractionation was performed in Jurkat cells using Paris Kit (Thermo Fisher Scientific Inc., US) according to the manufacturer’s recommendation. RNA was extracted using miRNeasy Micro kit (Qiagen, Germany) and analyzed by RT-qPCR using Superscript™ II Reverse Transcriptase (Thermo Fisher Scientific Inc., US) for cDNA synthesis and IQ SYBR Green supermix (Bio-Rad, US) for real-time PCR on a CFX96 Real-Time PCR instrument (Bio-Rad, US).
Statistical analysis
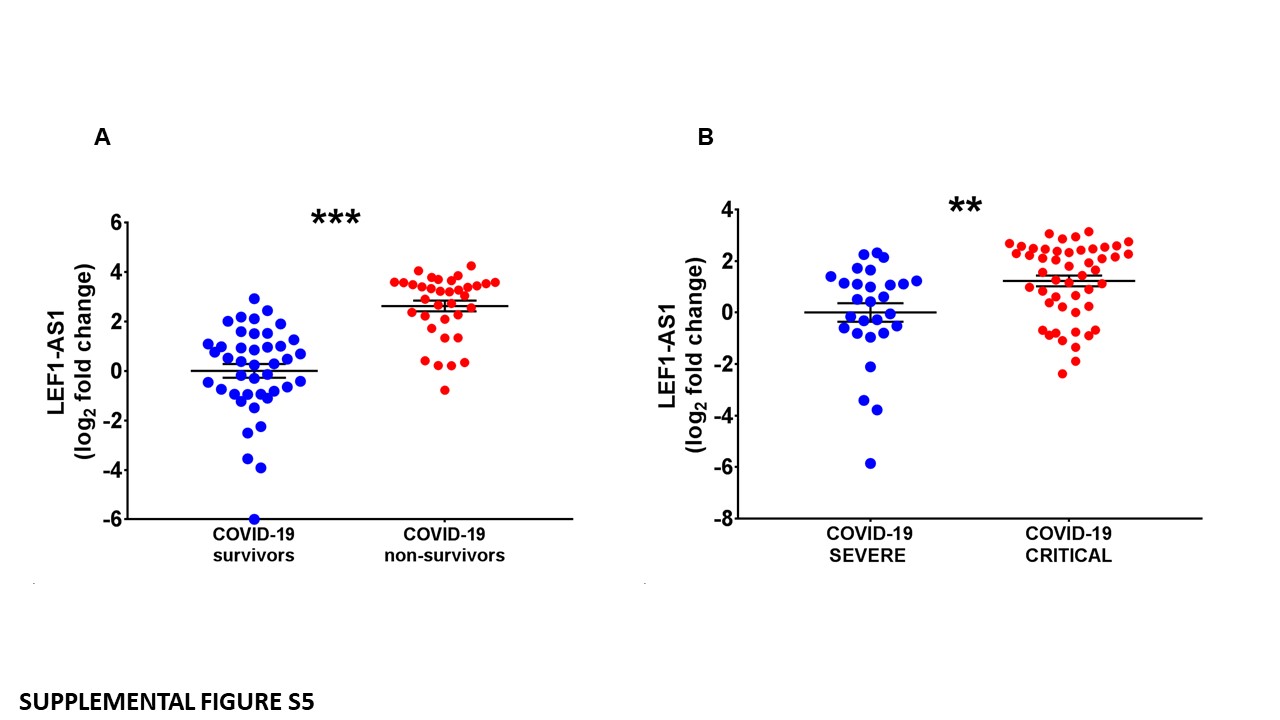
Continuous variables were expressed as mean ± standard error of the mean (SEM). For group-wise comparisons, Mann–Whitney test or unpaired t-test was used as required. ANOVA test followed by Tukey’s post-hoc test was used to compare the means of more than 2 groups. All tests were performed 2-sided and a p< 0.05 was considered as statistically significant.
Descriptive statistics are expressed with counts and percentages for categorical variables and mean ± SD or median values with the interquartile range (IQR) for continuous variables.
A logistic regression model was used to evaluate adjusted odds ratios for age and sex. Receiver operating characteristic (ROC) curve, area under the curve (AUC) and odds ratio (OR) of each lncRNA related to the death or COVID-19 severity with and without the adjustment of age or sex were then calculated.
Statistical analyses were performed with SAS software, version 9.4 (SAS Institute, Inc., Cary, NC, USA) or with GraphPad Prism v.7.01 software (GraphPad Software Inc.).