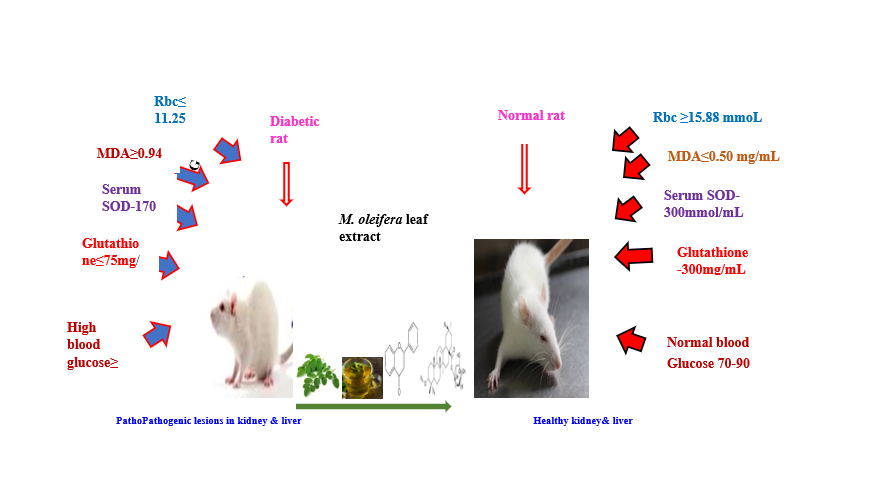
To improve the traditional use of Moringa oleifera for the management of type 2 diabetes, the potent plant parts (seeds, leaves, stem bark, roots) must be specified and the appropriate dosage should be quantified. This research reports quantitative findings on the antihyperglycaemic properties of M. oleifera leaves. Streptozotocin (STZ) induced type 2 diabetic Wistar rats, were treated with iterative levels of the ethanolic leaf extract of Moringa oleifera (X1). Time of exposure (X2) of the rats to the extract, concentration, and time of storage of the leaf sample before extraction (X3) were monitored. The biomarkers of type 2 diabetes in the rats were monitored in a response surface model to optimize the ideal conditions for the antihyperglycaemic effects of M oleifera leaves. Haemoglobin count increased from ≤11.25mmol/L) to 15.88 mmol/L) as the dose of the extract and time increased. Diabetic rats were glutathione deficient (70-98 mg/ml), which improved to 300mg/dL after treatment. Serum Superoxide dismutase (SOD) was 170 mm/moL in diabetic rats and 300 mmol/mL in fully treated rats. Blood glucose of STZ-induced diabetic rats (over 220mg/dL) decreased to normal levels of 70-90 mg/dl. The extract was safe at 2250 mg/kg body weight. Fifty (50) g of shade-dried ethanolic extract of M. oleifera leaves stored for less than 3 months restored STZ-induced diabetes in Wistar rats within 28 days.
Research Article
Ethanolic extract of Moringa oleifera leaves shows Anti-hyperglycemic potencies on experimental Wistar rats: a focus on optimization of biomarkers of type 2 diabetes
https://doi.org/10.21203/rs.3.rs-3103145/v1
This work is licensed under a CC BY 4.0 License
Version 1
posted
You are reading this latest preprint version
Hyperglycaemia
malondialdehyde
Superoxide dismutase
haematological parameters
glutathione
ethanol extract of Moringa oleifera leaves.
The global burden of type 2 diabetes is on the increase especially in developing countries (Saeedi et al., 2019). The use of edible plants in nutrition and for health care is as old as mankind (Ziaei et al., 2020; Yang et al., 2019). The management of many health problems with plants is a common and varied practice, worldwide (Welz et al., 2019; Penalver et al., 2022) and especially in developing economies (Fahey et al., 2018). Availability, affordability, renewability of plant products and the perception of the consumers that most natural products are safer endear many people to the use of plant products (Governa et al., 2018; Wilcox et al., 2021). According to Debebe et al. (2017) cost and adulteration of many synthetic drugs have further encouraged the consumption of botanicals (Welz et al., 2019). Consumption of botanicals is often done without professional advice and supervision. Clinical supervision determines the type, dosage of new substances, and period of exposure of the animal to the product. Therefore, absence of supervision could lead to toxicity, morbidity, low level of economic productivity and even deaths (Welz et al., 2019).
M. oleifera Lam. is an underutilized nutritious plant (Zaku et al., 2015; Trigo et al., 2023). Generally, M. oleifera is deployed to fight against malnutrition and many other ailments in different locations (Pop et al., 2022). The plant belongs to the Moringaceae family and consists of up to 13 species (Rani et al., 2018). It can tolerate poor agronomical conditions of and it is drought resistant (Zaku et al., 2015). There are perceptions and scientific claims that the leaf has some disease-healing and nutritional properties (Omodanisi et al., 2017) and is good for the management of diabetes (Sissoko et al., 2020). The major natural products in the ethanol extract of Moringa leaves are flavonoids alkaloids and saponins.

While flavonoids and alkaloids have schematic representations of their structure, alkaloids contain at least one nitrogen atom in an amine-type structure, which is an active base or can take part in acid-base reactions. Alkaloids often have one or more of their nitrogen atoms as part of a cyclic system (Encyclopaedia Brittanica, 2023).
The Moringa plant is claimed to treat nervous debility, malaria, paralysis, asthma, ulcer, infection, cough, fever, high blood pressure, type 2 diabetes (T2D) and inflammation etc. because it is a rich source of phytochemicals (saponins, flavonoids, phenols, alkaloids, tannins, phytates, steroids and terpenoids) and nutrients (Kusmiyati et al., 2022). Often, the user does not know which part of the plant is useful for the specific ailment and the quantities that should be consumed. To address this challenge, we have designed an investigation on the claim of anti-hyperglycemic power and safety of ethanol extract of the leaf of M. oleifera using the response surface methodology (RSM) focusing on the optimization of some biomarkers of the streptozotocin (STZ)-induced Type-2 diabetic albino rats to determine the optimal concentration of the plant extract, exposure time of the rats to the extract, and period of storage of the leaf before extraction. The findings from this research will help curb the global upsurge in T2D.
2.1. Material
Fresh leaf of M. oleifera was obtained from mature plants in Utu Ikpe Village, Ikot Ekpene Local Government Area of Akwa Ibom State, Nigeria. The plant was identified by the Herbarium Unit of the School of Applied Sciences, Department of Science Laboratory Technology, Akwa Ibom State Polytechnic, Ikot Ekpene.
Experimental design
This experimental design optimizes a response (output variable) which is influenced by several independent variables- concentration of plant extract (X1), time of exposure (X2), and sex (X3) of the rats assuming the relationship in equ. 1.
Y n = β0 + β1X1 + β2X2 + β3X3 + β 12X1X2 + β13X1X3 + β23X2X3 + β11X12 + β22X22 + β33X32 1
where Yn is any predicted value, β0 is offset term, β1 is linear effect, β12 is p effect, and β11 is quadratic effect. The main effects, X1, X2, and X3 represent average response of iterative change of predictor variables at a time from its lowest to highest levels. The interaction terms (X1X2, X1X3, and X2X3) represent the response when all the factors simultaneously change, the polynomial term X12, X22, X32 are to investigate nonlinearity. The study was designed to estimate the antihyperglycemic power of ethanolic extract of M. oleifera leaf on Streptozotocin (STZ)-induced diabetic rats using the rotatable central composite design of the response surface methodology.
2.2. Animal models and management.
Animal management, gathering, and grouping, were carried out in compliance with the guidelines of the Committee for the Control and Supervision of Experiments on Animals (Pereira, 2004). Sixty (60) healthy, mature Albino rats (Rattus norvegicus) with mean weight of 201 ± 5.0g were obtained from the Animal House, Department of Pharmacy and Pharmacognosy, University of Uyo, Nigeria. The rats were quarantined and acclimatized for two (2) weeks, during which they were fed with rodent mash and water ad libitum (Grand Bendel Ltd, Edo State, Nigeria). They were maintained under standard conditions of 12 h light/dark cycles at about 27.0 ± 2.0oC. The rats were randomly selected and assigned to different cages for treatment.
2.3. Determination of acute toxicity of ethanol extract of leaf of M. oleifera
The LD50 of the extracts was estimated on mature rats. They were injected intraperitoneally using the modified method of Sevda et al. (2017). The LD50 experiment was carried out in phases as follows:
Phase 1
The animals were fasted for 18 h, thereafter they were weighed and grouped into 5 rats per group of 200 ± 5 g. Each group of 5 rats received arbitrary dosage of the ethanol extract at 250, 500, 750, 1000 and 1250 mg/kg body weight (ip) and was observed for physical signs of toxicity and mortality within 24 h. LD50 was calculated according to Eq. 3.

Phase 2
For maximum dosage of the extract, the rats were equally fasted for 18 h before they were weighed and grouped into 5 rats with mean weight of 200 ± 5 g. Each group of 5 rats were dosed 1500, 1750, 2000 and 2250 mg/kg of the extract (ip) and was observed for physical signs of toxicity and mortality within 24 h. Based on these observations LD50 of the extract on the mice was calculated according to Eq. 3.

where, A = maximum dose which produced 0% mortality; B = minimum dose which produced 100% mortality
2.4. Induction of experimental Type-2 diabetes
Type 2 diabetes was induced in the rats according to the method of Mohamed and Laurence (2011). After 18-h fasting, the rats were intraperitoneally injected 120 mg/kg (body weight) with freshly prepared streptozotocin (STZ) in distilled water solution. After 48 h post-streptozotocin injection, fasting blood glucose concentration of the animals was determined using the Oxidase-based Commercial Glucometer (Accuchck axtive, Roche Diagnostic) according to the manufacturer’s instructions. Rats which exhibited fasting blood glucose of ≥ 250 mg/dL were considered diabetic and included in the experiment.
2.5. Determination of biomarkers in Albino rats
Haematological and diabetic biomarkers of the animals were determined according to the method adopted by Sharifudin et al. (2013) using the Automatic Haematologic Analyzer (Sysmex KX-21).
2.6. Optimization of biomarkers of diabetic Albino rats
Optimization of the biomarkers and other health parameters of the rats was carried out by the Central Composite Design (RCCD) (Table 1) to estimate parameters of full second-degree models and building a quadratic model for accurate estimation of responses (Ruguo, 2000). The small option of the design with twenty (20) experimental runs was generated with the Design-Expert Version 12 of Stat-Ease, Inc., 2021 East Hennepin Avenue Suite 480 Minneapolis, MN 55413, USA using concentration of the leaf’ extract (X1), exposure time of animals to the extract (X2) and sex of the animal models (X3). The experimental design is shown in Table 1.
|
Independent variables |
Unit |
-α |
-1 |
0 |
1 |
+α |
|---|---|---|---|---|---|---|
|
Conc. (X1) |
% |
12 |
0 |
50 |
100 |
72 |
|
Exposure time (X2) |
day |
20 |
0 |
50 |
100 |
120 |
|
Storage time of plant sample (X3) |
Day |
0.79 |
0 |
25 |
50 |
2.21 |
| Each factor was varied over 5 levels: -plus, and minus α (axial point), plus minus 1 (factorial point) and the center point. The design used the small option with 10 center point, 15 runs and α of 1.414. (Rotatable design), no replication and 1 star point | ||||||
In this study, the 2nd -order coefficients were generated by regression analysis with stepwise and backward elimination. Responses were initially fitted for the individual factors by the partial least squares’ regression analysis. The fit of the models was assessed by the coefficient of determination (R2) and analysis of variance (ANOVA). The insignificant factors and the terms were eliminated from evaluation and the models were finally defined.
2.7. Calculation of the middle level in RCCD
Given the minimum and maximum levels, middle, and alpha levels of the variables in RCCD were calculated from equ. 2 and 3.
Xi-real = Xreal + 1 + Xreal. -1
+ Xreal + 1 - Xreal-1 - Xi.code 4
where
Xi.real is the real value of any coded value, Xi.code, Xreal.+1, and Xreal.−1 are the upper and lower real levels corresponding to coded levels + and − 1.
Calculation of the α values
Xpq = [-1] integer [2|p-1] 5
Where p: 1, 2, n is the row number in the coded 2n factorial design q: 1, 2 …, 2n is the column number (trial number) in the coded 2n factorial design.
2.8. Administration of ethanol extract of leaf of M. oleifera on diabetic rats
Concentration of 0 to 100% of ethanol extract of leaf of M. oleifera was administered orally (by intubation) to the rats for thirty (30) days using graded concentration of the extract and gender of the animal models as independent variables according to the experimental design in Tables 1 and 2 and according to the method of Mohamad et al. (2005).
2.9. Blood collection and determination of hematological parameters
At the end of each experimental run, blood samples were taken through the ear vein of the rat with sterile syringes each into a labeled, sterile bottle. Ethyl diamine tetra acetic acid (EDTA) powder was the anti-coagulant used. The samples were stored and used for determination of red blood cell count (RBC) (Adedapo et al., 2009) and diabetic markers. Histology of the kidney and liver of the experimental animals were carried out according to the method of Saalu et al. (2013). The organs were sectioned with a Rotary Microtome, (Leica RM 2125), fixed in 10% normal saline; dehydrated in 70% alcohol; transferred into molten paraffin wax and stained with haematoxylin and eosin stains for microscopy. Slides from diabetic, partially treated and fully treated with the ethanol extracts of Moringa oleifera were compared.
Table 2 presents experimental runs, blocks, graded values of independent variables (X1 to X3) and dependent variables (Y1 to Y7).
|
Runs |
Block |
X1 |
X2 |
X3 |
Y1 |
Y2 |
Y3 |
Y4 |
Y5 |
Y6 |
Y7 |
|---|---|---|---|---|---|---|---|---|---|---|---|
|
4 |
1st |
100 |
100 |
0 |
98 |
220 |
7.45 |
300 |
21.71 |
300 |
0.501 |
|
6 |
1st |
100 |
0 |
50 |
245 |
107 |
6.23 |
170 |
12.45 |
298 |
0.605 |
|
11 |
1st |
50 |
50 |
25 |
83 |
111 |
6.01 |
75 |
21.09 |
300 |
0.506 |
|
12 |
1st |
50 |
50 |
25 |
79 |
116 |
6.5 |
71 |
20.11 |
298 |
0.506 |
|
9 |
1st |
50 |
50 |
25 |
91 |
120 |
6.91 |
89 |
19.9 |
287 |
0.576 |
|
3 |
1st |
0 |
100 |
0 |
213 |
90 |
4.99 |
201 |
12.13 |
180 |
0.561 |
|
5 |
1st |
0 |
0 |
50 |
213 |
80 |
4.12 |
200 |
12.89 |
178 |
0.506 |
|
1 |
1st |
0 |
0 |
0 |
220 |
79 |
7.79 |
287 |
11.89 |
173 |
0.581 |
|
10 |
1st |
50 |
50 |
25 |
89 |
115 |
5.11 |
102 |
19.98 |
289 |
0.419 |
|
8 |
1st |
100 |
100 |
50 |
69 |
226 |
7.9 |
301 |
22.11 |
321 |
0.509 |
|
2 |
1st |
100 |
0 |
0 |
220 |
90 |
6.01 |
298 |
12.9 |
162 |
0.605 |
|
7 |
1st |
0 |
100 |
50 |
221 |
89 |
4.76 |
276 |
11.94 |
168 |
0.657 |
|
19 |
2nd |
50 |
50 |
25 |
82 |
122 |
4.23 |
100 |
20.21 |
300 |
0.512 |
|
18 |
2nd |
50 |
50 |
68 |
80 |
123 |
5.33 |
98 |
20.21 |
298 |
0.634 |
|
16 |
2nd |
50 |
134 |
25 |
93 |
200 |
6.9 |
254 |
19.21 |
162 |
0.566 |
|
15 |
2nd |
50 |
34 |
25 |
223 |
92 |
5.79 |
289 |
11.98 |
165 |
0.56 |
|
17 |
2nd |
50 |
50 |
17 |
84 |
100 |
5 |
170 |
12.16 |
170 |
0.569 |
|
13 |
2nd |
34 |
50 |
25 |
213 |
98 |
5.41 |
288 |
11.23 |
166 |
0.5 |
|
14 |
2nd |
134 |
50 |
25 |
100 |
229 |
7.5 |
297 |
22.12 |
298 |
0.51 |
|
20 |
2nd |
50 |
50 |
25 |
77 |
115 |
5.64 |
167 |
16.32 |
176 |
0.65 |
X = Independent variables: X 1 = % concentration of ethanolic extract of M. oleifera, X2 = Exposure (in days), X3 = Sex of animal model (male = 1, female = 2). (Yn) = Responses: Y1 = Blood glucose (mmol/l), Y2 = Body weight (g), Y3 = Red blood cell concentration (%), Y4 = Glutathione (GSH), Y5 = Malonaldehyde (MDA) Umol/g, Y6 = Superoxide dismutase (mmol/ml), Y7 = Weight of kidney (g).
3.1. Blood glucose level
Figure 1 presents variation of blood glucose level in the diabetic rat at subnormal and normal treatment. The blood glucose levels decreased in the diabetic rats (≥ 250 mg/dL) to sub-normal (120 mg/dL), and normal (65–100 mg/dL) values with an increase in the concentration of the extract and period of exposure of the rats to the extracts. Analysis of variance on the data revealed that the model of blood glucose was significant (p < 0.05), predictable R2 = 0.9962, with a mean value of 139.65 mg/mL (Fig. 1). Equ. 3 shows strong contribution of the variables to the model parameter. The observation in the work agrees with the trend reported by Ewis and Abel-Rahman (1995) on ‘effect of metformin on glutathione and magnesium in normal and STZ-induced diabetic rats. The slight differences could be attributed to nutritional status, and age of the rats.

Blood glucose level is an important biomarker in the diagnosis, treatment and management of type 2 diabetes (T2D). In this study, blood glucose level of STZ-induced diabetic rats on treatment decreased significantly (p<0.05) from ≥250 mg/dL to normal level of 70-90 mg/dl. The concentration and exposure-time to the extract affected the blood glucose level. Diabetes (T2D) involves insulin resistance, insulin deficiency, and glucose overload, which emanate from the malfunctioning of the pancreas. Any substance which can restore these factors is antidiabetic (Peter et al., 2019). Untreated diabetic rats had higher blood glucose level ≥250 mg/dl, exhibited low body weight, high liver and kidney weight. Omotoso et al. (2018) had observed that moringa product can restore an injured pancreas. Hypoglycemic potency of moringa leaf has been reported by Awodele et al. (2012). Adedapo et al. (2009) reported the restoration of biological enzymes to normal levels by aqueous extract of Moringa leaf.
3.2. Body weight
Figure 2 presents the relationship between body weight of diabetic rat and dose of the extract as well as exposure time. The Figure shows that the weight of diabetic rats increased with doses and exposure time of rats to the extract. Body weight of the diabetic rats were lower than that of normal rats. The trend is elucidated by Fig. 2, equ. 7

According to Figure 2, rats gained weight as treatment progressed according to the dose administered and time of exposure to the extract. Analysis of variance on the body weight data revealed that the model was significant (p< 0.05), R2 = 0.8895, and mean body weight of 241.95 g was observed (Fig. 2 and Eq. 5). Stunting and death were observed in rats which did not receive the treatment. Rats treated with low dose of the extract at any exposure time exhibited low recovery from the effect of STZ. The result of the work was like the one reported by Adedapo et al. (2009) on safety of Moringa products. Body weight of rats increased significantly (p<0.05) as treatment progressed at rates proportional to days of exposure and concentration of the extract. Untreated animals continued to lose weight possibly due to increased lipolysis, glycogenolysis, gluconeogenesis (Ali et al., 2017). M. oleifera leaf extract restored the diabetic animals to a healthy state. This finding is similar to reports by Re et al. (1999) and Williams et al. (2015). Garima et al. (2011) and Tahmasse et al. (2013) attributed the activity of Moringa to the content of polyphenolic compounds many of which are antioxidants.
3.3 Red blood cell count
Response of red blood count of STZ-induced diabetic rats to treatment with extract leaf of M. oleifera is presented in Figure 3. The result revealed that red blood cell count increased from the diabetic state (≤ 11.25 to 15.88 mmol/L) to normal value as the dose of the extract and time increased (Fig. 3, Equ. 8). Analysis of variance on the data showed that the model appeared significant (p<0.05) with the coefficient of variation, R2 = 0.5663. The mean value of the parameter was observed to be 5.98 mg/mL. The observation in the work agrees with that of Veerasamy et al. (2008) who reported a rapid increase in red blood cell count and packed cell volume in diabetic rat treated with extract of M. oleifera.
Red blood cell count =
6.46 - 011X1-0.0091X2-0.030X3 +0.006X1X2-0.00048X1X3 8
Low haemoglobin concentration is associated with low postprandial peptide concentration and low β-cell responsiveness (Khawaja et al. 2010). Untreated animals and those that received low concentrations of the plant extract showed weakness and stunting. Since diabetic progression is a function of β-cell dysfunction as result of damage to pancreatic islet cells, the increase levels in the red blood cell could be from blood forming nutrients in M. oleifera leaf.
3.4 Glutathione
Effect of concentration of glutathione in the blood serum samples of the STZ-induced diabetic rats is presented in Figure 4. The values ranged from 75 mg/mL in diabetic rats to 300 mg/mL in normal rats and rats fully treated with the extract, respectively. The result revealed that all the diabetic rats at the beginning of the experiment exhibited glutathione deficiency of approximately 70-98 mg/ml. The level improved with increase in the dose, and period of exposure of the rats to the extract. Mathematical model of the glutathione was significant (p<0.05), regression analysis, showed a linearity coefficient of R2 = 0.8880, the mean of the parameter was 166.25 mmol/L and standard deviation of 30.61 (Fig. 4; eq. 9) showed steady increase of the value of the parameter at a dose- and exposure time-response trend. The period of storage of the leaf did not show any effect on the parameter (Fig. 4, Equ. 9). The observation agreed with the observation of Adeeyo et al. (2013) who reported on the effect of M. oleifera on the antioxidant status of diabetic rats.
Glutathione = 285.58-2.59X1-3.10X2– 2.216X3+0.029X1X2
+0.027X12+0.024X2X2 9
GSH plays an important synergistic role in defense against oxidative stress in mammalian models (Barsha et al., 2021). The synthesis of GSH starts with the formation of α-glutamyl-cystine-cysteine, the reaction is catalyzed by α-glutamyl-cystine-synthase. The value for glutathione varied between 106-220 Umol/g and was significantly (p<0.05) different among the animal models. The range of values are at variance with that reported by Barsha et al. (2021) on ‘beneficial effect of the methanolic leaf extract of Allium hookeri on stimulating glutathione biosynthesis and preventing impaired glucose metabolism in type 2 diabetes’. The level of reduced glutathione is lower in diabetics because of increased oxidative stress (Kalkan and Suher, 2013). Depletion of glutathione could arise from its utilization in diabetes. The high glutathione levels in animals fed with moringa extracts could be attributed to the high content of nutrients required for blood formation in the moringa extract (Barsha et al., 2021; Verma et al., 2021).
3.6 Malondialdehyde (MDA)
Dose of Moringa leaf extract and exposure of diabetic rats to the extract significantly affected (p .05) the level of MDA in STZ-induced diabetic rats (Figure 5). According to the Figure, MDA level was reduced significantly (p<0.05) by treatment of diabetic rats with moringa leaf extract (0.50). The model of MDA was significant (p<0.05), the coefficient of linearity was R2=0.8930, and the mean value was 16.63 mg/ml. The model also showed negligible differences in the values (standard deviation of 0.0780. Fig. 5 and Equ. 10 show trends of the variation with changing value and contribution of each independent variable to the parameter. The observation in the work is like the report of Adeeyo et al. (2013) that SOD and MDA were increasing in STZ-induced diabetic Wistar rat as treatment with extract of leaf of Moringa continued. Also, Tahmasse et al. (2013) reported that grape and black rice anthocyanins could effectively reduce oxidation stress in vitro and in vivo due to increased levels of antioxidant
MDA =11.58+0.060X1+ 0.0627X2+0.002x3+0.00095X1X2
– 0.00051X12-0.00067X22+0.00023X32 10
Lipid peroxidation has a high positive association with hyperglycemia. Hyperglycaemic subjects experience low insulin levels because beta-cells of the pancreas are not functional. Under diabetic conditions, normal metabolism is diverted the use of fatty acid and acetyl-CoA (Verma et al., 2021). Oleic acid could enhance the release of insulin and help normalize insulin secretion thereby preventing peroxidation. The high MDA levels of diabetic animals was reduced by treatment with M. oleifera extract. The results suggest that the treatment with ethanol extract of M. oleifera leaf led to reduction in lipid peroxidation. Verma et al. (2021) and Fahey et al. (2018) reported similar results. Malonaldehyde is one of the final oxidation products of poly unsaturated fatty acids and its overproduction could cause brain damage. Adeeyo et al. (2013) and Dorcely et al. (2017) respectively, also reported healing of target organs of tested animal models. The low-level MDA in the blood of treated animal models indicate that Moringa products can protect against tissue damage.
3.7 Superoxide dismutase (SOD)
Serum concentration of SOD of STZ-induced type 2 diabetic Albino rats which were treated with ethanolic extract of leaf of M. oleifera increased from 170 to 300 mmol/mL in diabetic to normal (fully treated rats) respectively. Mathematical model of the parameter was significant (p<0.05), R2=0.682, Adj. R2=0.5918). The analysis of variance showed a mean value of 234.0 mg/mL, the increment of SOD concentration exhibited steady increment towards normal value of ≤300 mmol/ml as treatment with the plant extract progressed. Fig. 6 and Eq. 11 are pictorial and mathematical responses respectively of the interaction between the parameter and the extract.
The equation further showed the magnitude of influence of the independent variables on the SOD level. The observation agreed with the values which were reported by Adeeyo et al. (2013) on ‘increased SOD levels in STZ-Nicotinic-induced diabetic Albino rats to normal within a week of treatment with Moringa extract’. Ali et al. (2017) on ‘the effect of Egyptian M. oleifera Lam. on blood haematology, serum biochemical parameters and lipid profile with special reference to kidney function in Albino rats’ reported a stable value of SOD of about 220 mmol/ml.
SOD =138.864+0.88X1+1.563X2+1.069X3 -0.13X22 11
Superoxide dismutase (SOD) of the STZ-induced type 2 diabetes rats treated with 0 to 80% ethanolic extract of shade-dried leaf of M. oleifera for 40 days varied significantly (p<0.05). Reduction in the levels of SOD enzymes in the animals treated with low doses of the extract were not significant (p>0.05). Untreated animals did not exhibit good health throughout the period of exposure to the test substance. SOD boosts the natural immune system by enhancing the activity of the antioxidant enzymes against the formation of free radical in mammalian tissues. Tissue integrity of antioxidants affects the development of diabetic complications as was reported by Dachana et al. (2010). The enzymatic antioxidant, SOD, is one of the primary enzymes that directly eliminates reactive oxygen species (ROS), (Semenova et al., 2022). It is an important defense enzyme and a scavenger of O2 from H2O2, the intervention diminishes the toxic effects due to free radical injury from secondary reaction (Abdel-Monsef et al., 2023). Besides, SOD prevents diabetes mellitus due to non- enzymatic glycosylation and oxidation. In the present study, the depletion of SOD in the diabetic rats could be attributed to inactivation caused by STZ-generated ROS and the SOD level was eventually improved by the bioactive components in the plant extract (Rani et al., 2018; Islam et al., 2021).
3.8 Weight of kidney
Influence of the moringa leaf extract on the weight of kidney of diabetic and fully treated, non-diabetic rats is presented in Figure 7. The Figure shows that the diabetic organ was 0.553g and 0.501 g for the treated rat. ANOVA on the data revealed that the model was not significant (p>0.05), R2=22.03%. The observation is like the reports of Zafar and Naqvi (2010) who reported on effects of STZ-induced diabetes on the relative weights of kidney, liver and pancreas in Albino Rats. Differences in finding could be attributed to the breed and strain of the animal models, exposure time of the animal models could be too short to achieve total restoration.
3.9The effects of major bioactive compounds in the plant product on the biomarkers of type 2 diabetes.
Overall, bioactive compounds in plant products are responsible for many of their health benefits (Vennila et al., 2017) and the extraction solvents used affect their potencies (Ojimelukwe et al., 2019). Ethanol soluble bioactive compounds in Moringa oleifera positively enhance metabolism of Wistar rats normalizing the negative effects of streptozotocin induced diabetes. Ethanolic extract of Moringa oleifera leaves have been found to contain a lot of phytochemicals (lutein, beta-carotene, phytyl fatty acid ester, beta-sitosterol (90 μg/mL), phenols (9 μg/mL), flavonoids (27μg/mL) etc) and nutrients. Flavonoids, phenols, alkaloids and saponins are found in appreciable amounts (Soraya et al. 2022). Soraya et al. (2022) identified 17 chemical components in the ethanol extract of Moringa oleifera leaves with quinic acid, glycerol, and 2,3-dihydro-3,5-dihydroxy-6-methyl-4H-pyran-4-one (DDMP) as the most abundant compounds. Flavonoids help to regulate glucose metabolism, improve the activities of hepatic enzymes as well as the lipid profile (Al-Ishaq et al., 2019; Singh et al., 2022; Kusmuyati et al., 2022). Saponins may inhibit the hydrolysis of sugars by inhibiting amylases and glucosidases that break down starch into sugars thereby slowing down the rate of loading glucose into the blood stream (El-Barky et al., 2017).
3.10 Histopathology of Kidney and Liver of Experimental animals
The kidney cortex of diabetic Wistar rats had abnormal glomerulus (GM) and renal tubules (RT), it also showed some degenerating glomeruli (arrow) and tubule with distorted epithelium (open arrowhead).
The kidney of the diabetic Wistar rats after treatment with 80% ethanolic extract of M. oleifera leaves had normal parenchymal architecture, renal tubules (Rt), and glomeruli (GM), and the pathological lesions observed in diabetic rats were no longer there.
Sections of the kidney of untreated diabetic Wistar rat and after full treatment with 80% ethanolic extract of M. oleifera administered for 30 days.
The liver of untreated diabetic Wistar rats showed dilated central vein (CV) arrays of hepatocytes (black arrowhead), and several inflammatory infiltrates (blue arrowhead), hepatocyte disarray, as well as inflammation. After exposure to 80% ethanolic M. oleifera extract for 30 days, the liver architecture became normal, with arrays of hepatocytes (arrowhead) and normal sinusoidal spaces (open head arrow). No pathological lesions were seen.
Figure Liver of diabetic Wistar rats before and after exposure to 80% M. oleifera ethanolic leaf extract for 30 days.
Observations, made on the kidney and liver of STZ-induced diabetic Wistar rats after 30 days of exposure to M. oleifera ethanol extract indicated regeneration of the cells and the loss of pathological lesions that were observed in the diabetic control group. This implies that treatment with ethanolic extract of M. oleifera ameliorates type 2 diabetes in streptozotocin induced diabetic Wistar rats. Optimization data depicted 28 days of exposure, but histological experiments were carried out after 30 days of exposing the diabetic animals to M. oleifera ethanolic extract.
Fifty (50) g of shade dried ethanolic extract of Moringa oleifera leaves stored for less than three months could be used to restore streptozotocin induced diabetes in Wistar rats. The haematological indices of diabetic rats and biomarkers of diabetes were restored to normalcy, within 28 days. It also possesses antioxidant compounds that will combat oxidative stress associated with the complications of type 2 diabetes.
Ethics approval and consent to participate. Not applicable
Consent for publication: All the authors gave their consent for the publication of this work.
Availability of data and materials: All data generated or analyzed during this study are included in this published article [and its supplementary information files]. Figshare: 10.6084/m9.figshare.22239220.
Competing interests. The authors do not have any competing interests to declare.
Funding: The work was partly sponsored by the Tertiary Education Trust Fund (TetFund) Nigeria, given to Patrick Udofia as beneficiary
Author contribution: Philippa C Ojimelukwe, originated the concept and supervised the work, she also edited the final manuscript; Olaoye O.A was the minor supervisor; Udofia, P. G., Ukom, A. N. Ekanem, M. C. carried out the experiments, collected, collated and analyzed the data. Every author proofread the work before it was sent for publication.
Acknowledgements: We acknowledge all the establishments who permitted us to use their facilities to carry out the work: Department of Pharmaceutical Chemistry, University of Uyo, Nigeria, IITA, Ibadan, Ministry of Science and Technology, Akwa Ibom State. Nigeria, the typist, Miss Sandra Thompson.
- Abdel-Monsef MM, Darwish DA, Zidan HA, Hamed AA, Ibrahim MA (2023) Characterization, antimicrobial and antitumor activity of superoxide dismutase extracted from Egyptian honeybee venom (Apis mellifera lamarckii). JGenet Eng Biotechnol 21: (2023). https://doi.org/10.1186/s43141-023-00470-4
- Adedapo AA, Mogbojuri OM, Emikpe BO (2009) Safety evaluations of the aqueous extract of the leaf of M. oleifera in rats. J Med Plants Res, 3(8): 586-591. Available online at http://www.academicjournals.org/JMPR
- Adeeyo AO, Adefule AK, Ofusor DA, Aderinola AA (2013) Caxton-Martins EA. Antihyperglycemic effects of aqueous leaf extracts of mistletoe and Moringa oleifera in streptozotocin-induced diabetic wistar rats. Diabetologia Croatica 42-3, 81-88
- Ali FR, Elalfy MM, Ahmed AH, and Ahmed M. (2017) Elgamal. Effect of Egyptian Moringa Oleifera Lam. on blood hematology, serum biochemical parameters and lipid profile with special reference to kidney function in albino rats. Nat Sci 15 (9):36-42. http://www.sciencepub.net/nature. 6. doi:10.7537/marsnsj150917.06
- Al-Ishaq RK, Abotaleb M, Kubatka P, Kajo K, Büsselberg D (2019). Flavonoids and Their Anti-Diabetic Effects: Cellular Mechanisms and Effects to Improve Blood Sugar Levels. Biomolecules, 9(9), 430. https://doi.org/10.3390/biom9090430
- Awodele O, Oreagba,IA , Saidi Odoma S , Jaime A. da Silva T , Osunkalu, VO (2012). Toxicological evaluation of the aqueous leaf extract of Moringa oleifera Lam. (Moringaceae). J Ethnopharmacol 139 (2):330-336
- Barsha D, Sagar RB, Simanta B, Bhaswati K, Prasenjit M, Jagat CB, Narayan CT (2021) Beneficial effect of the methanolic leaf extract of Allium hookeri on stimulating glutathione biosynthesis and preventing impaired glucose metabolism in type 2 diabetes. Arch Biochem Biophys. doi: 10.1016/j.abb.2021.108961.
- Britannica, T. Editors of Encyclopaedia (2023, February 1). alkaloid. Encyclopedia Britannica. https://www.britannica.com/science/alkaloid
- Dachana KB, Rajiv J, Indrani D, Prakash J (2010) Effect of dried moringa (Moringa oleifera Lam) leaf on rheological, microstructural, nutritional, textural and organoleptic characteristics of cookies. J Food Qual, 2010; 33(5):660-677. doi: 10.1111/j.1745- 4557.2010. 00346.x
- Debebe M, Afework ME, Makonneen E, Debella E, Geleta B (2017) Evaluation of biochemical, hematological and histopathological parameters of sub-chronic administration of ethanol extraction of Albizia gunmifera seed in albino Wistar rat. J. Clin Toxicol 7:337. doi: 10.4172/2161-0495.1000337
- Dorcely B, Katz K, Jagannathan R, Chiang SS, Oluwadare B, Goldberg IJ, Bergman M (2017). Novel biomarkers for pre-diabetes, diabetes and associated complications. Diabetes, metabolic syndrome and obesity. J Target Therapy. 10: 345-361. doi:10.2147/DMSO.S100074
- El Barky AR, Hussein SA, Abd-Elhameed A, Alm-Eldeen A, Hafez YA, Tarek-Mostafa Mohamed TM (2017) Diabetes Management. 7(1), 148–158
- Ewis SA, Abdel-Rahman, MS. (1995) Effect of metformin on glutathione and magnesium in normal and streptozotocin-induced diabetic rats. J Applied Toxicol. 15 (5): 387-390. https://doi.org/10.1002/jat.2550150508
- Fahey JW, Olson ME, Stephenson KK, Wade KL, Chodur GM, Odee D, Nouman W, Massiah, M, Alt JE, Egner PA, Hubbard WC (2018) The Diversity of Chemoprotective Glucosinolates in Moringaceae (Moringa spp.). Sci Rep 8:7994. https://doi.org/10.1038/s41598-018-26058-4
- Governa P, Baini G, Borgonetti V, Cettolin G, Giachetti D, Magnano AR, Miraldi E, Bialgi M (2018) Phytotherapy in the Management of Diabetes: A Review. Molecules 23, 105. doi:10.3390/molecules23010105
- Islam Z, Islam SMR, Hossen F, Mahtab-Ul-Islam K, Hasan MR, Karim R (2021) Moringa oleifera is a Prominent Source of Nutrients with Potential Health Benefits. Int J FoodSci https://doi.org/10.1155/2021/6627265
- Kalkan HI, Suher M. (2013). The relationship between the level of glutathione, impairment of glucose metabolism and complications of diabetes mellitus. Pakistan journal of medical sciences, 29(4), 938–942. https://doi.org/10.12669/pjms.294.2859
- Khawaja TM, Tahira M, Ikram UK (2010). M. oleifera: a natural gift – A review, J PharmSci Res, 2:775-781 doi: 10.12691/ajfn-6-4-4
- Kusmiyati K, Rahmawati E, Waangsir F, Selasa P (2022) Alkaloids, Flavonoids, Tannins and Saponins Contents in Moringa Oleifera Leaves. Indonesian J Global HealthRes, 4(1): 139-144. https://doi.org/10.37287/ijghr.v4i1.832
- Mohamad F, Mahomoodally A, Gurib-Fakim, Anwar HS (2005) Antimicrobial Activities and Phytochemical Profiles of Endemic Med Plants Mauritius, Pharm Biol 43:3, 237-242, doi: 10.1080/13880200590928825
- Mohamed S, Laurence F (2011) Histopathology Procedures: From Tissue Sampling to Histopathological Evaluation. Experiments. Methods in Molecular Biology. In: Drug and Safety Evaluation. doi: 10.1007/978-1-60761-849-2_4. Paris. France
- Ojimelukwe P, Udofia PG, Ukom A, Ukpe R. (2011) Optimization of insecticidal potency of composites of aqueous, acetone, and ethanol extracts of Piper guineense seed on Callosobruchus maculatus by the simplex-lattice mixture experimental design. Int J Environ, Agric Biotechnol (IJEAB) 3 (4):1183-1190 http://dx.doi.org/10.22161/ijeab/3.4.5
- Omodanisi EI, Aboua YG, Oguntibeju OO (2017) Assessment of the Anti-Hyperglycaemic, Anti-Inflammatory and Antioxidant Activities of the Methanol Extract of Moringa Oleifera in Diabetes-Induced Nephrotoxic Male Wistar Rats. Molecules 22, 439; doi:10.3390/molecules22040439
- Omotoso GO, Gbadamosi IT, Olajide OJ, Dada-Habeb SO, Tolulope TA (2018) Moringa oleifera phytochemicals protect the brain against experimental nicotine-induced neurobehavioral disturbances and cerebellar degeneration, Pathophysiol 25 (1):57-62. https://doi.org/10.1016/j.pathophys.2017.12.003.
- Peter EL, Kasali FM, Deyno S, Mtewa A, Nagendrappa PB, Tolo CU, Ogwang PE, Sesazi D (2019) Momordica Charantia L. Lowers Elevated Glycaemia in Type 2 Diabetes Mellitus Patients: Systematic Review and Meta-Analysis. J. Ethnopharmacol 231, 311–324. doi: 10.1016/j.jep.2018.10.033
- Pereira S, Veeraraghavan P, Ghosh S, Gandhi M (2004) Animal experimentation and ethics in India: the CPCSEA makes a difference. Altern Lab Anim. 2004 Jun;32 Suppl 1B:411-5. doi: 10.1177/026119290403201s67. PMID: 23581110.
- Pop OL, Kerezsi AD, Ciont-Nagy C (2022). A Comprehensive Review of Moringa oleifera Bioactive Compounds-Cytotoxicity Evaluation and Their Encapsulation. Foods (Basel, Switzerland), 11(23), 3787. https://doi.org/10.3390/foods11233787
- Rani NZA, Husaun K, Kumolosasi E. Moringa Genus (2018) A Review of Phytochemistry and Pharmacology. Frontiers Pharmacol 9 https://doi.org/10.3389/fphar.2018.00108
- Re R, Pellegrini N, Proteggente A, Pannala A, Yang M, Rice-Evans C (1999) Antioxidant activity applying an improved ABTS radical cation decolorization assay. Free Radic Biol Med. 26 (9-10):1231-7. doi: 10.1016/s0891-5849(98)00315-3. PMID: 10381194.
- Garima M, Pradeep S, Ramesh V, Sunil K, Saurabh S, Jha KK, Khosa RL (2011). Traditional Uses, phytochemistry and pharmacological properties of Moringa oleifera plant: An overview. DerPharmacia Lettre 3(2): 141-164
- Ruguo HU. Food product design: A computer-aided statistical approach. 2000; CRC Press, USA. pp 125
- Saalu LC, Akunna GG, Oyewopo AO (2013) The histo-morphometric evidence of Vernonia amygdalina leaf extract induced testicular. Int J Morphol (2):662-667.
- Saeedi P, Petersohn I, Salpea P, Malanda B, Karuranga S, Unwin N, Colaguiri S, Guariguata L, Motala AA, Ogurtsova K, Shaw JE, Bright D, Williams R (2019) IDF Diabetes Intervention Committee (2019). Global and Regional Diabetes Prevalence Estimates for 2019 and Projections for 2030 and 2045: Results from the International Diabetes Federation Diabetes Atlas, 9th Edition. Diabetes Res. Clin. Pract. 157, 107843. doi: 10.1016/j.diabres.2019.107843
- Semenova NV, Rychkova LV, Darenskaya MA, Kolesnikov SI, Nikitina OA, Petrova AG, Vyrupaeva EV, Kolesnikova LI (2022) Superoxide Dismutase Activity in Male and Female Patients of Different Age with Moderate COVID-19. Bull Exptal Biol Med 173(1), 51–53.
- Sharifudin SA, Fakurazi S, Hidayat MT, Hairuszah I, Mohd A, Moklas M, Arulselvan P (2013) Therapeutic potential of M. oleifera extracts against acetaminophen-induced hepatotoxicity in rats. PharmBiol., 51(3): 279-288. doi: 10.3109/13880209.2012.720993
- Sevda G, Khosrow K, Asgjar G (2017) A practical guide for induction of type-2 diabetes in rat: Incorporating ahigh-fat diet and streptozotocin. J Biomed Pharmacotherapy (95): 605-613. doi: 10.1016/j.biopha.2017.08.098
- Singh S, Bansal A, Singh V, Chopra T, Poddar J (2022) Flavonoids, alkaloids and terpenoids: a new hope for the treatment of diabetes mellitus. J Diabetes MetabolDisorders, 21(1): 941–950. https://doi.org/10.1007/s40200-021-00943-8
- Sissoko L, Diarra N, Nientao I, Stuart B, Togola A, Diallo D, Willcox ML (2020) Moringa Oleifera Leaf Powder for Type 2 Diabetes: a Pilot Clinical Trial. Afr. J. Traditional, Complement. Altern. Medicines 17, 29–36. doi:10.21010/ ajtcam. v17i2.
- Soraya C, Zulfan M. Nazar AM, Gani BA. (2022) Chemical Constituents of Moringa oleifera Leaves of Ethanol Extract and its Cytotoxicity against Enterococcus faecalis of Root Canal Isolate. Research J Pharm Technol. 15(8):3523-0. doi: 10.52711/0974-360X.2022.00591
- Tahmasse N, Dehghan G, Feizi MAH, Esnaeil HA (2013) Variation in body weight and some hematological parameters in streptozotocin-induced diabetic rats, treated with Teucrium orientale. Pharmacoloyonline. (3): 32-36. Corpus ID: 74695630
- Trigo C, Castelló ML, Ortolá MD (2023) Potentiality of Moringa oleifera as a Nutritive Ingredient in Different Food Matrices. Plant Foods Hum Nutr 78, 25–37 https://doi.org/10.1007/s11130-022-01023-9
- Vergara-Jimenez M, Almatrafi MM, Fernandez ML (2017). Bioactive Components in Moringa Oleifera Leaves Protect against Chronic Disease. Antioxidants (Basel, Switzerland) 6(4): 91. https://doi.org/10.3390/antiox6040091
- Vennila KP, Thirukkumar S, Ilamaran M. (2017) Identification of bioactive compounds in M. oleifera fruit by GCMS. J Pharmacognosy Phytochem. 6(3): 748-751.
- Veerasamy S, Vijayam B, Arunachalam P, Madhuri SB (2008). Abnormal” Fasting Plasma Glucose during Pregnancy. Diabetes Care 31(12): e92-e92.doi.org/10.2337/dc08-1553
- Verma AR, Vijayakumar M, Mathela CS, Rao CV (2021) Phyto-chemistry of Moringa oleifera. FoodChem Toxicol, 47(9): 2196-3001 doi: 10.4236/ajps.2021.123021
- Welz, A, Emberger-Klen N, Menad K (2019) The importance of herbal medicine use in the German health-care system: prevalence, usage pattern, and influencing factors. BMC J Health Services Res 19: 952.doi.org/10.1186/s2913.091439.0
- Williams LK, Zhang X, Caner S, Tysoe C, Nguyen NT, Wicki J (2015) Williams DE, Coleman J, McNeill JH, Yuen, V, Andersen RJ. The amylase inhibitor montbretin A reveals a new glycosidase inhibition motif. Nat Chem Biol., 11: 691-696
- Willcox ML, Elugbaju C, Al-Anbaki M, Lown M and Graz B (2021) Effectiveness of Medicinal Plants for Glycaemic Control in Type 2 Diabetes: An Overview of Meta-Analyses of
- Clinical Trials. Front. Pharmacol. 12: 777561.doi: 10.3389/fphar.2021.777561
- Yang L, Chen J, Lu H, Lai J, He Y, Liu S, Guo X (2019) Pueraria Lobata for Diabetes Mellitus: Past, Present and Future. Am. J. Chin. Med. 47, 1419–1444. doi:10.1142/S0192415X19500733
- Zafar M, Naqvi SM (2010) Effects of STZ-Induced Diabetes on the Relative Weights of Kidney, Liver and Pancreas in Albino Rats: A Comparative Study. Int J Morphol 28(1):135-142
- Zaku G, Emmanuel S, Tukur AA, Kabie A. (2015) M. oleifera; an underutilized tree in Nigeria with amazing versatility: A review. African J Food Sci 9(9):456-461. doi: 10.5897/AJFS2015.1346
- Ziaei R, Foshati S, Hadi A, Kermani MAH, Ghavami A, Clark CCT, et al. (2020). The Effect of Nettle (Urtica Dioica) Supplementation on the Glycemic Control of Patients with Type 2 Diabetes Mellitus: A Systematic Review and Meta-Analysis. Phytother Res. 34, 282–294. doi:10.1002/ptr.6535