2.1. DFT
2.1.1. Geometry optimization and Mulliken charge
The Gaussian 09 software was used at B3LYP/6-31G++(d, p) to optimize the geometry of the targeted nicotinamide derivative. The optimized structure, shown in Fig. 3a, provides the targeted nicotinamide derivative imine bond length (C16-N18) and the bond angles at the two ends of the created bond. The chemical system, which consists of 59 atoms and 250 electrons, has a ground energy or total energy (TE) of -43013.1 eV, suggesting a stable structure. The dipole moment's predicted magnitude of 5.451 Debye points to a highly reactive and polarizable structure. Figure 3b illustrates the polarizability and distribution of Mulliken charges along the chemical structure and hence estimates the potential of charge transfer in the targeted nicotinamide derivative. Figure 3b highlights the most electronegative and electropositive atoms in blue and orange dashed circles, respectively.
2.1.2. Frontier molecular orbital (FMO) analysis
The HOMO and LUMO; frontier molecular orbitals, explain quantitative information about the chemical system's affinity to interact with the target. Accordingly, HOMO and LUMO were computed for the targeted nicotinamide derivative. Except for the N-phenylbenzamide terminal; Fig. 4 shows that LUMO density lobes are distributed throughout the structure and the localized area is reduced in the case of HOMO density. Figure 4 shows the HOMO energy (EHOMO), LUMO energy (ELUMO), and the (HOMO-LUMO) energy gap; Egap. The Egap value is a significant stability parameter that well describes the reactivity and stability of a molecule. When electrons are quickly provided to an acceptor in a structure with a short Egap, it seems to be a more reactive and polar structure. Theoretical calculated Egap implies significant inhibitory reactivity due to charge transfer capacity [26]. Table 1 shows the ionization potential (IP) and electron affinity (EA) values, with a short Egap indicating high interaction with the target due to electron donation from the formed anticancer drug.
Table 1
The calculated global reactivity indices and energetic parameters for the targeted nicotinamide derivative
| IP | EA | µa | χa | ηa | σa | ωa | Dmb | TEa | ∆Nmax | ∆Ea |
|---|
| -6.177 | -2.201 | -4.189 | 4.189 | 1.988 | 0.503 | 17.442 | 5.451 | -43013.1 | 2.107 | -17.442 |
| a=(eV); b=(Debye) |
2.1.3. Chemical reactivity descriptors and total density of state (TDOS)
Koopman's theorem was utilized to compute the electronic properties of the targeted nicotinamide derivative through various global reactivity parameters, including “ionization potential (IP), electron affinity (EA), chemical potential (µ), electrophilicity (ω), energy change due to charge transfer (∆E), chemical hardness (η), maximal charge acceptance (Nmax), chemical electronegativity (χ) and global softness (δ)”. Table 1 demonstrates that the calculated parameters have a high (σ), low (ω), and (η), indicating a high bio-reactivity. The amount of (ω), (µ), (σ) and (η) influences the compound's efficiency to gain an additional charge ∆Nmax from a neighboring chemical system or target [27]. The high inhibitory reactivity of the prepared medication was thus caused by the ease with which additional charge could be obtained and the low Egap. When a compound is in an equilibrium state, "the number of occupied states per unit volume" can all be estimated by multiplying the probability function by the density, and the findings can be used to examine various properties of the molecule. Figure 5 shows the spectrum of the total density of all states and the largest density was detected in the empty orbitals, according to the TDOS spectrum.
2.1.4. Electrostatic potential maps (ESP)
Among the key factors affecting the binding of molecules to proteins is electrostatic attraction. Calculating the energy of the protein-drug complex is possible through a quantitative study of these attraction forces. The primary driving factors in biomolecules are steric and electrostatic forces.
The ESP surface contains a variety of colored patches depending on the amount of electron density present. Atoms having partial negative charges (atoms that are highly electronegative) appear in red color and can serve as hydrogen-bonded acceptors, whereas atoms with partial positive charges and low electronegativity show in blue color and can serve as hydrogen-bonded donors. The color of neutral atoms, which have no charge, ranges from green to yellow, and they produce π- as well as other types of staking interactions. Such colored areas make it easier to predict how they will interact with the target and comprehend how reactions work. The targeted nicotinamide derivative structure showed blue and red areas, indicating a high likelihood of forming a hydrogen bond with the protein target. The blue regions at all hydrogens could operate as hydrogen-bonded (H-bond) donors, while the red patches at the oxygen atoms can form H-bonds with polar amino acids. The phenyl rings' clouds, which are mostly greenish in hue, facilitate the formation of π staking bonds with aromatic amino acids (Fig. 6).
2.2. Molecular Docking Simulations
Utilizing MOE software, molecular docking simulations were carried out to look into the potential binding pattern of the targeted nicotinamide derivative in the active site of VEGFR-2. The target enzyme used in the docking simulation carries PDB ID of 2OH4, a crystal structure of VEGFR-2 known for its high quality. The way that sorafenib bound to the VEGFR-2 active site cavity was consistent with what had previously been observed [9, 12, 28, 29]. It resides in the receptor's major structural components, including the hinge region (H-bond with Cys917) and the DFG-motif region (H-bonds with Glu883 and Asp1044). Furthermore, it created two networks of hydrophobic boundaries in the linker region and the terminal hydrophobic regions (Fig. 7).
The targeted nicotinamide derivative was examined for its binding against the ATP binding pocket of VEGFR-2. It was found that the pyridine moiety of a such compound had the aptitude to occupy the hinge region forming H-bond with the crucial amino acid Cys917. In addition, the central phenyl moiety (PhI) occupied the linker region to form hydrophobic interactions with Ala864, Val914, and Val846. Furthermore, the amide I group of the targeted nicotinamide derivative is capable of forming two H-bonds in the DFG motif region with Glu883 and Asp1044. Finally, the targeted nicotinamide derivative fits the hydrophobic region impeccably and interacted its hydrophobic mainstay (Ile886 and Leu887) through the second phenyl moiety (PhII) (Fig. 8). These results provided an explanation for the potent VEGFR-2 inhibitory activities of the designed candidate.
2.3. MD simulations
The production run's analysis shows that the system behaves steadily. The apo VEGFR-2 protein (blue curve) and the holo VEGFR-2 protein (red curve) have averages with values around 2.7 Å on the RMSD plot calculated using all alpha carbon atoms (Fig. 9A). On the other hand, the RMSD of the ligand displays a very stable variation with an average of 1.1 Å (Fig. 9B). There are comparable patterns in both the RoG (Fig. 9C) and SASA (Fig. 9D). The averages for the two measures are consistently 20.5 Å and 17500 Å2, respectively for both systems. H-bonds are depicted in Fig. 9E with a consistent variation and an average of 70 bonds for both systems. Except for the free N-terminal (11.7 Å for the holo protein), Tyr994:Asp996 loop of the apo system (2.5 Å), the Gly1046:Leu1065 loop of the apo system (6.6 Å), Lys1053:Asp1062 (4 Å), and the C-terminal (10.3 Å for the apo protein and 8.5 Å for the holo protein), the amino acids show very little fluctuations (less than 2 Å) in the RMSF plot (Fig. 9F). The ligand maintained an average distance from the protein center of mass of 7.2 Å throughout the simulation. Overall, the binding of the ligand to the protein is stable (Fig. 9G).
2.4. MM-GBSA analysis
The binding free energy study using MM-GBSA between the targeted nicotinamide derivative and VEGFR-2 shows the various components that contribute to the binding (Fig. 10). The typical van der Waals and electrostatic interactions for the targeted nicotinamide derivative are roughly − 58.85 Kcal/Mol and − 27.94 Kcal/Mol, respectively, with the total average binding being − 43.73 Kcal/Mol. The decomposition analysis of Fig. 11 identifies the amino acids that are closest to the ligand and have the greatest impact on the interaction. A value larger (lesser) than − 1 Kcal/Mol is contributed by the following amino acids: Ile886 (-1.02 Kcal/Mol), Val897 (-1.43 Kcal/Mol), Phe916 (-1.69 Kcal/Mol), Cys917 (-2.02 Kcal/Mol), Cys1022 (-2.15 Kcal/Mol), Ile1023 (-2.44 Kcal/Mol), Leu1033 (-1.36 Kcal/Mol), Cys1043 (-4.61 Kcal/Mol) and Asp1044 (-1.12 Kcal/Mol).
2.5. PLIP analysis
After that, the trajectory was clustered to produce a frame that represented each cluster. According to the methods section, the elbow approach was used to automatically choose the number of clusters, and this produced four clusters. The amount and types of interactions between the targeted nicotinamide derivative and VEGFR-2 for each cluster representative were determined using the PLIP website (Table 2). The hydrophobic interaction is the most frequent among all cluster representatives, accounting for 34 interactions, as opposed to the 16 H-bonds. The discrepancy between the electrostatic and van der Waals energy levels derived from the MM-GBSA is consistent with this. While Cys917, Ile1023, and Asp1044 are the most common amino acid (AA) creating an H-bond in all cluster representatives, Leu838, Val897, Ile1023, Leu1033, and Asp1044 are the most occurring amino acids forming hydrophobic contacts in all of the four cluster representatives. In addition to producing the interaction types and numbers from PLIP, it also generates a .pse file to see the 3D conformation of the ligand and its interaction with the protein (Fig. 12).
Table 2
PLIP analysis (bonds’ numbers and types) of the targeted nicotinamide derivative in the VEGFR-2 protein for each cluster representative. Bold amino acids are the common amino acids in all cluster representatives.
| Cluster No | H-B | AA | H-I | AA | |
|---|
| C1 | 3 | Cys917 - Ile1023 - Asp1044 | 10 | Leu838 (2) - Ile886 - Val897 (2) - Val914 - Leu1017 - Ile1023 - Leu1033 - Asp1044 |
| C2 | 3 | Cys917 - Ile1023 - Asp1044 | 7 | Leu838 - Val897 (2) - Val914 - Ile1023 - Leu1033 - Asp1044 |
| C3 | 6 | Glu915 - Cys917 - Ile1023 (2) - Asp1044 (2) | 7 | Leu838 - Val897 (2) - Val914 - Ile1023 - Leu1033 - Asp1044 |
| C4 | 4 | Cys917 - Ile1023 (2) - Asp1044 | 10 | Leu838 - Ala864 - Ile886 - Ile890 - Val897 (2) - Leu1017 - Ile1023 - Leu1033 - Asp1044 |
The origin of the trajectory's highly synchronized motion was determined using principal component analysis. The scree plot, eigenvector distribution, and variance maintained with additional eigenvectors were all used as criteria to select the essential subspace, as detailed in the methods section. By looking at the scree plot, we can see that the slope flattens down considerably after the second PC. Furthermore, the top three eigenvectors kept almost 78.5% of the total variance, whereas the first eigenvector alone preserved 69.2% of the variance (Fig. 13). It has shown that the first two eigenvectors do not follow a Gaussian distribution (Fig. 14). Therefore, the reduced subspace was represented by the first three eigenvectors.
To evaluate the randomness of the motion reflected by the first 10 eigenvectors, the cosine content was calculated for both apo and holo VEGFR-2 simulations. The first 10 eigenvectors of both the apo and holo proteins have a cosine content of less than 0.3. (Fig. 15). When comparing the two trajectories, it is evident that they were sampled differently due to the little amount of overlap between the first three eigenvectors (1.8% according to the root mean square inner product (RMSIP)). In addition, the RMSIP analysis revealed that the similarity between the apo and holo C matrices was just 13.2%.
The results of projecting each trajectory onto the first three eigenvectors of the new C matrix are shown in Fig. 16–18. Figure 16 (a projection on the first two eigenvectors) demonstrates how the two trajectories have distinct average structures and moderate overlap in their sampling. In Fig. 17, we can see that the two average structures projected onto the first and third eigenvectors have a great deal of similarity, and their trajectories also show substantial overlap. In Fig. 18, we see that the two trajectories overlap similarly to the overlap in Fig. 16 when we project on the second and third eigenvectors. To visualize the motion associated with the first three eigenvectors, porcupine diagrams were generated (Fig. 19). The most prominent motion captured in the first three eigenvectors is from the Gly1046:Leu1065 loop. Each trajectory's first eigenvector describes a unique motion (loop opening for the apo protein (green cartoon) and loop closing for the holo protein (red cartoon)). Similarly to the first PC, the second eigenvector indicates a similar motion. The loop in the apo protein opens in the third eigenvector, as it does in the holo protein.
2.6. In silico ADME analysis
The approval of a new medicine involves evaluating both its pharmacokinetic characteristics and biological activity [30]. To avoid delays or the withdrawal of a drug, it is essential to examine the pharmacokinetic features of a new compound at an early stage of drug discovery [31, 32]. Therefore, Discovery Studio 4.0 computing ADMET parameters were utilized to establish the ADMET parameters for the targeted nicotinamide derivative against sorafenib. Interestingly, the ADMET results of the targeted nicotinamide derivative showed a high degree of similarity to Sorafenib (Fig. 20 and Table 3). Both of them showed a very low capacity to cross the blood-brain barrier (BBB), have good levels of intestinal absorption (L-I-A), do not inhibit CYP2D6, and have a plasma protein binding (L-PPB) ability of more than 90%. Interestingly, the level of aqueous solubility (L-A-S) of the targeted nicotinamide derivative was found to be good (better than sorafenib which was predicted as low).
Table 3
ADMET screening of the targeted nicotinamide derivative
| Comp. | BBB | L-A-S | L-I-A | CYP2D6 | L-PPB |
|---|
| The targeted nicotinamide derivative | Very low | Good | Good | Not an inhibitor | > 90% |
| Sorafenib | low |
2.7. Toxicity studies
The early estimation of toxicity is essential to minimize drug approval failures [33]. However, ethical restrictions, budget constraints, and time wastage in using traditional in vitro and in vivo research methods have given great advantages and led to the use of in silico techniques in toxicity prediction [34]. In this study, the toxicity of the targeted nicotinamide derivative was estimated using nine toxicity models in the Discovery studio program and compared to sorafenib.
The chemical structure of the targeted nicotinamide derivative was subjected to a comprehensive comparison with a large set of previously studied drugs to predict its toxicity and or safety. This analysis involved the calculation of several essential parameters, including probability, enrichment, bayesian score, mahalanobis distance, and mahalanobis distance p-value, for each model. A detailed report containing in-depth information can be found in the supplementary data, providing comprehensive insights into the results of this study. Fortunately, the results showed that the targeted nicotinamide derivative had safe values in all of the models run (Table 4), demonstrating the effectiveness of in silico methods in toxicity prediction.
Table 4
Toxicity study of the targeted nicotinamide derivative
| Toxicity parameters | The targeted nicotinamide derivative | Sorafenib |
|---|
| Ames mutagenicity prediction | Non-Mutagen |
| FDA Rodent Carcinogenicity (Male-rats) | Non-Carcinogen |
| Developmental toxicity | Non toxic | Toxic |
| Carcinogenic Potency TD50 (Rat) | 45.374 mg/kg /day | 14.244 mg/kg /day |
| Rat Maximum Tolerated Feeding Dose | 0.117 g/kg | 0.089 g/kg |
| Rat Oral LD50 | 2.812 g/kg | 0.823 g/kg |
| Rat Chronic LOAEL | 0.336 g/kg | 0.005 g/kg |
| Ocular irritation potential | Mild |
| Skin irritation potential | None irritant |
2.8. Chemistry
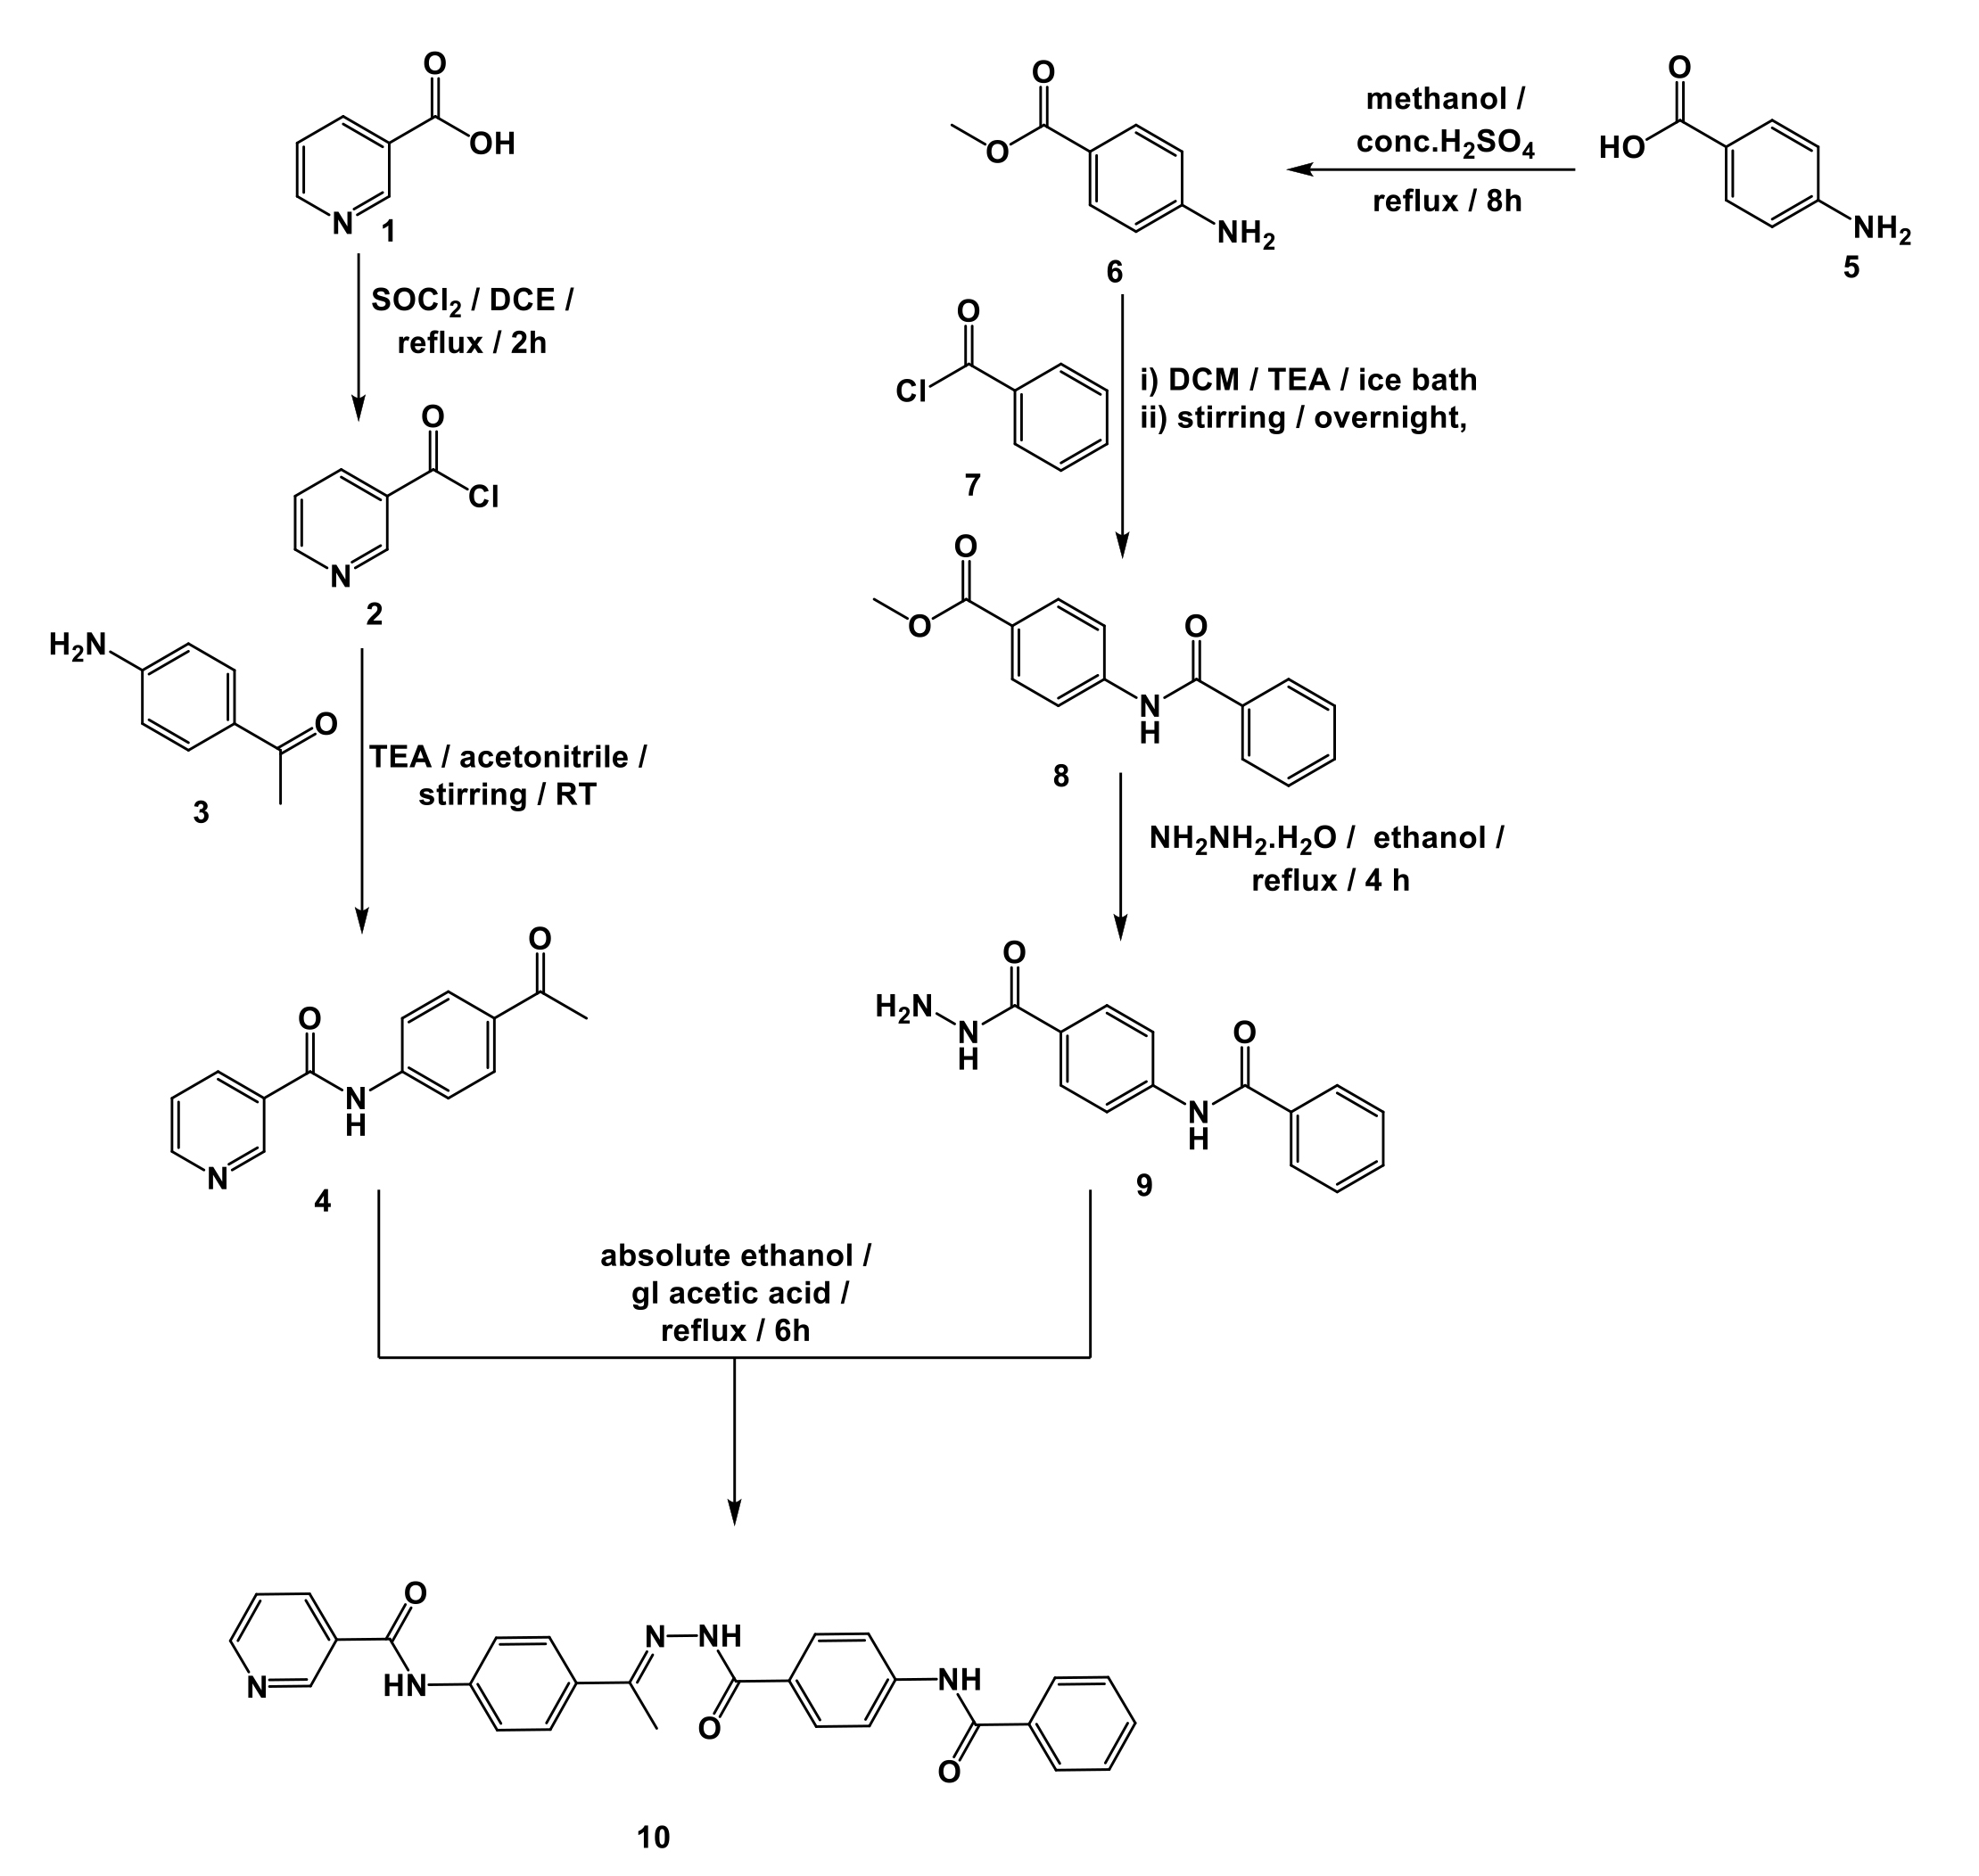
According to our design and the conducted studies, the targeted nicotinamide derivative has a strong aptitude to bind to and inhibit VEGFR-2. The proposed binding aptitude was subsequently supported by several computational investigates. Based on these results, the targeted nicotinamide derivative was synthesized as stated in Scheme 1.
Nicotinoyl chloride 3 was produced by acylation of nicotinic acid 2 with thionyl chloride. The appropriate nicotinamide derivative, 4, was then produced by reacting nicotinoyl chloride 3 with 4-aminoacetophenone. On the other hand, 4-aminobenzoic acid 5 was easily esterified by refluxing it in a solution of methanol and sulfuric acid to create the corresponding ester 6. According to the described procedures, the produced ester, 6, underwent a benzoylation reaction by the drop-by-drop addition of benzoyl chloride, 7, in a DCM/TEA mixture at 0°C to produce the corresponding benzoyl derivative, 8. The corresponding acid hydrazide derivative 9 was created by reacting compound 8 with hydrazine hydrate in pure ethanol [35–38]. The final nicotinamide derivative (compound 10) was formed by condensing compound 9 with compound 4 in ethanol / glacial acetic acid mixture.
The EI-Ms and elemental analysis (More details in the supplementary data) suggested the molecular formula (C28H23N5O3). Then the IR spectrum of compound 10 revealed absorption bands at 1670 cm− 1 for C = O and 3203 cm− 1 for NH. The 1H NMR spectrum showed significant singlet signals for the three amidic protons at δ 10.70, 10.63, and 10.54 ppm (More details in the supplementary data). Moreover, a characteristic singlet signal corresponding to CH3 protons appeared at δ 2.40 ppm. In addition, the 13C further confirmed the chemical structure (More details in the supplementary data).
2.9. Biology
2.9.1 In vitro VEGFR-2 Inhibition
In order to develop an inhibitor for VEGFR-2, which is the main controller of angiogenesis, compound 10 was designed. Compound 10 was then tested in silico and showed promising abilities as an inhibitor. Based on these results, we investigated compound 10's potential to inhibit the VEGFR-2 protein in vitro. It was discovered that compound 10 strongly inhibited VEGFR-2 protein, as evidenced by an IC50 value of 0.1174 ± 0.005 µM, which was compared to sorafenib's IC50 value of 0.0591 ± 0.003. Interestingly, these results were consistent with the promising computational results, demonstrating compound 10's strong potential as a suppressant.
2.9.2. Cytotoxicity and safety
Compound 10 has demonstrated notable potential as an anti-vascular endothelial growth factor receptor-2 (VEGFR-2) agent, both through in silico and in vitro studies, rendering it a promising candidate for cancer therapy. In this study, the cytotoxicity of compound 10 was evaluated in vitro against HepG2 and MCF-7 cancer cell lines, with sorafenib employed as a reference drug. The results exhibited significant anticancer properties of compound 10 against both cell lines, with IC50 values of 35.78 µM and 57.62, respectively. Notably, compound 10 displayed a comparatively high IC50 value of 127.3 µM in vero cell lines, indicating a selectivity index value of 3.5 and 2.2 against HepG2 and MCF-7 cell lines, respectively. These findings suggest the potential use of compound 10 as a selective anticancer agent against the HepG2 and MCF-7 cell lines.
2.9.3. Apoptosis assay
Flow cytometry assay using Annexin V and PI double stains was employed to investigate the apoptotic effects of compound 10 in HepG2 cells (the most sensitive cell lines). Results showed that treatment with compound 10 for 48 hours significantly increased the percentage of HepG2 cells undergoing early (from 0.71–3.63%) and late (from 0.13–11.84%) apoptosis compared to the control. Notably, the percentage of necrotic cells was increased to 4.24%, compared to 2.22% in control cells (Table 5 and Fig. 21). These findings suggest that compound 10 has cytotoxic potentialities that could induce apoptosis and inhibit the cell cycle in HepG2 cells. In conclusion, the study demonstrated the effectiveness of compound 10 in promoting apoptosis and may have important implications for cancer therapy.
Table 5
Effect of compound 10 on stages of the cell death process in HepG2 cells
| Comp. | Apoptosis | Necrosis |
|---|
| Total | Early | Late |
|---|
| Compound 10 | 19.71 | 3.63 | 11.84 | 4.24 |
| Control | 3.06 | 0.71 | 0.13 | 2.22 |
2.9.4. Apoptotic proteins assay
The objective of this study was to investigate the impact of compound 10 on the expression of apoptosis-related proteins, specifically caspase-3 and caspase-9, in HepG2 cells. The experimental approach involved treating the cells with compound 10 and comparing the expression levels of the aforementioned proteins to a control group of untreated cells using quantitative real-time polymerase chain reaction (qRT-PCR). The results demonstrated a significant modulation of these proteins in response to compound 10 treatment, indicating its potential as an apoptotic anti-cancer agent. In particular, compound 10 was observed to upregulate the levels of caspase-3 and caspase-9, which are pivotal enzymatic components involved in the apoptotic pathway. Caspase-3 acts as an initiator caspase, serving as the key trigger for initiating the apoptotic cascade [39]. Conversely, caspase-9 functions as an executioner caspase, operating downstream in the apoptotic signaling pathway [40]. The substantial increase of 2.61-fold in caspase-3 levels and 3.66-fold in caspase-9 levels in compound 10-treated HepG2 cells compared to the control group (Table 6) further supports its potential as a promoter of apoptosis.
Table 6
compound 10’s potentials on apoptotic proteins
| Sample | qRT-PCR (Fold Change) |
|---|
| Casp3 | Casp9 |
|---|
| Compound 10 | 2.61 | 3.66 |
| HepG2 cells | 1 | 1 |
2.9.5. The effect of compound 10 on HepG2’s migration and healing
The evaluation of the migratory and healing potential of cancer cells in vitro can be accomplished through the wound healing (scratch or migration) assay, which is a simple and cost-effective technique [41]. This method involves the creation of a scratch in a monolayer of cancer cells, measuring the initial scratch width, and monitoring the scratch closure over time for both treated and untreated cells. In this study, images of the scratch area for treated and untreated HepG2 cell lines were captured at 0 and 48 h. Results from the scratch assay (Table 6 and Fig. 22) showed that the untreated HepG2 cells had significantly closed the scratch by 65.9% after 48 h. However, treatment with compound 10 resulted in only a 2% reduction (closure) in scratch width, indicating that the treatment had a significant inhibitory effect on the migration and healing ability of cancer cells. These findings suggest that compound 10 may be a promising therapeutic agent for inhibiting cancer cell migration and warrant further investigation of its potential clinical applications.
Table 7
The effect of compound 10 on HepG2’s migration and healing after 48 h
| Item | at 0h | at 48 h | RM um | Wound closure % um2 | Area difference % |
|---|
| area | width | area | width |
|---|
| Controla | 1000.343 | 999.3863 | 340.6 | 339.5395 | 13.74691 | 65.96145 | 659.8343 |
| Compound 10a | 994.3333 | 993.3902 | 967.5 | 966.551 | 0.559149 | 2.698626 | 26.83343 |
| a Data are presented as a mean of five times values |