3.1 Characterization
As shown in Fig. 1, the microscopic morphology of CSC, ZVI-CSC before and after adsorption was analyzed by scanning electron microscope (SEM). Irregularly shaped biomass is transformed into laminar structures with porous surfaces and hematite is transformed into aggregated mineral particles. Clusters of fine iron particles can be observed ranging in size from 40 to 80 nm on the surface of ZVI-CSC(Zhou et al. 2014), indicating that the nZVI particles were uniformly loaded to the surface of the biochar. However, these particles were not found on the surface of CSC. Moreover, based on SEM mapping, iron can be oberved on the surface of biochars, further demonstrating the successful loading of nZVI particles.
Specific surface area and pore structure of CS, CSC, and ZVI-CSC were listed in Table 1. Compared to CSC and ZVI-CSC, the specific surface area of ZVI-CSC was significantly increased to 44.24 m2·g− 1, which may be due to the enhanced dispersion of ZVI particles on the porous and rough surface of biochar(Devi &Saroha 2014). More available adsorption sites were thus formed onto ZVI-CSC, resulting in higher adsorption capacity of heavy metals(Zou et al. 2022). The pore size distribution curves in Fig.S2 also confirmed that ZVI-CSC have significantly higher surface area and pore volume compared to CSC. The improved pore structures directly affected the diffusion rate of heavy metals from the surface of biochar to its internal pore structure(Ahmad et al. 2014), enhancing the reaction between As(V) and Cd(II) and ZVI-CSC.
Table 1
Specific surface area and pore structure parameters of CS, CSC, and ZVI-CSC
|
Sample
|
Specific surface area
|
Average pore diameter
|
Pore volume
|
| |
m2/g
|
nm
|
mm3/g
|
|
CS
|
1.23
|
7.049
|
2
|
|
CSC
|
4.97
|
8.068
|
4
|
|
ZVI-CSC
|
44.24
|
8.068
|
32
|
XRD analysis of hematite, CSC, and ZVI-CSC was performed, and the results are shown in Fig. 2(a). The diffraction peak at 26.6° indicated the presence of SiO2 in hematite and biochar(Huang et al. 2020), which can act as a carrier for ZVI and promote the oxidation of Fe0 to provide electrons(Cai et al. 2021). The diffraction peaks at 33.16°, 33.6°, 40.8°, 49.56°, 62.54°, 63.96° correspond to Fe2O3 for hematite. The diffraction peaks at 44.64° and 64.94° for ZVI-CSC correspond to Fe0 peaks, indicating the successful loading of ZVI onto biochar. Moreover, it is noteworthy that the diffraction peak observed at 44.64° exhibits a higher, narrower and sharper peak compared to the others, indicating that the Fe0 crystallinity was increased after loaded onto biochar. According to previous studies, nano SiO2 was found to increase Fe0 crystallinity(Qian et al. 2019, Su et al. 2016), Therefore, the Fe0 crystallinity caused by biochar is mainly attributed to the generation of SiO2 from biochar.
FTIR spectroscopy of CSC and ZVI-CSC before and after adsorption was given in Fig. 2(b). The peaks near 3419 cm− 1, 1605 cm− 1, 1100 cm− 1, and 793 cm− 1 were attributed to -OH stretching vibrations, C = C double bond symmetric stretching vibrations, C-O stretching vibration, and aromatic C-H out-of-plane bending vibration, respectively. For ZVI-CSC, the signal at 563.42 cm− 1 was observed, indicates that ZVI has been successfully loaded onto the biochar and produced chemical bonding between the biochar and Fe, and the type of the formed bond could be Fe-O(Su et al. 2016). For ZVI-CSC after adsorption, the peak at 796 cm− 1 was replaced by As(III)-O after adsorption, proving that As was immobilized.
Raman spectroscopy is sensitive to carbon state (Guizani et al. 2017, Tsaneva et al. 2014) and is used to analyze the structure of biochar(Zhang et al. 2018). Raman spectra of CSC and ZVI-CSC were shown in Fig. 2(c). Defective (D)-bands (~ 1347 cm-1) and graphitic (G)-bands (~ 1597 cm-1) were observed, indicating that the biochar has a distinct graphene-like structure(Cheng et al. 2020). The intensity ratio of peak D and G (ID/IG ratio) indicates the degree of graphitization(Sevilla et al. 2017). The ID/IG value of ZVI-CSC was higher than that of CSC, indicating that the graphitization of ZVI-CSC was higher than that of CSC. This may be due to the loading of ZVI increased the degree of defects in biochar. The ID/IG ratio of composites prepared by co-pyrolysis of magnetite preloading or Fe3+ impregnated biomass showed a similar trend(El-Azazy et al. 2021).
The XPS spectra of CSC and ZVI-CSC were illustrated in Fig. 2(d). Based on Fig. 2(d), peaks of C 1s (~ 285 eV), O 1s (~ 532 eV), and Fe 2p (712 eV) can be detected in ZVI-CSC, indicating Fe was successfully loaded onto biochar. Moreover, As 3d can also be observed in CSC and ZVI-CSC after adsorption. The spectra of C 1s, O 1s and As 3d were given in Fig.S3. For O 1s spectra, it can be found that compared with CSC, new peaks at 530.3 eV and 531.3 eV can be observed for ZVI-CSC, which belong to inorganic oxygen Fe-O and adsorbed oxygen, respectively. This also indicated that the Fe was successfully loaded onto ZVI-CSC. For As 3d spectra, main spectral peaks were found to belong to As(V), As(III) and As(0), respectively. For CSC, As(III) was the main form of As. However, for ZVI-CSC, As(V) was the main form of As.
3.2 Kinetic analysis
Pseudo-first-order model (PFO) and pseudo-second-order model (PSO) were used in this study for kinetic analysis of As(Ⅴ) and Cd(Ⅱ) adsorption by CSC and ZVI-CSC(Chen et al. 2022, Feng et al. 2021, Suazo-Hernández et al. 2019). Intraparticle diffusion model (IPD)(Cao et al. 2023a, Kypritidou et al. 2022) was also used for mechanism analysis. The specific formulas were given in Text S1. The results of kinetics and intraparticle diffusion model were shown in Fig. 3. The fitting parameters for the kinetic models were illustrated in Table S1. Based on Fig. 3 and Table S1, the adsorption of As(Ⅴ) and Cd(Ⅱ) was more consistent with the pseudo-second-order model. Thus, it can be inferred that the control of adsorption rate of As(Ⅴ) and Cd(Ⅱ) mainly depends on chemisorption. For As(Ⅴ) adsorption, when pH = 3, the maximum adsorption of As(Ⅴ) by ZVI-CSC was 14.42 g·kg− 1, which was 2.1 times that of CSC. When pH = 6, the maximum adsorption of As(Ⅴ) by ZVI-CSC was 4.1 g·kg− 1. Compared to CSC, the As(Ⅴ) adsorption capacity of ZVI-CSC was significantly improved, especially at lower pH. For Cd(Ⅱ) adsorption, the adsorption capacity of CSC and ZVI-CSC was similar, in the range of 2 to 4 g·kg − 1. The Cd(Ⅱ) adsorption capacity of ZVI-CSC was better when pH = 3, however it was better for CSC when pH = 6.
To better understand the adsorption process of As(Ⅴ) and Cd(Ⅱ) from solution to ZVI-CSC, the adsorption data were further plotted using an intraparticle diffusion model as shown in Fig. 3. The curves of As(Ⅴ) and Cd(Ⅱ) can be divided into three phase stages, namely the external diffusion stage (I), the intra-particle diffusion stage (II) and the adsorption equilibrium stage (III)(Gao et al. 2020). The results show that the adsorption of As(Ⅴ) and Cd(Ⅱ) at stage (I) was the most rapid, i.e., the diffusion process in the surface boundary layer of ZVI-CSC was the most rapid. At this stage, there were many adsorption sites on the surface of ZVI-CSC and the concentration of As(Ⅴ) and Cd(Ⅱ) in the solution was relatively high. A greater mass driving force causing rapid adsorption was thus generated(Sewu et al. 2017), so As(Ⅴ) and Cd(Ⅱ) can be quickly diffused and adsorbed to the surface of ZVI-CSC. As the adsorption proceeds, the internal diffusion process within the pores of ZVI-CSC dominated the retention of As(Ⅴ) and Cd(Ⅱ), which was considered as the rate limiting phase with a low rate constant at stage (II). The low rate may be related to the formation of inner layer complex or kinetic inhibition of heavy metals through narrow pore channels(Wang et al. 2015). Moreover, at stage (III), the curve gradually leveled off, indicating that the adsorption sites within ZVI-CSC were already occupied by As(Ⅴ)/Cd(Ⅱ) and the remaining ions were not available for adsorption. That is, the removal of As(Ⅴ) and Cd(Ⅱ) by ZVI-CSC was controlled by both surface adsorption and intraparticle diffusion, and mainly by intraparticle diffusion(Liu et al. 2022).
3.3 Soil leaching
Based on the kinetic analysis, ZVI-CSC showed excellent arsenic adsorption performance. Thus, soil leaching experiments were also carried out to investigate the effect of ZVI-CSC on arsenic migration in soils. Single and cumulative release amount and release rate of As in As(Ⅴ) contaminated soil and As(Ⅴ) & Cd(II) co-contaminated soil after adding CSC and ZVI-CSC were given in Fig. 4. Based on Fig. 4(a), compared to adding CSC, the single release amount of As in both As(Ⅴ) contaminated soil and co-contaminated soil after adding ZVI-CSC was significantly lower, almost zero even for the first leaching. However, the single release amount of As in soils adding CSC was relatively high for the first leaching and it gradually decreased with the increasing leaching times.
Based on Fig. 4(b), the cumulative release amount and release rate of As in soils adding CSC was 15.16 mg·kg− 1 and 32.261%, respectively. However, after adding ZVI-CSC, the cumulative release amount and release rate of As decreased to 1.4639 mg·kg− 1 and 3.1146%, respectively, about one-tenth of the As released when adding CSC. Based on the single and cumulative release amount of As, it can be concluded that the migration of As in soil decreased significantly after adding ZVI-CSC. This is because the immobilization of As was achieved through the complexation between ZVI-CSC and As. Moreover, compared to As(Ⅴ) contaminated soil, the cumulative release amount and release rate of As in As(Ⅴ) and Cd(II) co-contaminated soil were relatively higher, which may due to the competitive adsorption of As(Ⅴ) and Cd(II).
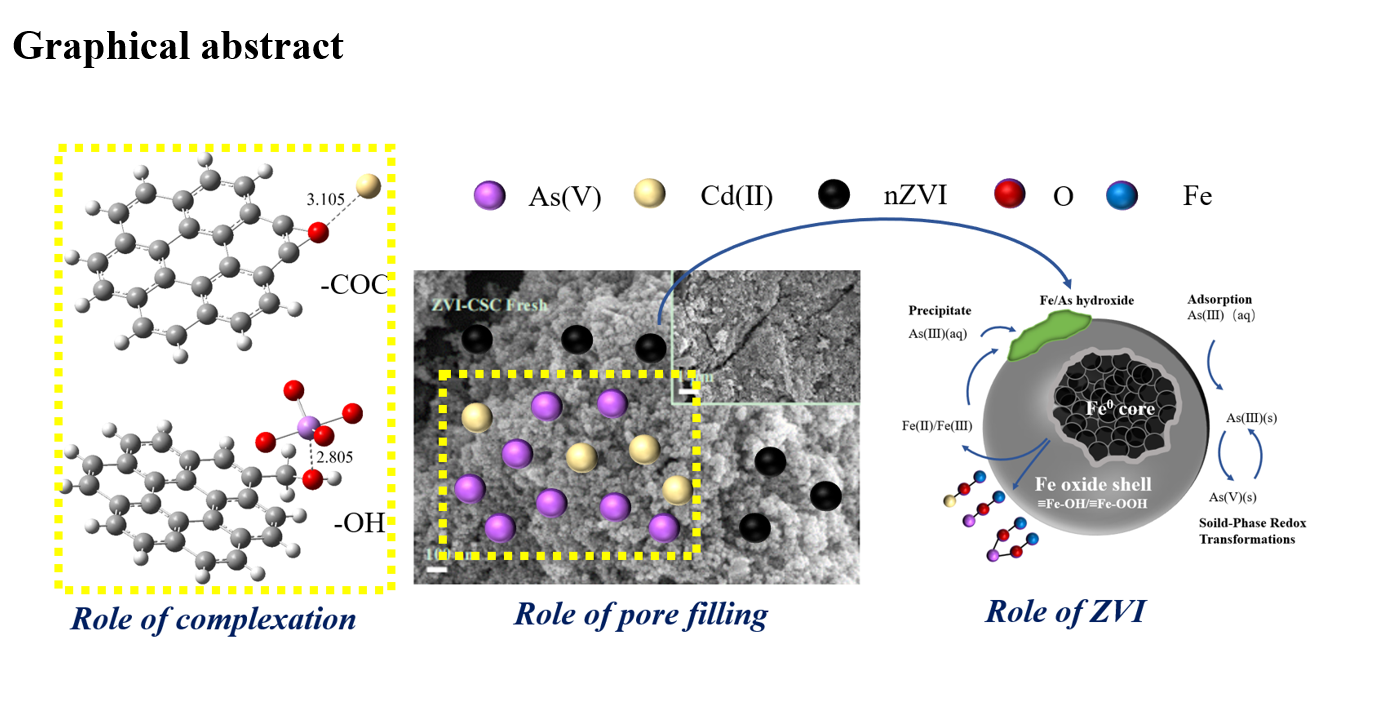
3.4 Role of ZVI in As(V)/Cd(II) remediation
Based on the SEM analysis, nZVI particles were proved to be loaded to the surface of the biochar. Due to its small particle size and high specific surface area, nZVI is easily oxidized by oxygen in the environment, forming a passivation layer on its surface. The main components of the passivation layer were Fe3O4, Fe2O3, and FeOOH, formed by the passivation of highly reactive Fe0 core(Zhang et al. 2011). The presence of the "outer" passivation layer effectively prevents further oxidation of the nZVI inside the passivation layer, but leads to a reduction in the reduction capacity of the nZVI. Thus, nZVI particles have the dual nature of both components, which leads to unconventional chemical behavior, such as the simultaneous oxidation, reduction and adsorption of As(V) as shown in the XPS spectrum of As 3d in Fig.S3.
The high As(V) removal capacity of ZVI-CSC was mainly due to its surface complexation with As. Specific functional groups with affinity for As(V), in particular ≡ Fe-OH and ≡ Fe-OOH, were formed due to the oxidation of nZVI, which can form monodentate and bidentate complexes with As through ligand exchange(Zhang et al. 2010). Moreover, HAsO42− was the main form of As in aqueous solutions, with a partial negative charge on the oxygen atom (-0.895 for HAsO42−) and a partial positive charge on As (+ 1.125) (Kish &Viola 1999, Suazo-Hernández et al. 2019), which favors As adsorption through electrostatic attraction. Furthermore, As(V) can diffuse through the oxide layer or be adsorbed directly on the surface(Sun et al. 2011). Moreover, due to the electrons released by the oxidation of nZVI, analyzed in combination with the XRD and XPS results, As(V) may be reduced to As(III) and subsequently adsorbed or even reduced to As(0) and precipitated(Xu et al. 2021, Yan et al. 2012).
HAsO42−+Fe0 + 7H→As3++Fe2++4 H2O (2)
H2AsO4−+Fe0 + 6H→As3++Fe2++4 H2O (3)
H3AsO4 + Fe0 + 5H→As3++Fe2++4 H2O (4)
For Cd remediation, mineral precipitation, ion exchange, complexation with oxygen-containing functional groups, electrostatic attraction and interaction with π-electrons are considered to be the main adsorption mechanisms of Cd by biochar(Lee et al. 2022, Tian et al. 2023, Wang et al. 2018). For ZVI, the surface charge adsorption or chemotactic adsorption between FeOOH and Cd(II) depends mainly on the presence state of Cd(II) in water. Cd exists mainly as Cd2+ under acidic and neutral conditions. It is difficult to reduce Cd(II) to zero-valent Cd even without the presence of a passivated layer of ZVI. Therefore, for heavy metals such as Cd(II) with its standard electrode potential close to Fe0, the removal effect by nZVI is mainly through the adsorption of the outer passivation layer. Thus, compared to As(V) remediation, the remediation effect of Cd(II) by ZVI was not so good.
3.5 DFT calculation
The role of ZVI in As(V)/Cd(II) remediation has been analyzed. However, the role of biochar itself in As(V)/Cd(II) remediation has not been studied, especially for the electrostatic attraction and surface complexation between As(V)/Cd(II) and the oxygen-containing functional group on biochar. To analyze the mechanism of these two aspects, surface electrostatic potential (ESP) and bond dissociation enthalpy (BDE) analysis of biochar and As(V)/Cd(II) were studied in this paper through DFT calculation. To simplify calculations, the surface model of biochar was simulated using a seven-ring pure graphene structure, which has been effectively applied in previous studies and yielded good findings(Gao et al. 2018, Yang et al. 2022). The surface electrostatic potential (ESP) is the key to study and predict intermolecular interactions and helps to understand the interactions between biochar and heavy metals. Generally, the ability to accept and donate electrons of molecular can be obtained based on ESP, and it is easier to donate electrons at lower ESP(Liu et al. 2022, Zhu et al. 2020).
The ESP of biochars with different oxygen-containing functional group (C = O, C–O–C, –OH and –COOH) and its area percentage were illustrated in Fig. 5, where red indicates negative ESP and blue indicates positive ESP. The aromatic ring region in the middle of biochar appears red and the edge appears blue due to the superposition of π-electron clouds on the surface of biochar. Thus, the outer surface of biochar was positively charged. However, the rich π-bond makes it can also be used as an electron donor(Sun et al. 2023, Zhu et al. 2020). Based on Fig. 5, for biochar with C = O, C–O–C, and –COOH, the lowest ESP appears near the oxygen atom in functional group, indicating that the O atoms have strong electronegativity and changed the ESP of the biochar edge, where electrostatic attraction or complexation with Cd2+ can be formed(Lin et al. 2022). For biochar with C = O, –OH and –COOH, the highest ESP appears near the oxygen-containing functional group, where electrostatic attraction or complexation with AsO43− can be formed. Based on the area percentage analysis, when –OH and –COOH were modified on biochars, the ESP of the whole molecule decreased. Therefore, electrostatic attraction or complexation was more easier to be formed at the site with high ESP near the functional group. However, for biochar with C–O–C, the ESP of biochar increased, which may weaken the interaction with AsO43−(Zhu et al. 2020).
To gain more insight into the structure-property relationship between oxygen-containing functional groups on biochar and As(V)/Cd(II) adsorption characteristics, BDE analysis was used to calculate the binding energy of oxygen-containing functional group in biochar and As(V)/Cd(II)(Chen et al. 2018) as presented in Fig. 6. Based on the binding energy of biochar and As(V)/Cd(II), it can be inferred whether the reaction with oxygen-containing functional groups is likely to occur, and in the form of chemisorption or physisorption(Liu et al. 2022). Generally, if the binding energy is negative, a stable interaction can be formed. If the binding energy is positive, it is unstable. Moreover, the larger the absolute value of binding energy, the stronger the interaction. When the absolute value of binding energy of the reaction is greater than 10 kcal/mol, the reaction is chemisorption.
Based on Fig. 6, for AsO43− adsorption, except for the weak interaction between C–O–C and AsO43−, C = O, –OH and –COOH in biochar were all chemically adsorbed with AsO43−, which can form complexs. The reaction with AsO43− can be listed in order from easy to difficulty: –OH (-140.98kcal/mol) > C = O (-111.46kcal/mol) > –COOH (-60.64kcal/mol). For Cd2+ adsorption, –OH and Cd2+ could not form stable interaction. C = O, C–O–C and –COOH in biochar were all chemically adsorbed with Cd2+. The reaction can be listed in order from easy to difficulty: C–O–C (-111.46 kcal/mol) > C = O (-101.33kcal/mol) > –COOH (-48.88kcal/mol). Thus, it can be concluded that C = O and –COOH can be used to the simultaneous adsorption of As(V) and Cd(II), and the interaction between C = O and As(V)/Cd(II) was stronger. However, –OH and C–O–C showed completely opposite properties on the adsorption of As(V) and Cd(II). –OH is only suitable for As(V) adsorption and C–O–C is only suitable for Cd(II) adsorption.