Participants
In this study, we used data from the EpiHealth study. The study started in 2011 and included a questionnaire and a visit to a test centre located in Malmö or Uppsala, with the aim of studying the connections between lifestyle factors and genetic predisposition contributing to the development of the most common diseases, such as cardiovascular and respiratory (31). The initial sample size was 25,444 participants (aged 45–75 years). In this study, subjects with missing data on weight, height, bioimpedance, or extremely improbable lung function data (with forced expiratory volume in 1 s (FEV1) < 0.8 L or > 7 L and forced vital capacity (FVC) < 1 L or > 9 L) were excluded from the study, resulting in 22,706 remaining for the analysis. The study was approved by the Ethics Committee of Uppsala University (Dnr 2010/402), and all participants provided written informed consent for participation. The study was performed in accordance with the ethical standards of the responsible committee and with the most recent amendment of the Declaration of Helsinki, 1975.
Bioimpedance, body mass index, and waist circumference
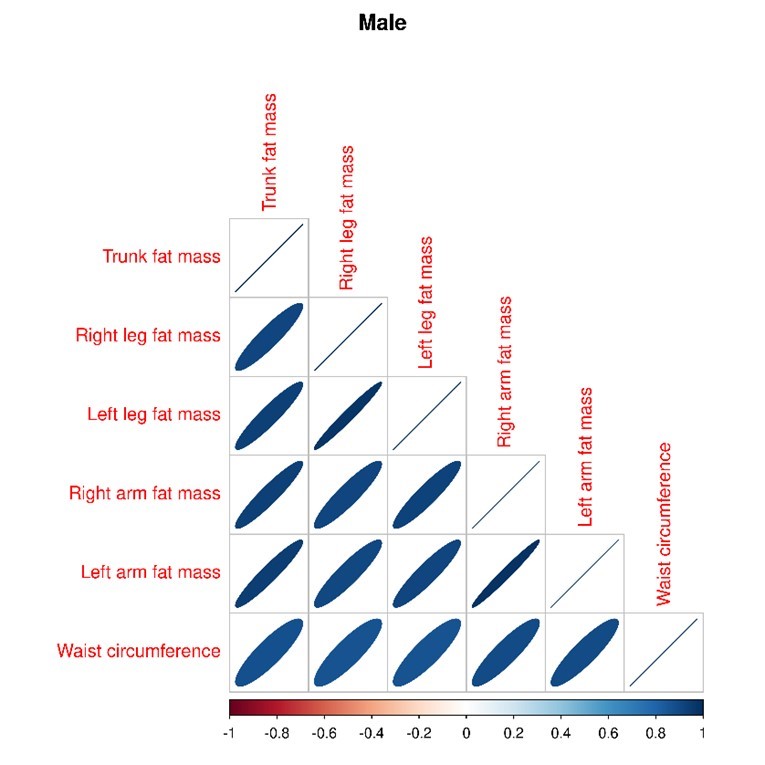
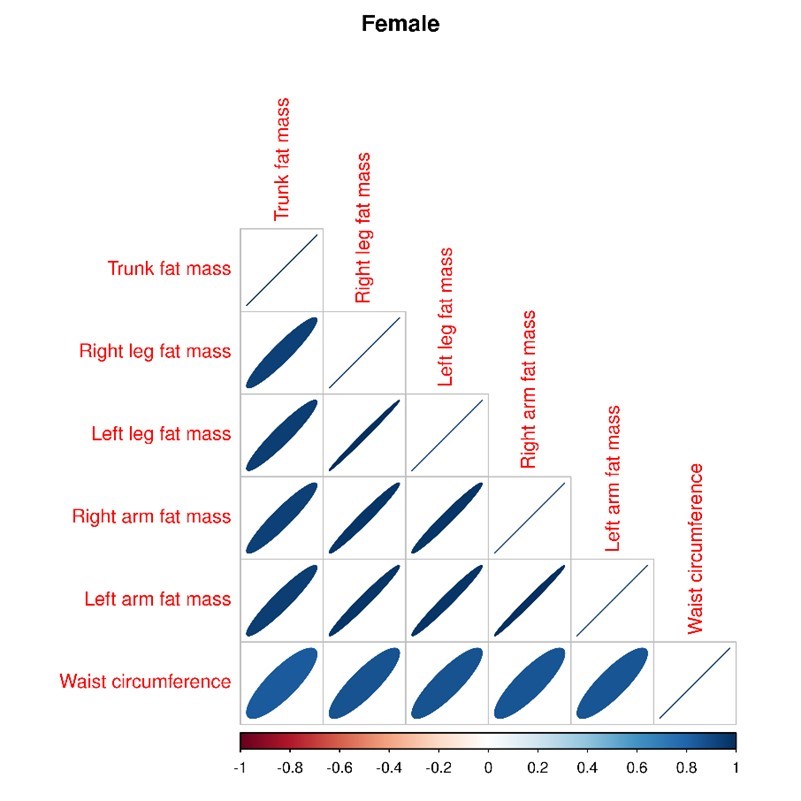
In the Epihealth study, the subjects underwent a series of body measurements, including blood pressure, pulse, height, waist- and hip circumference, weight, BIA, and spirometry. The Tanita BC-418MA segmental body composition analyser was used to measure FM and FFM. The subject stood with electrodes placed in each hand and under the feet to calculate the total body mass, FM, FFM and divided into segments, extremities, and torso FM, FFM separately (31).
Waist circumference was measured with a measuring tape in a standing position and at the end of normal expiration, midway between the lower costal margin and the anterior superior iliac crest.
Lung function
Lung function tests were performed following internationally accepted guidelines using a MiniSpir spirometer (Medical International Research, Waukesha, WI, USA). The subject made at least three and at most nine attempts. Forced vital capacity (FVC) and forced expiratory volume in 1 s (FEV1) were measured; moreover, predicted values and z-scores were calculated using the 2012 Global Lung Function Initiative (GLI) equations (32).
Other lifestyle factors
The lifestyle factors pertaining to smoking habits, physical activity, and educational status from the questionnaire were included in the analysis. Smoking habits were defined as: non-smoker, ex-smoker, or current smoker at the time of the survey. The subject’s physical activity during leisure time was categorised into three groups: low level (sedentary), medium level (physical exercise at least one to two hours per week), or high level of physical activity (strenuous exercise at least three hours per week). The level of education was grouped according to elementary school, upper secondary school, or university.
Statistical analyses
The relationships between fat mass, waist circumference, and lung function were analysed with Weighted Quantile Sum Regression (WQS) (33), which is a method originally developed for analysing exposure to chemical mixtures. Although chemical mixtures and bioimpedance measures may have little in common, the variables resulting from a bioimpedance analysis are highly correlated with each other. This makes the task of distinguishing the effects of the constituent variables very difficult, which makes the WQS method suitable (see S1 and S2).
WQS estimates the association between the outcome and a composite index of percentiles with variable weights determined empirically from the data, possibly adjusting for other covariates, using a generalised linear variable of the function:
\(g\left(\mu \right)={\beta }_{0}+{\beta }_{1} {\sum }_{i = 1}^{c}{w}_{i}{q}_{i} + {z}^{{\prime }}\phi\) subject to \({\sum }_{i = 1}^{c}{w}_{i} = 1\) and \(0\le {w}_{i}\le 1\)
Where \(g\left(.\right)\) is the link function, i.e. the identity link when the outcome variable is continuous, and
\({w}_{i}\) is the variable weight parameter associated with the ith component with percentile values \({q}_{i}\). All exposure variables are grouped into decile groups, so \({\beta }_{1}\)corresponds to an increase in the entire composite variable of 10%.
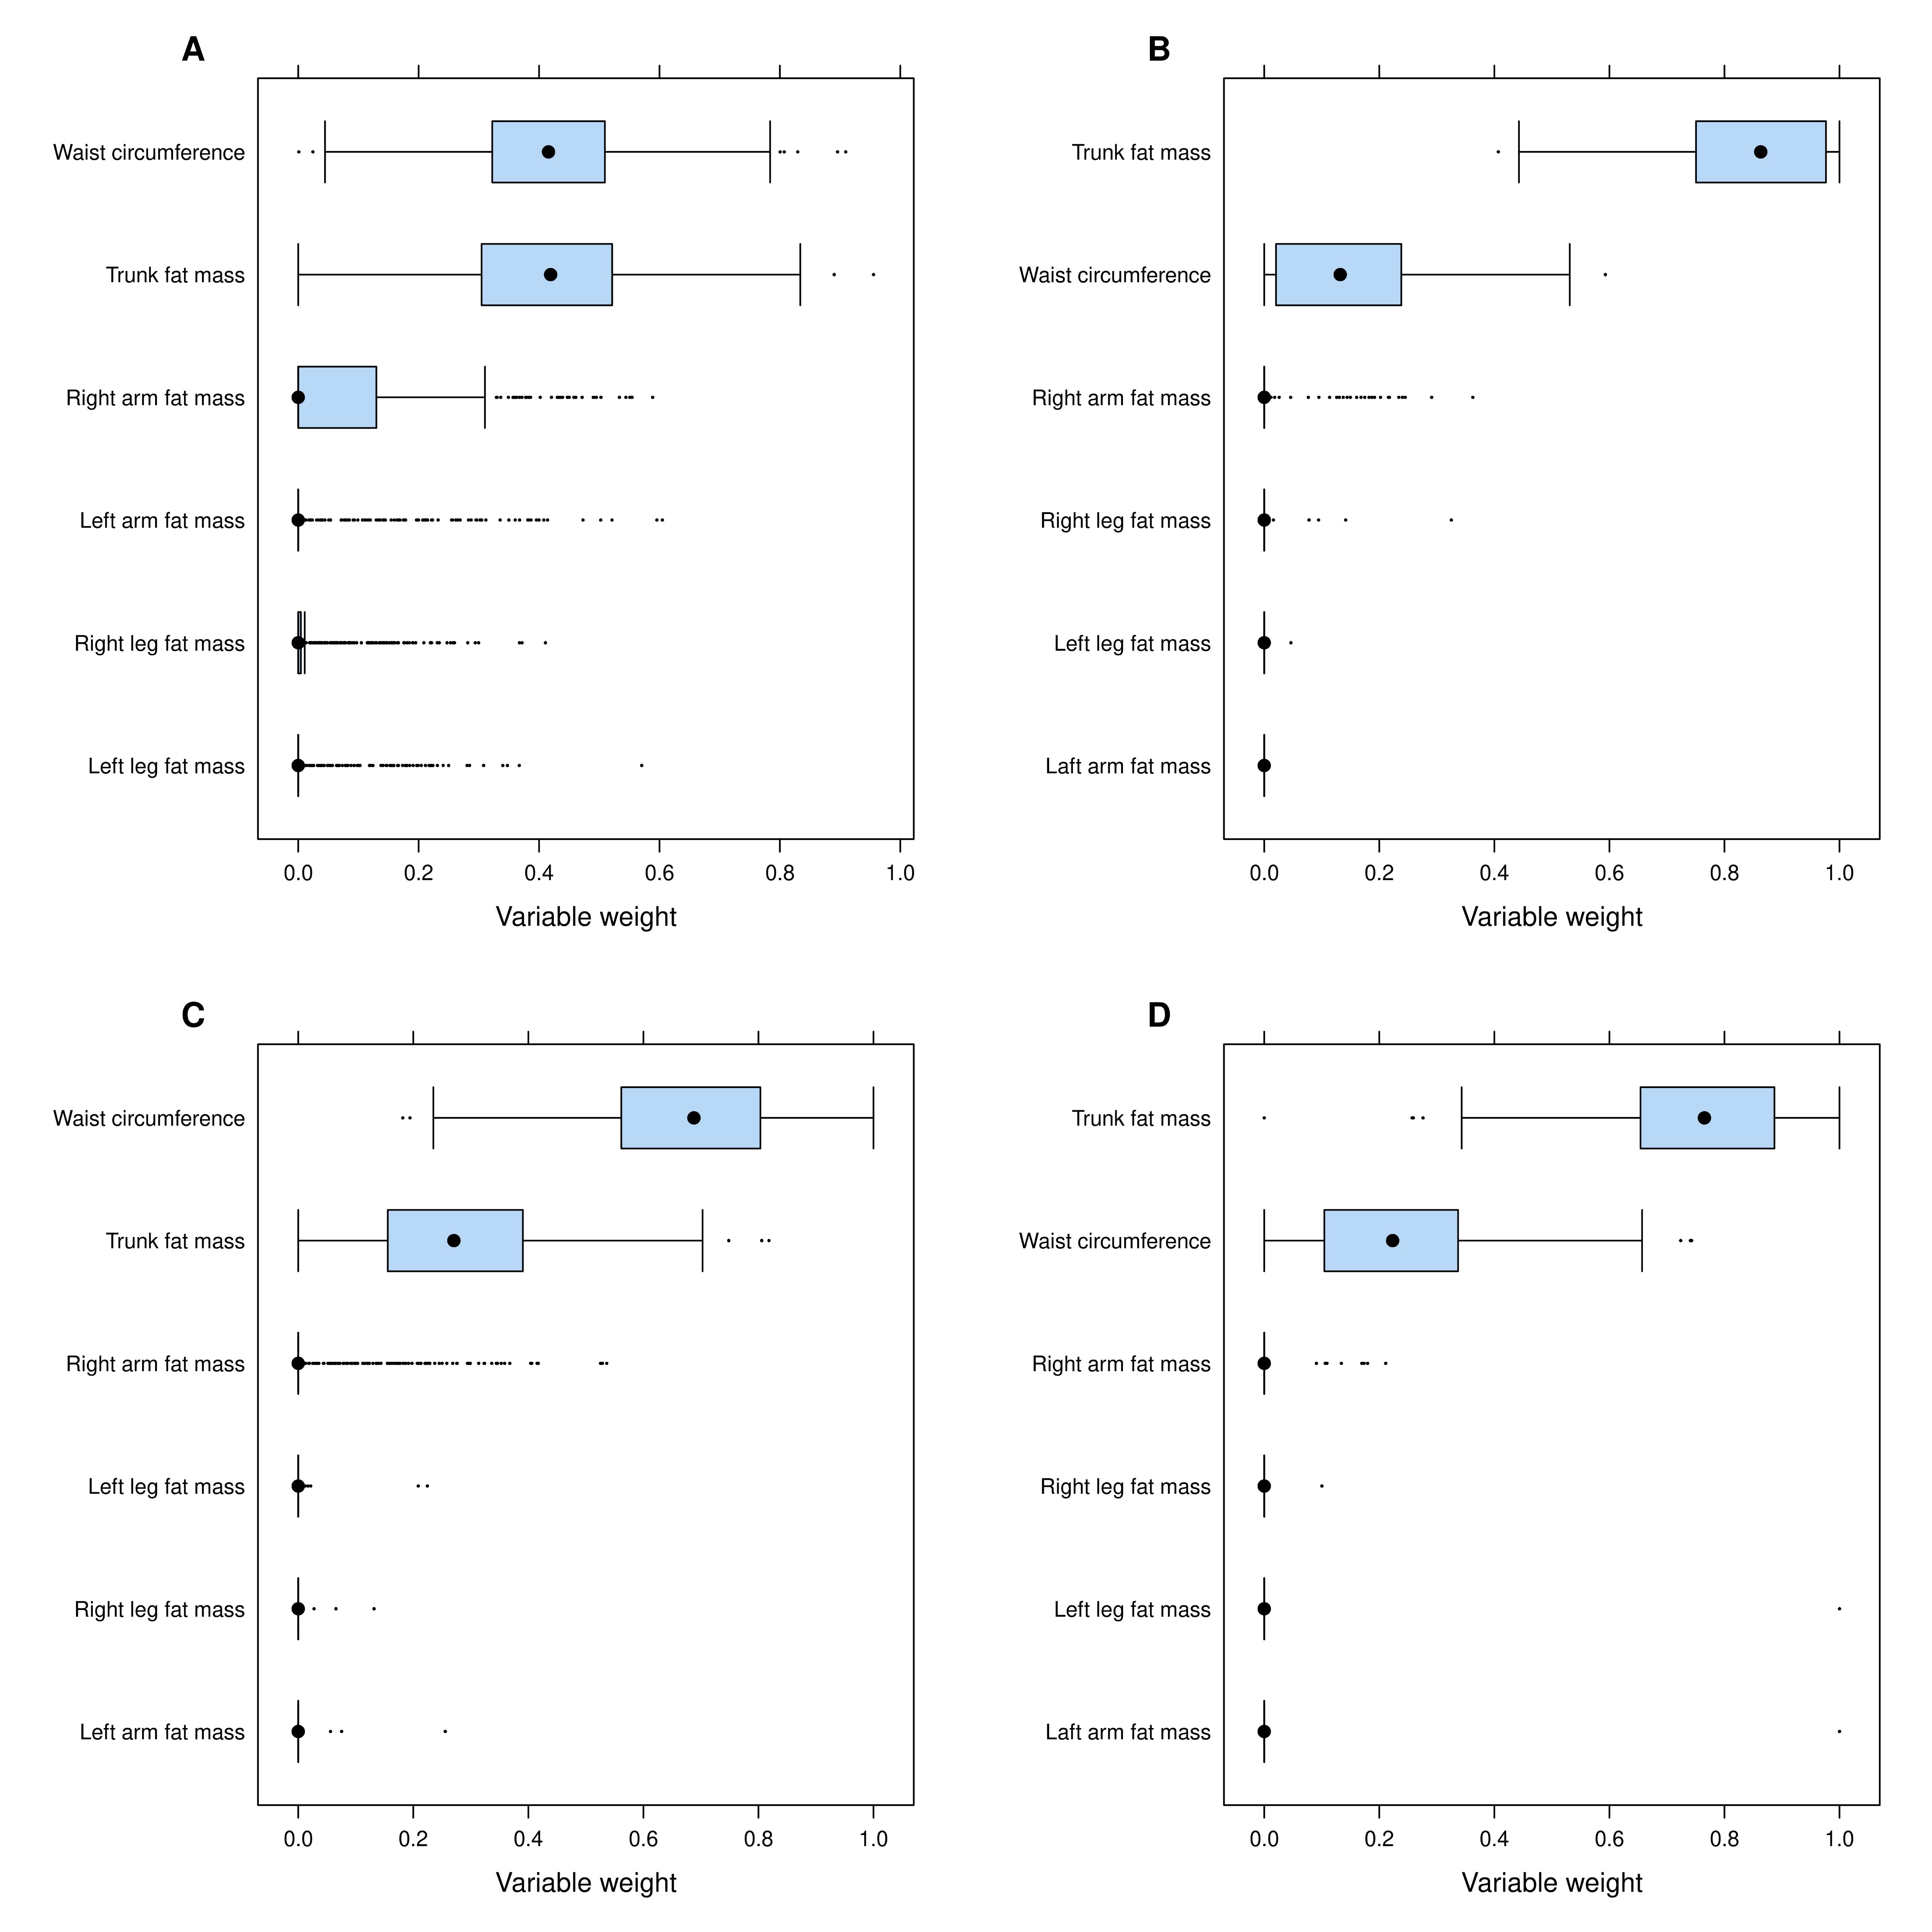
The index variable, henceforth called the BIA/waist index, was formed using all the BIA variables in addition to the waist circumference. Each BIA variable and waist circumference was divided info ten groups according to the sex specific deciles. 40% of the data was used to train the model and optimize the variable weights. Once the variable weights were estimated, the BIA/waist index was formed, and the regression model was fitted in the 60% of the data set aside for testing. For example, if the variable weights for the BIA/waist index was found to be 0.75, 0.20, 0.02, 0.01, 0 and 0 for trunk fat, waist circumference, left and right arm and left and right leg, and the decile group values for those variables for an individual are 5, 6, 3, 3, 2, 2 - the value of the BIA/waist index is calculated as 0.75 * 5 + 0.20 * 6 + 0.02 * 3 + 0.01 * 3 + 0 * 2 + 0 * 2 = 5.04.
The outcomes measured were FVC and FEV1, and other variables in the model were height, weight, age, education, physical activity during free time, and smoking.
All coefficients from the models were scaled with the sex-specific interquartile range (IQR) of the BIA/waist index to enable direct comparisons between men and women, as the coefficients are based on the same relative increase in the exposure.
All analyses were performed using R, a free software for statistical computing and graphics with the gQWS add-on package (34).