Identification of DEGs from Septic Patients
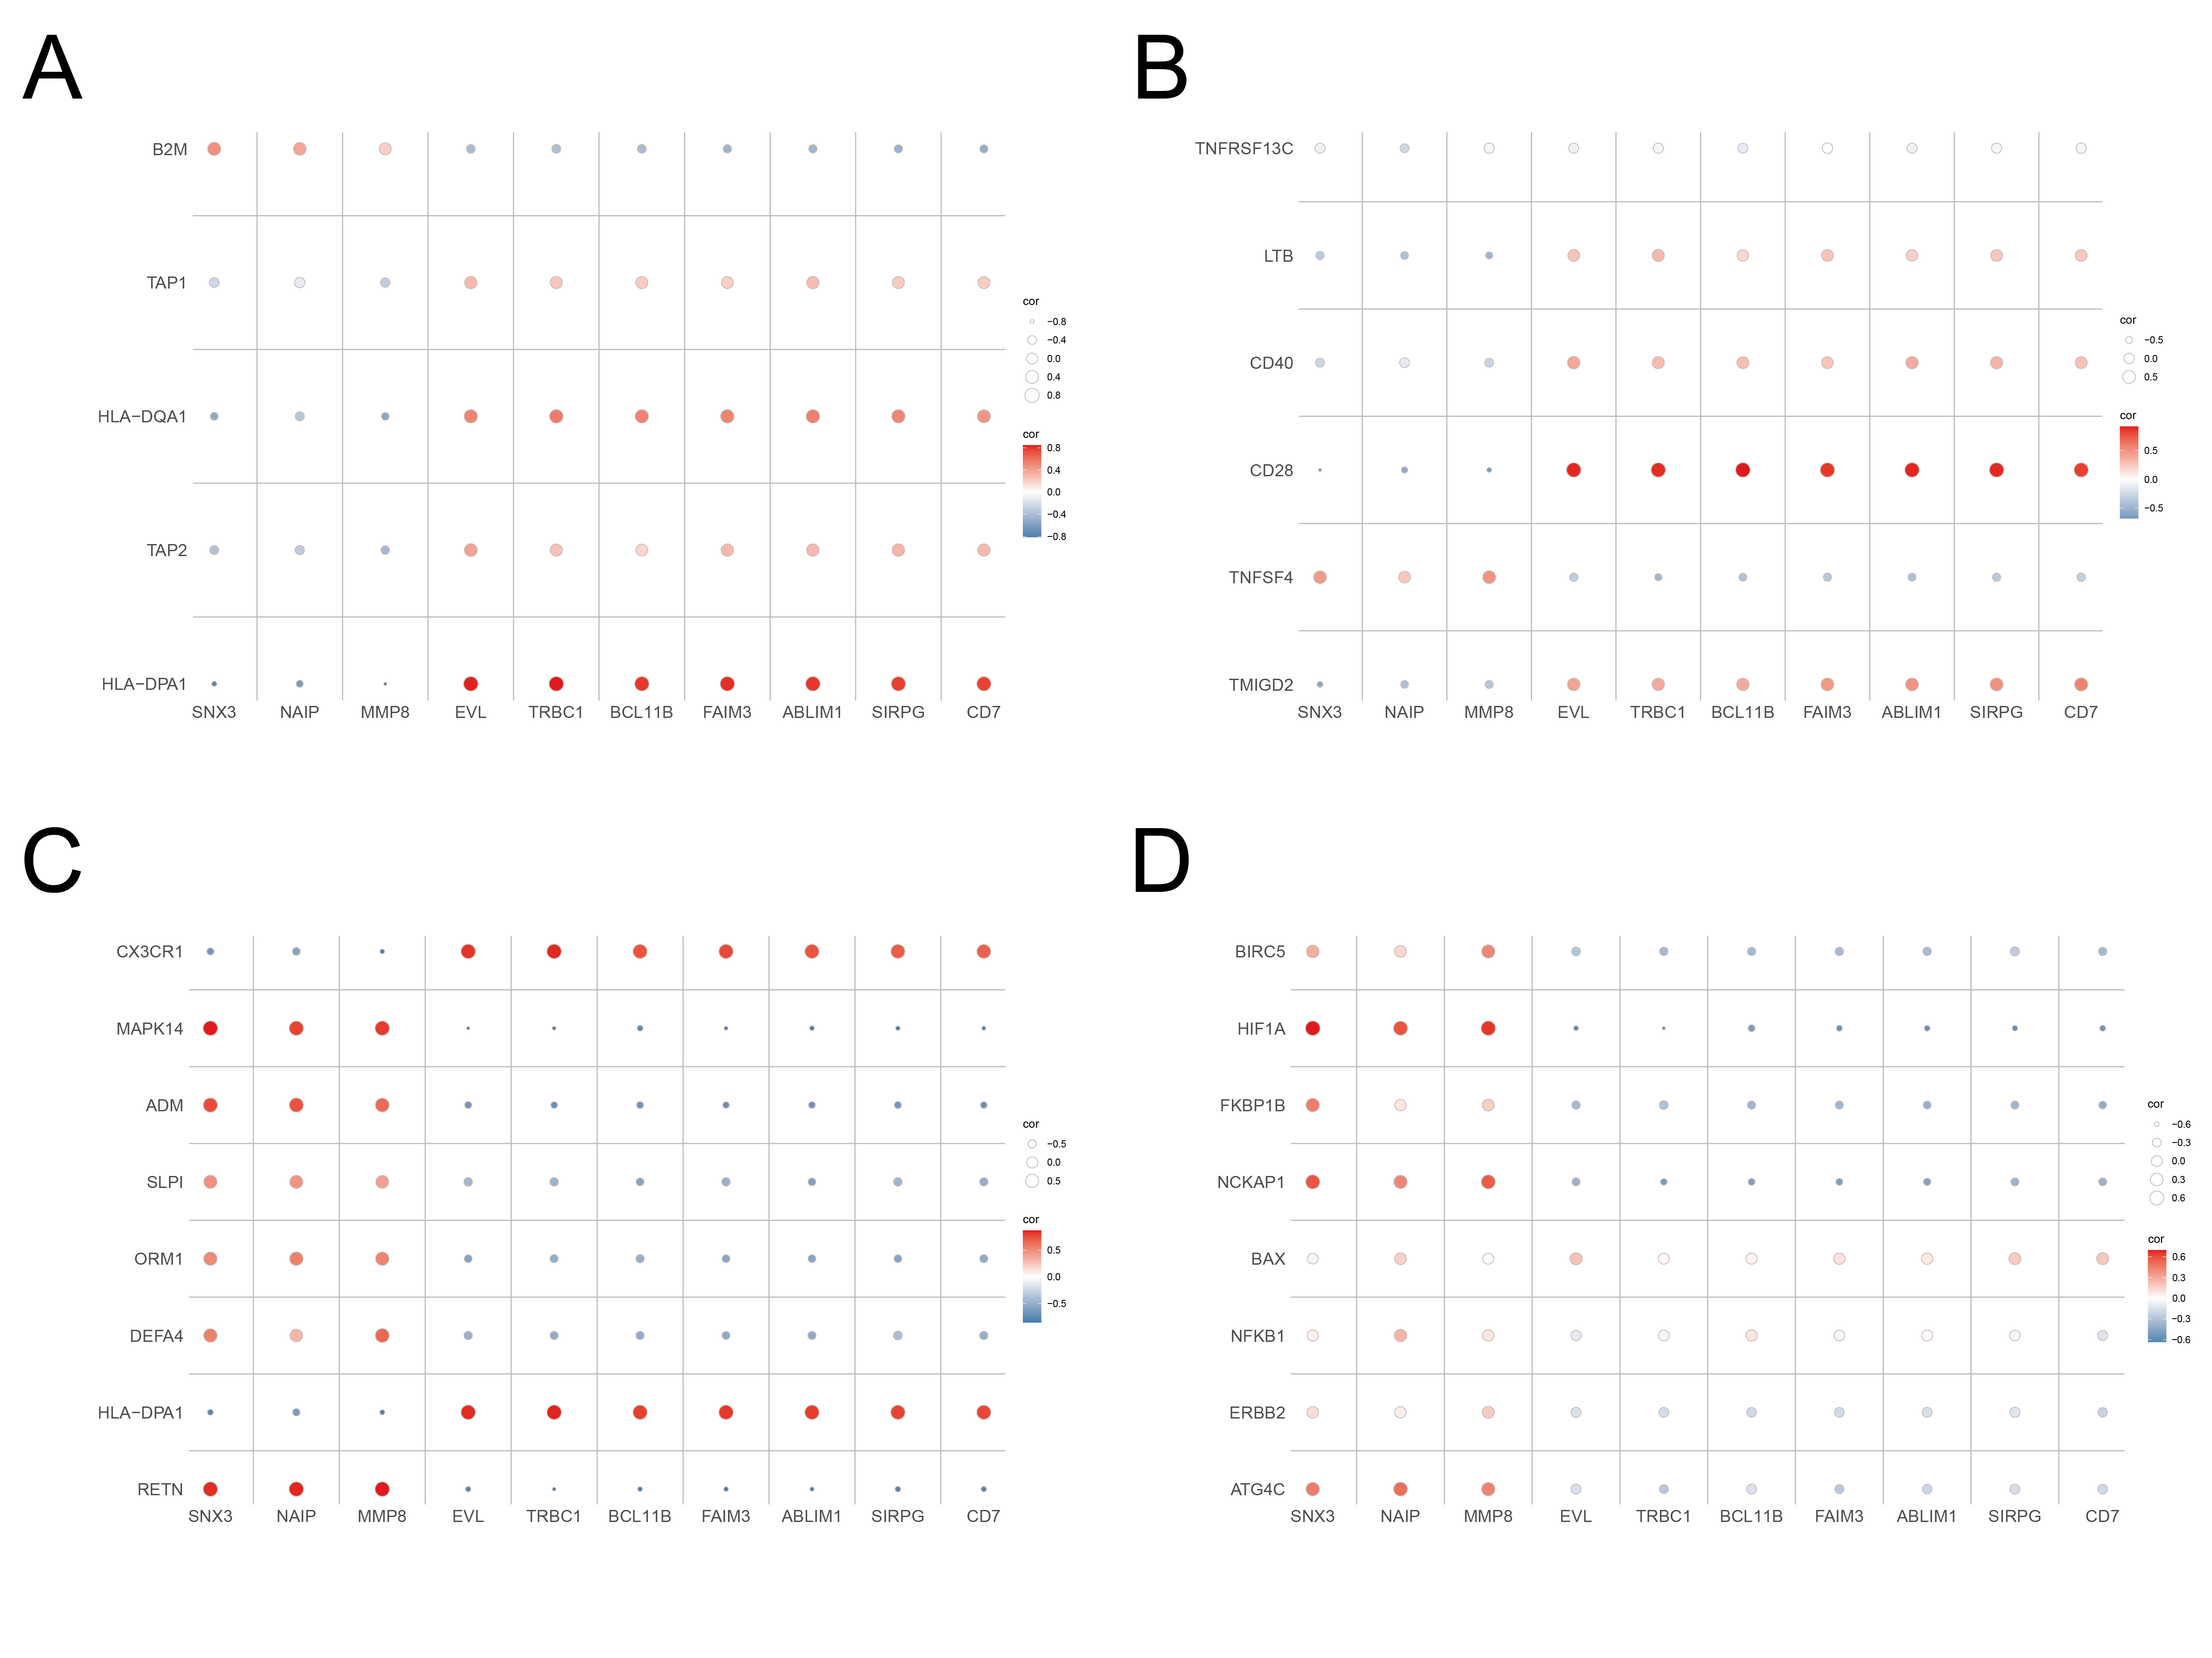
In GSE28750, 372 significant DEGs were screened out, of them, 213 genes were upregulated and 159 were downregulated (Fig. 1A, B). DEGs were displayed using a heatmap and a volcano map, where blue and yellow dots represented up- and down-regulated genes, respectively (Fig. 1A, B and Supplementary Table 1). We have also created a comprehensive flowchart illustrating the entire workflow of our study, which can be found in Supplementary Fig. 1.
GSEA Analysis
Compared with the normal group samples, neutrophil extracellular trap formation (NES = 0.47, FDR = 0.046) and the NOD-like receptor signaling pathway (NES = 0.45, FDR = 0.029) were significantly activated in the septic samples, whereas the T cell receptor signaling pathway (NES = − 0.56, FDR = 0.003) and Th1 and Th2 cell differentiation pathway (NES = − 0.70, FDR = 0.03) were downregulated significantly (Fig. 2A–D). Notably, the downregulation of Th1 and Th2 cell differentiation in the septic group indicated that the progression of sepsis was strongly associated with T cells.
WGCNA Construction
Figure 3A presents the 20 normal samples and 10 sepsis samples included in GSE28750. With the scale-free topology criterion of R2 = 0.85 as the starting point for the transformation, the Pearson correlation matrix between gene clusters was then changed into a reinforced adjacency matrix (Fig. 3B). After combining the modules tightly linked together and employing a clustering height standard of 0.25, 15 modules were finally selected for analysis (Fig. 3C-D). No significant relationship was observed among the modules (Fig. 3E). Module delineation was further validated by investigating the transcriptional correlation between the modules. These investigations revealed that no considerable relationship existed between the modules, confirming that module delineation is valid (Fig. 3F). We also studied the association of ME scores with clinical characteristics. We found that the pale turquoise and salmon modules were positively correlated with the control samples and negatively correlated with the septic samples. By contrast, the saddle brown, dark red, and black modules were negatively correlated with the control samples and positively correlated with the septic samples (Fig. 3G). Modules with clinical utility were found. According to the results, the pale turquoise and salmon, and saddle brown, dark red, and black modules were highly associated with sepsis in the control MM versus GS scatter plot (Fig. 4H, I) and the sepsis MM versus GS scatter plot (Fig. 4J–L), respectively. Genes in these five modules (pale turquoise, salmon, saddle brown, dark red, and black) were used for subsequent analysis.
Functional Analysis of Intersecting Genes
We used the “Venn” diagram to screen the intersecting genes in different WGCNA modules and 368 intersecting genes were eventually discovered (Fig. 4A). According to the results of KEGG enrichment analysis, the intersecting genes mainly function in the process of Th1 and Th2 cell differentiation, hematopoietic cell lineage, the T cell receptor signaling pathway, and antigen processing and presentation (Fig. 4B). Through GO enrichment analysis, we found that the intersecting genes were involved in the positive regulation of leukocyte activation and cell activation, lymphocyte differentiation, specific granules, secretory granule lumina, cytoplasmic vesicle lumina, vesicle lumina synthesis, immune receptor activity, MHC protein complex binding, and protein kinase regulator activity (Fig. 4C). We also established PPI network of the intersecting genes, CD8A, CD4, and CCL5 are confirmed as the core genes (Fig. 4D).
Machine Learning Methods for Detecting Biomarkers in Sepsis
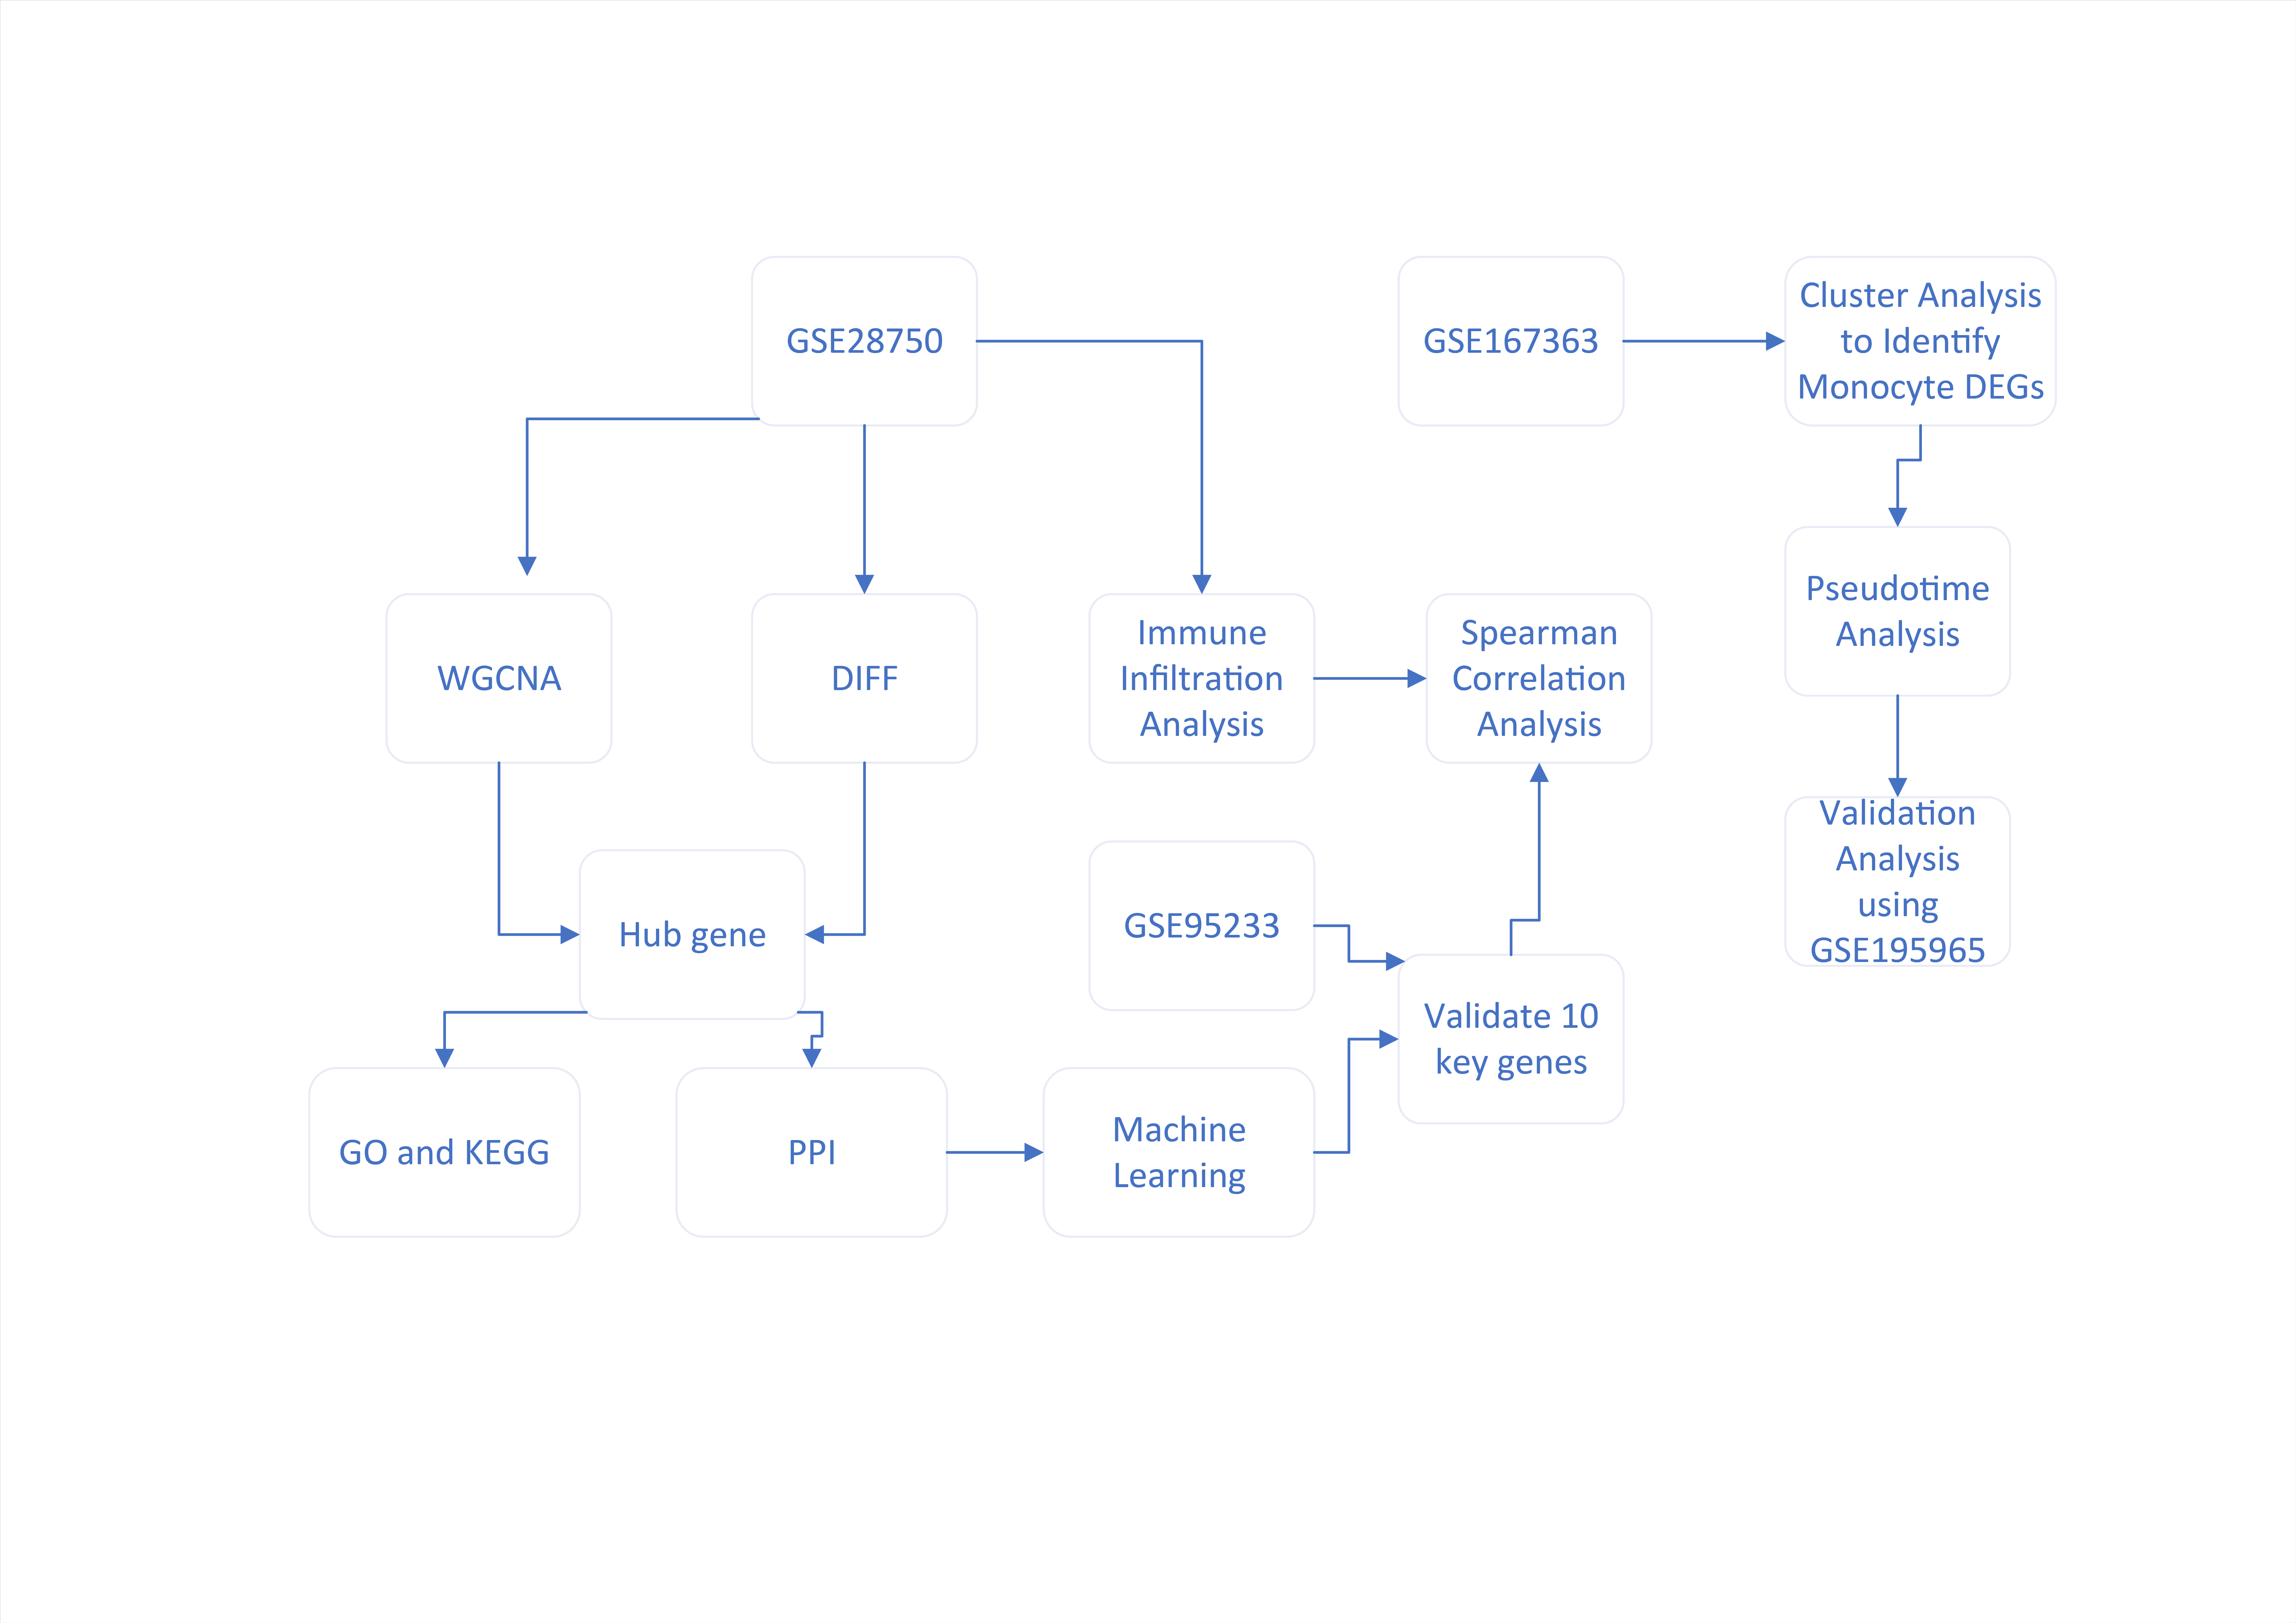
Machine learning methods were applied to further identify the potential biomarkers for sepsis from a total of 368 overlapping genes. Top 20 genes mostly associated with sepsis were determined by combining the random forest algorithm and feature selection (Fig. 5A, B). To ensure the lowest error rate, top 10 genes were eventually selected as candidates. Upregulation of SNX3, NAIP, and MMP8 was observed in the septic samples compared with the control samples. However, EVL, TRBC1, BCL11B, FAIM3, ABLIM1, SIRPG, and CD7 significantly downregulated in the septic samples (Fig. 5C). The diagnostic value of top 10 genes was further validated by receiver operating characteristic (ROC) analysis. The AUC value of all the top 10 genes (namely SNX3, NAIP, MMP8, EVL, TRBC1, BCL11B, FAIM3, ABLIM1, SIRPG, and CD7) was 1 (Fig. 5D–M). Then, we also verified the gene signatures using external datasets, the AUC values of the top 10 genes were all greater than 0.9 (Supplementary Fig. 2A). We found that EVL, TRBC1, BCL11B, FAIM3, ABLIM1, SIRPG, and CD7 were also significantly downregulated in the external datasets (Supplementary Fig. 2B). Furthermore, we performed LASSO analysis based on these 10 key genes to further narrow down the candidate genes and 4 genes with optimal λ values were screened, including SNX3, NAIP, ABLIM1 and CD7 (Supplementary Fig. 3).
Immune Cell Infiltration Analysis
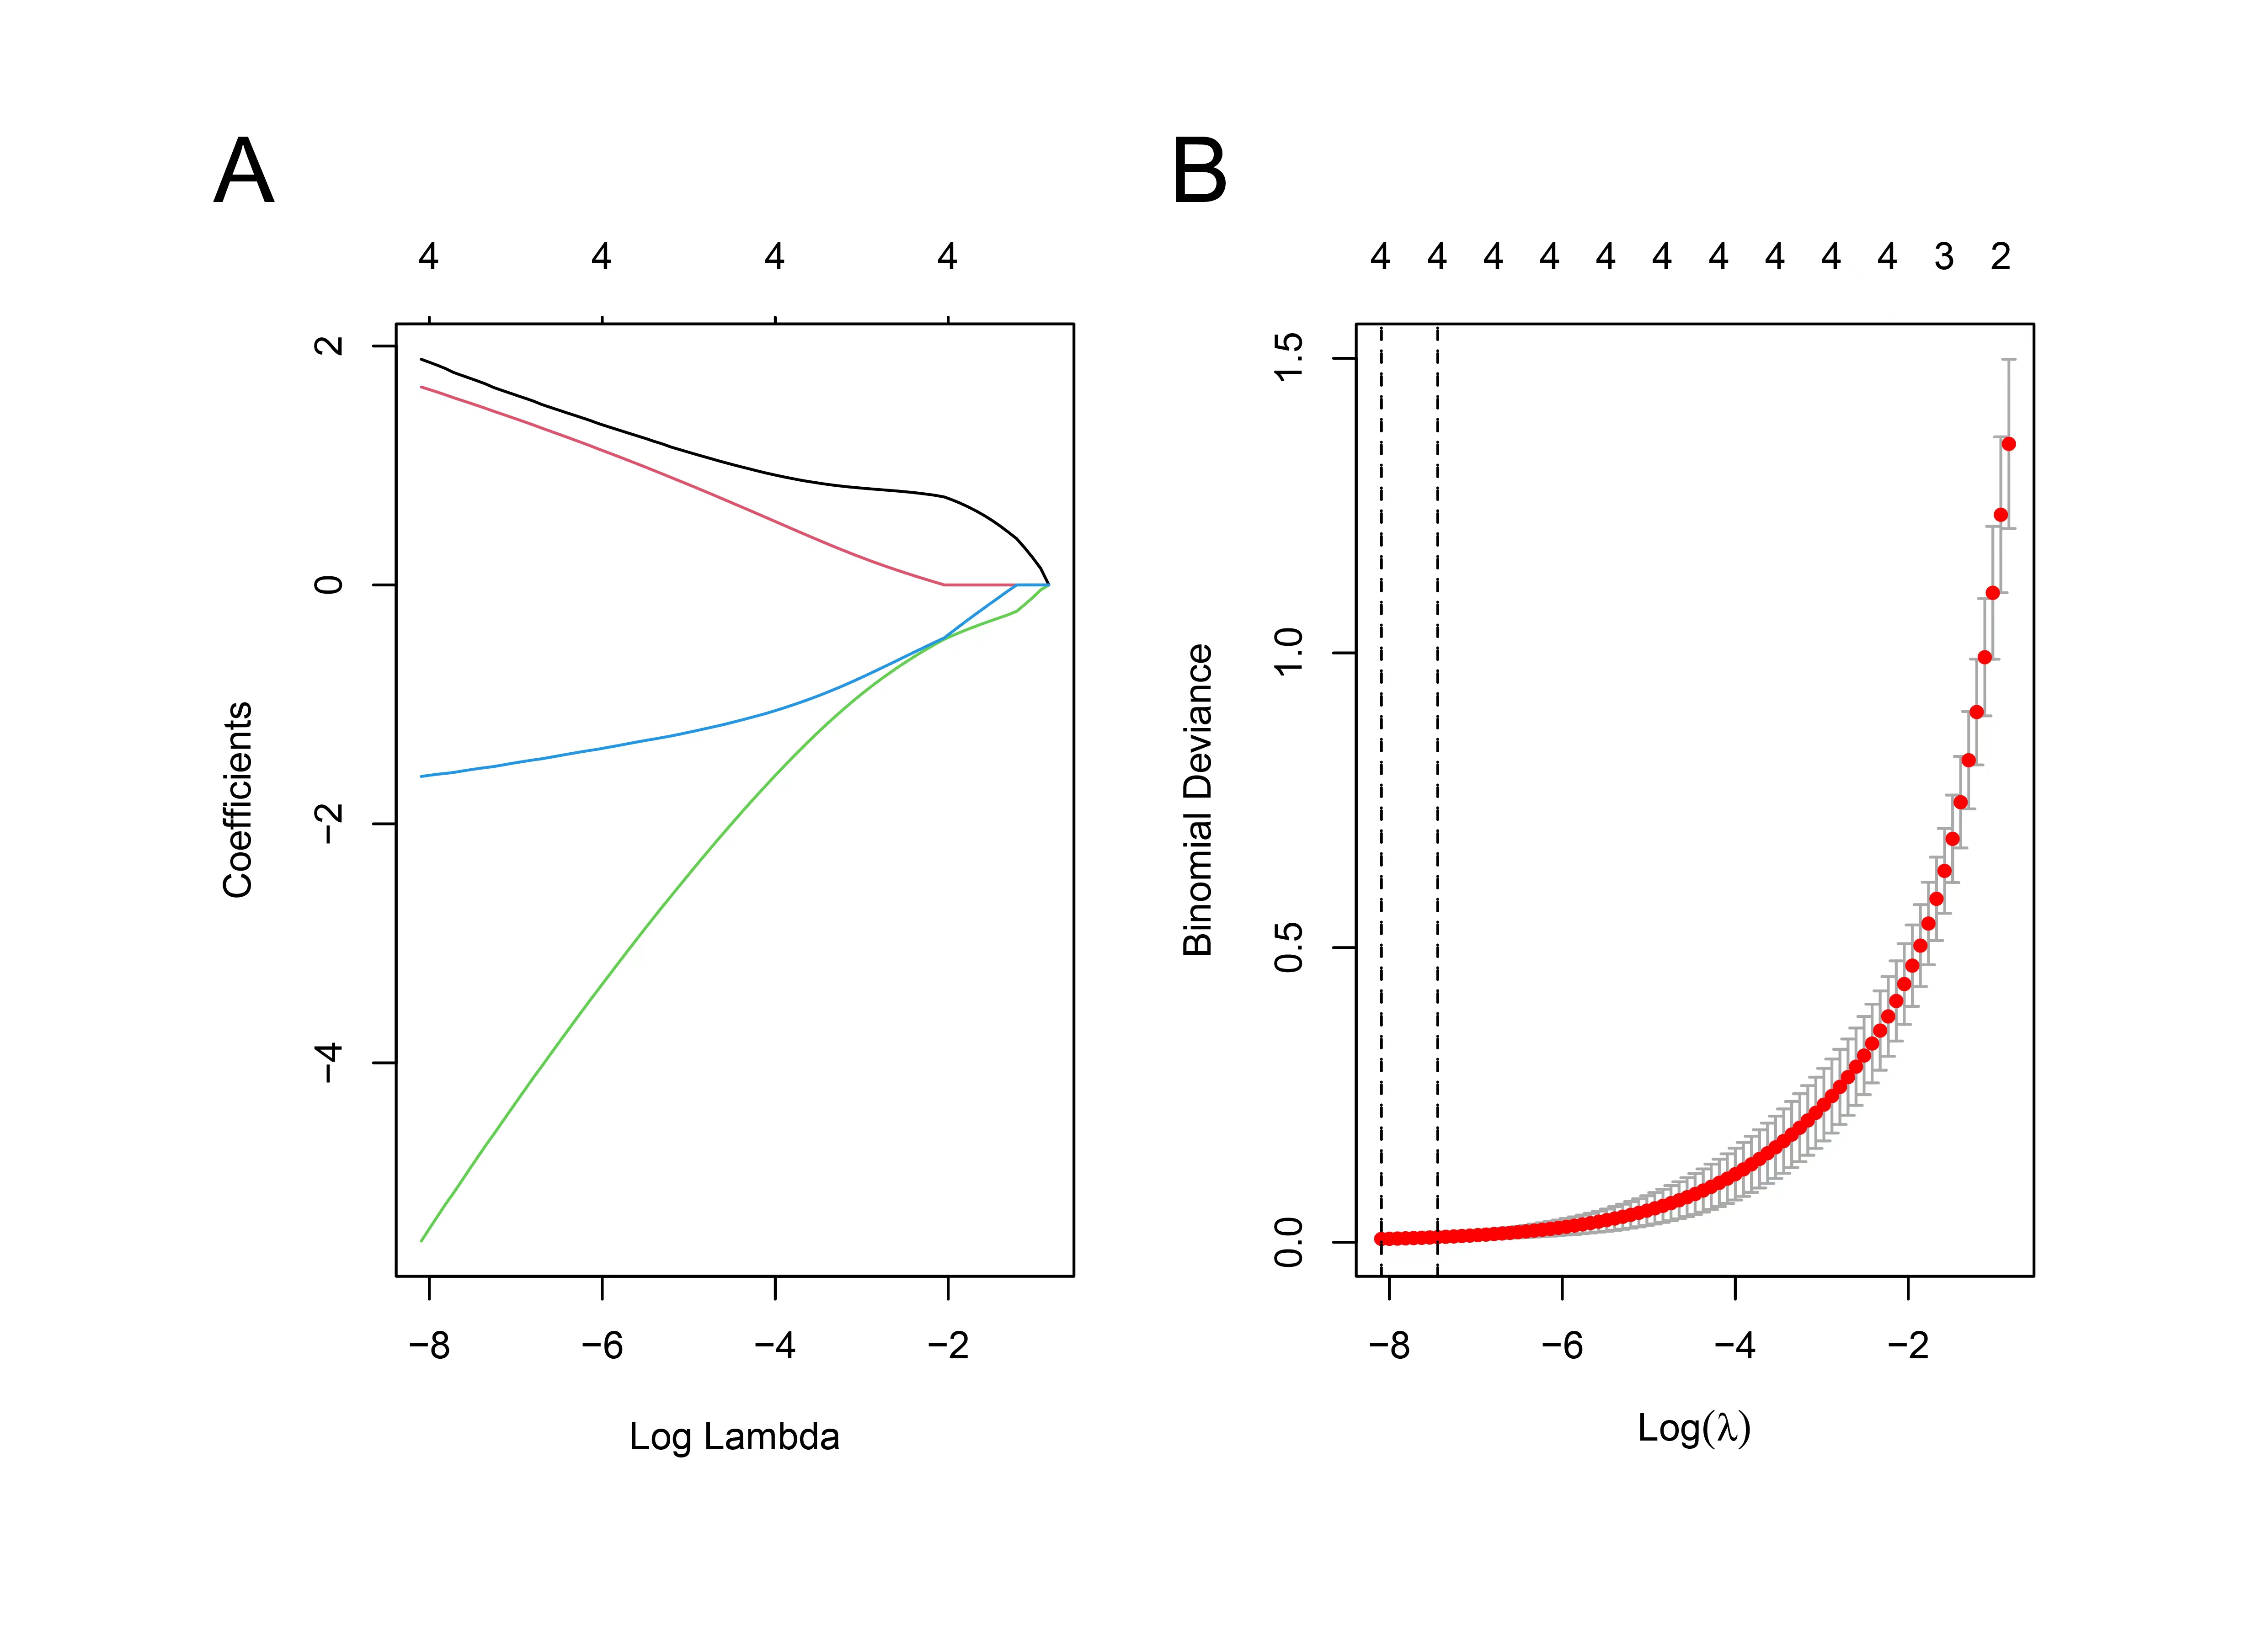
Twenty-two immune cells infiltration in 20 normal samples and 10 sepsis samples were analyzed using the CIBERSORT method (Fig. 6A). Dramatic differences were observed in the infiltrating immune cells between control group and septic group. We found that neutrophils, monocytes, and NK cells are the mostly infiltrated immune cells in septic samples. Conversely, the number of naïve B cells and CD4 memory-activating T cells were very small (Fig. 6A). At the same time, the septic tissues typically exhibited a higher proportion of neutrophils and monocytes (P < 0.05) than the normal tissue. By contrast, the sepsis tissue exhibited remarkably fewer naïve B cells, naïve B cells with memory, CD8 naïve T cells, and CD4 naïve T cells than the normal tissue (Fig. 6B). Furthermore, according to the correlation analysis on the biomarkers and immune cells infiltration, we found that TRBC1, BCL11B, ABLIM1 were positively correlated CD4 naïve T cells, with correlation coefficients of 0.74, 0.72, and 0.79, respectively (P < 0.001). (Supplementary Table 2). In addition, we generated correlation heatmaps depicting the relationships between the key genes and autophagy-related genes, immune-related genes, HLA genes and costimulatory molecule genes. These heatmaps can be found in Supplementary Fig. 4.
Single-Cell Transcriptomic Analysis of PBMCs
We excluded some cells and controlled the ratio of erythrocyte genes to mitochondrial genes to ensure all cells used in the present study were qualified (Fig. 7A, B). A total of 9,575 cells from the scRNA-seq dataset were used for further analysis. The number of unique molecular identifiers represented by nCount RNA was positively correlated with the number of genes represented by nFeature RN, with a correlation coefficient of 0.94 (Fig. 7C). We firstly identified 3,000 genes with high variability levels and marked the 10 most significant markers eventually. All HVGs are highlighted in red in Fig. 7D. Through PCA dimensionality reduction, the first 20 PCs are selected for analysis (Fig. 7E), t-SNE algorithm was used for preliminary clustering (Fig. 7F).
Identification of Single-Cell Subpopulations
Based on the known SingleR automated annotations and artificial annotations, we categorized 19 cell clusters into five different cell subgroups: T cells, B cells, monocytes, platelets cells, and NK cells (Fig. 8A). The FindAllMarkers algorithm was then used for screening the biomarkers of all five cell types. The results are displayed in Fig. 8B, which presents the three marker genes that performed the best across all five cell types. The marker gene (Fig. 8C) and the expression heat map of this marker gene (Fig. 8D) are shown in the violin diagram. We visualized the expression of the marker gene by utilizing a feature map. (Fig. 8E). The reliability of cell subset annotation results was determined by evaluating marker gene expression levels. The scale plot presented a representation of the distribution of various cell clusters within each sample (Fig. 8F), where significant differences were observed in the proportions of cell subsets in the normal and sepsis groups. The percentage of monocytes and NK cells was significantly greater in the sepsis group than in the control group; however, the proportion of B and T cells in the sepsis group was significantly lower (Fig. 8F).
Expression Levels of Key Genes in Single Cells
We examined the expression patterns of diagnostic genes in peripheral blood mononuclear cells (PBMCs) collected from samples of sepsis patients using a random forest screening approach. The expression levels of nine diagnostic genes in different samples and different cells were presented using violin diagrams, including SNX3, EVL, TRBC1, BCL11B, MMP8, NAIP, ABLIM1, SIRPG, and CD7 (FAIM3 expression was not seen in single-cell data) (Fig. 9A, B). TRBC1, BCL11B, and ABLIM1 were mainly expressed in T cells, and a significant reduction in TRBC1, BCL11B, and ABLIM1 expression levels was observed in the sepsis group comparing with the normal group. We also observed the different expression levels of these three genes in the normal and sepsis groups using a feature map, where blue, red, and light green dots respectively represent the expression levels of these genes. The expression levels of TRBC1, BCL11B, and ABLIM1 were significantly downregulated in the sepsis group comparing with the normal group (Fig. 9C–E). Hence, our primary focus was to investigate the developmental progression of T cells through a subsequent single-cell quasi-chronological analysis.
Single-cell Pseudotime Sequence Analysis and Key Genes Expression Trends
Compared with the normal group, T cells in the sepsis group exhibited significant downregulation of apoptosis, suggesting that T cells have a crucial role in sepsis. Therefore, a simulation analysis was carried out on the differentiation of T cells' cell trajectory (Fig. 10A). The intensity of blue color indicates the chronological order of T cell differentiation from right to left. The darker shades of blue signify the cells that differentiated earlier, while the lightest shade represents the most recently differentiated cells. (Fig. 10B). T cells have various differentiation states. Each state was marked with a different color, with red (right) being the earliest type of differentiation (Fig. 10C). The differentiation trajectories of septic and normal group T cells were observed. The septic T cells differentiated later than the normal T cells (Fig. 10D). We then presented the expression level plot of TRBC1, ABLIM1, and BCL11B in single-cell developmental trajectories (Fig. 10E), wherein TRBC1 expression was gradually downregulated over time. The ABLIM1 expression level did not change significantly over time.
Monocyte Differential Analysis and Enrichment Analysis
The monocyte subset in the single-cell data was significantly elevated in the sepsis group. Therefore, all monocytes from the sepsis samples were extracted from single-cell difference analysis. We identified DEGs between monocytes in the sepsis and normal samples in GSE195965, including 796 upregulated and 648 downregulated genes (Fig. 11A). The KEGG pathways mainly enriched in oxidative phosphorylation and chemical carcinogenesis, reactive oxygen species, phagosome, rheumatoid arthritis, and thermogenesis (Fig. 11B). The GO terms were partitioned into three categories: molecular functions, cell components, and biological processes. The DEGs were enriched in cell components such as cell-substrate junction and focal adhesion, biological processes such as the production of precursor metabolites and energy and ATP metabolism, and molecular functions such as electron transfer activity, oxidoreduction-driven active transmembrane transporter activity, NADH dehydrogenase (ubiquinone) activity, and NADH dehydrogenase (quinone) activity (Fig. 11C). The results thus suggest activation of oxidative and inflammatory responses in sepsis.
Single-cell Transcriptome Analysis of Septic PBMCs in Mice
The scRNA sequencing dataset from the GEO database, specifically GSE195965, was chosen to confirm the infiltration of monocytes in PBMCs during sepsis, as well as the apoptosis of T cells. A total of 18,043 cells were included in the present study, including 11,047 cells from septic mice and 6,996 cells from mice without sepsis. After these clusters were created, they were annotated using SingleR and Celldex. A cluster of cells containing B cells, T cells, NK cells, granulocytes, and monocytes were found in the GSE195965 dataset, with the associated cell subsets being annotated within the cluster (Fig. 12A). Then, dot plots (Fig. 12B) and violin plots (Fig. 12C) were used to delineate the expression levels of marker genes for cell subsets. The expression levels of marker genes in each cell subpopulation were significantly different. Finally, the cell-scale plots illustrated the proportion of distinct cell populations in both the sepsis and normal groups. The proportions of monocytes, NK cells, and granulocytes were significantly higher in the septic. T and B cells were significantly reduced in the tissues of septic mice compared with the tissues from normal mice. In summary, the GSE195965 dataset confirms that the monocytes were upregulated and activated in sepsis, Whereas, T cells showed a significant amount of apoptosis and loss of function (Fig. 12D).