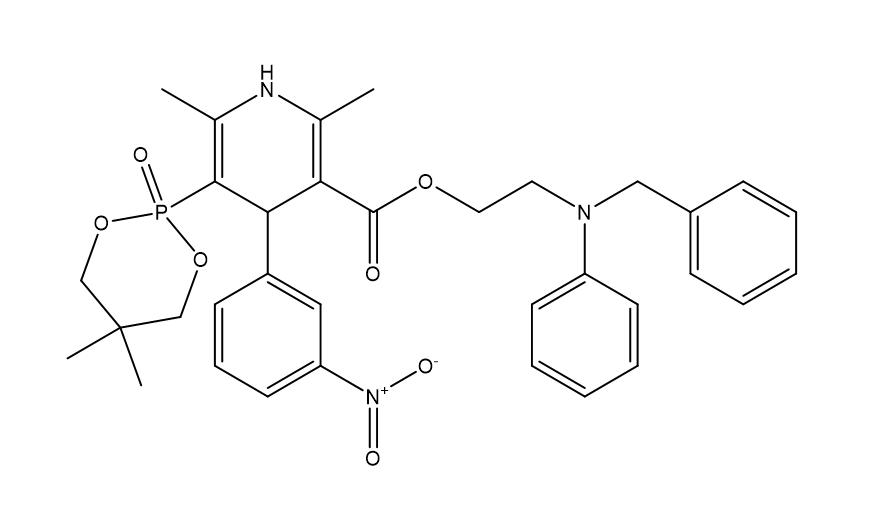
Characterization of synthesized ZnO nanoparticles
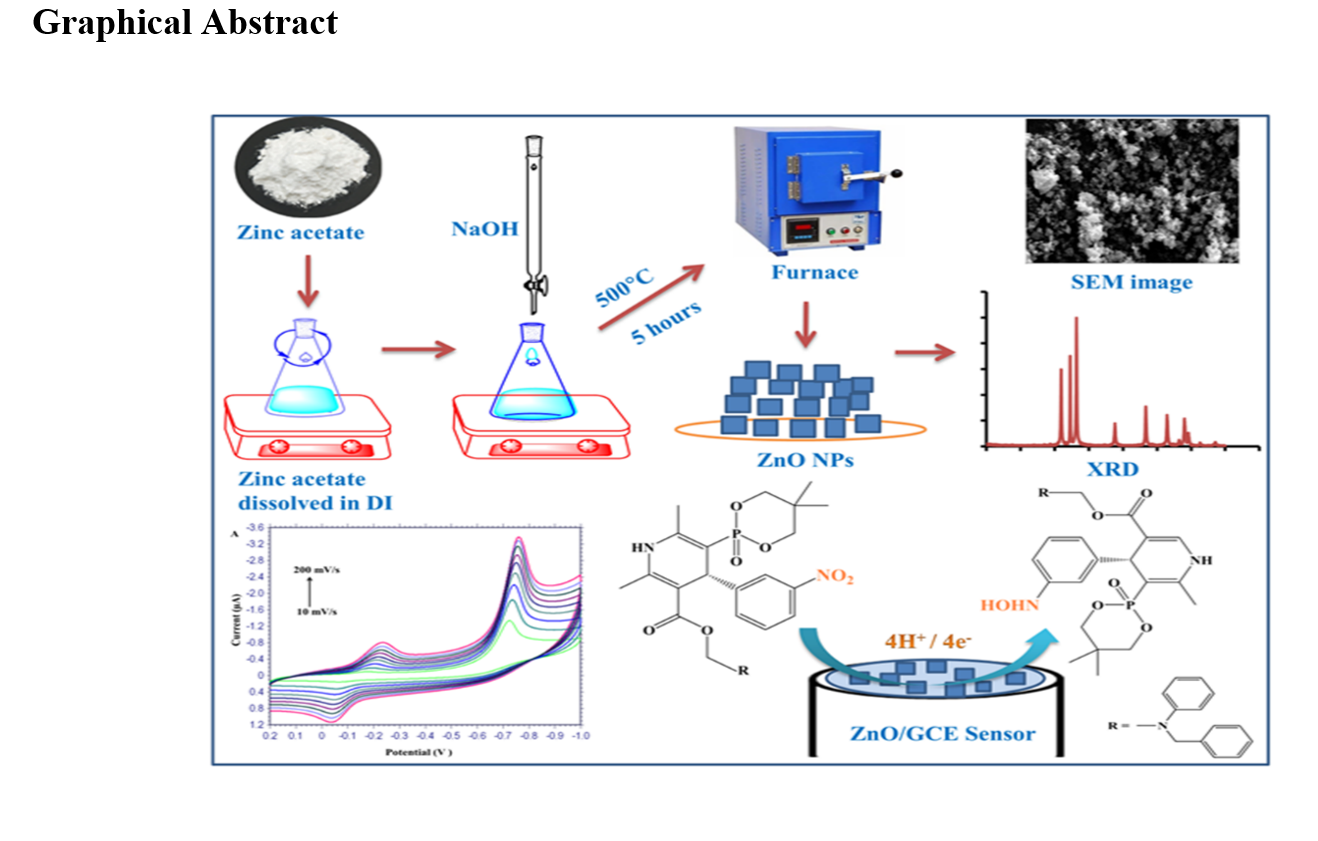
The surface morphology and microstructure of synthesized ZnO NPs were characterized by the Scanning Electron Microscope (SEM) technique, as shown in Fig. 1(a and b). The SEM images represent the ZnO NPs are uniformly distributed over the sample with an average particle size of ~ 60 nm. Furthermore, the energy dispersive spectrometer (EDS) was used to study the elemental composition of ZnO NPs, which confirms that ZnO NPs were successfully synthesized with a good stochiometric ratio as shown in Fig. 1(c). The SEM study of ZnO NPs suggests that the uniformly distributed ZnO NPs on the glassy carbon electrode surface formed a conductive network, which enhances the electron transfer rate resulting in superior electrocatalytic activity towards the reduction of EFO.
Moreover, the crystalline structure, phase, and purity of synthesized ZnO NPs were obtained by the XRD technique. The XRD spectrum of ZnO NPs is depicted in Fig. 2, which shows the major diffraction peaks of (100), (002), (101), (102), (110), (103), (200), (112), (201), (004), and (202) crystal planes corresponding to diffraction angle 2θ = 31.83°, 34.53°, 36.32°, 47.65°, 56.91°, 62.86°, 66.46°, 67.96°, 69.07°, 72.59° and 76.96°, respectively. All the peaks coincide with the wurtzite structure of ZnO (JCPDS card no. 01-070-8072) with a space group symmetry of P63mc. Additionally, the average crystallite size of ZnO NPs was obtained using Scherrer equation D = Kλ/βcosθ, where λ is the wavelength of the X-ray source (0.15418 nm), β denote the full width at the half maximum of the ZnO lines (101) and θindicate the angle of diffraction and K represent a constant (0.9) [36–37]. The acquired value of the crystallite size of ZnO NPs is 58.09nm.
Effective surface area of ZnO fabricated GCE:
The effective surface area of ZnO/GCE was calculated using the Randles Secvik Eq. (1) for cyclic voltammograms [38–39]
I p = (2.69 ×10 5 ) n 3/2 A D 1/2 ν 1/2 C (1)
Where Ip refers to the peak current (in Ampere), n is the number of electrons transferred in electrodic reaction, A is the effective surface area (in cm2) of the electrode, D is the diffusion coefficient (7.6×10− 6 cm2s− 1 for K3[Fe(CN)6]), ν is the potential scan rate (Vs− 1) and C is the concentration (in molcm− 3) of K3[Fe(CN)6]. The reported surface area of ZnO/GCE was 0.0541 cm2, which is more than two times that of the surface area (0.024 cm2) of the bare glassy carbon electrode.
Electrochemical behavior of Efonidipine at ZnO/GCE Surface
The electrode-electrolyte interface assessment of ZnO fabricated glassy carbon electrode was investigated through electrochemical impedance spectroscopy (EIS). The electrochemical impedance spectra were recorded with 1.0 mmolL− 1 EFO as redox moiety in pH 7.0 BR buffer and 0.2 molL− 1 KCl solutions. The diameter of a semicircle of the Nyquist graph represented the charge transfer resistance (Rct). The Nyquist plot of bare GCE and ZnO/GCE illustrated that ZnO/GCE has a lower larger value of Rct as compared to bare GCE, as shown in Fig. 3 which also confirms that ZnO NPs developed a conductive network on the GCE surface which enhance the electron transfer rate at the electrode-electrolyte interface [40]. The reported value of charge transfer resistance (Rct) for bare GCE and ZnO/GCE was 12100 Ω and 4500 Ω respectively.
The heterogeneous rate constant (Kh) for the reduction of EFO at ZnO/GCE was evaluated using the Eq. (2) [42–42]
K h = RT/F 2 R ct AC o (2)
Where Rct denotes the charge transfer resistance (in ohm), A represents the effective surface area of the electrode (in cm2), Co refers to the EFO concentration (in mol.cm− 3), T indicates the absolute temperature (in K) and F is the Faraday’s constant (F = 96500 C.mol− 1). The calculated values of the heterogeneous rate constant (Kh) for the reduction of EFO at bare GCE and ZnO/GCE were 8.44x10− 4 cm.sec− 1 and 7.34x10− 3 cm.sec− 1, respectively. The higher value of the heterogeneous rate constant (Kh) for ZnO/GCE confirms its superior electrocatalytic role in the reduction of EFO.
Cyclic Voltammetric Investigation of EFO
Cyclic voltammograms of 200 µmolL− 1 EFO (in BR buffer pH 7.0) at bare GCE and ZnO NPs fabricated glassy carbon electrode (ZnO/GCE) were recorded versus Ag/AgCl reference electrode at scan rate 100mVs− 1, as shown in Fig. 4. Electrochemical reduction of EFO at bare and ZnO/GCE surface gave three well-defined peaks in the voltammograms, out of which two peaks (P-1at -0.25 V and P-2 at -0.785 V) reported during the cathodic scan and one peak (P-3at -0.025 V) during the anodic sweep due to reduction and oxidation of nitro (-NO2) moiety of the drug at the electrode surface. The peak P-2 at -0.785 V was obtained with the highest peak current and sharper size; hence all the electrochemical investigations of EFO were reported to select it as the standard peak. Fabrication of glassy carbon electrode with synthesized ZnO nanoparticles formed a conductive network which increases the electrode activity by providing a higher effective surface area, higher electron transfer rate, and better electrical conductivity.
Effect of pH of supporting electrolyte
A supporting electrolyte is a solution of ionic salt compounds in a polar solvent. It has several effects on the electrodic process, such as increasing the conductivity of the solvent, allowing the current to flow continuously in the solution, and staying electro-inactive in the relevant potential range. Moreover, it creates favorable conditions for the diffusion-controlled kinetics of the electrodic reaction, by facilitating the diffusion of electro-active species towards the electrode surface. Among the different supporting electrolytes, we found that the BR buffer gave the highest peak current.
Voltammetric measurements were reported in different supporting electrolytes (Acetate, BR, and Phosphate buffer). But the highest peak current with a sharper peak was observed in the BR buffer, so it was selected for the electrochemical investigations of efonidipine (See in Supporting information). Cyclic voltammograms of EFO at ZnO/GCE were recorded in Britton Robinson (BR) buffer at pH 3,5,7,9 and 11, as represented in Fig. 5(a). The value of peak potential and the peak current is depending on the pH of the BR buffer and the highest peak current and sharper peak were reported at pH 7.0, so a BR buffer of pH 7.0 was selected for the voltammetric investigations of EFO at ZnO/GCE. The variation in peak potential and peak current with the pH of the buffer is represented in Figs. 5(b) and 5(c), respectively. The value of peak potential (Ep) varies linearly with the pH of BR buffer as per the given Eq. (3) (for Peak P-2):
E p (V) =–0.0483pH + 1.0095; R 2 = 0.9998 (3)
The reported slope value − 0.0483 in our investigations was quite close to the theoretical Nernstian value of -0.059 V/pH indicating that an equal number of electrons and protons were participating in the reduction of EFO at ZnO/GCE [43–44].
Effect of potential scan rate
The effect of potential sweep rate on the cyclic voltammograms of 3.0 x10⁻⁵ molL-1 EFO in 7.0 pH BR buffer at ZnO/GCE was reported. When the potential scan rate was increased from 10 to 200 mVs-1, the values reduction potential of EFO shifted towards more negative values with an increase in peak current, as represented in Fig. 6(a). The peak current varied linearly with the square root of the potential sweep rate (ν1/2) in Fig. 6(b), which confirmed that the reduction of EFO at ZnO/GCE is diffusion controlled., the slope of the plot logarithm of peak current and the logarithm of scan rate (log Ip vs. logν) (Fig. 6(c)) in our experiment is 0.478 which is also close to the theoretical value of 0.5 for a diffusion-controlled process [45]. The linear regression equation related to the log Ip vs. logν plot is given in Eq. (4)
log Ip = 0.478log ν + 0.126 R2 = 0.9986 (4)
Calculation of electron transfer coefficient (α) and number of electrons (n)
Cyclic Voltammograms of EFO at ZnO/GCE gave a linear relationship between peak potential (Ep) and log of scan rate (lnν), which was used to calculate the electron transfer coefficient (α) by applying the Eq. (5) [46],
E p = E 0 + m [0.78 + ln (D ½ k s −1 ) – 0.5 ln (m)] + (m/2) lnν (5)
Herein, m = [RT/(1-α)nαF].
For the reduction of EFO at ZnO/GCE the calculated value of the transfer coefficient (α) with the slope of Fig. 7 is equal to 0.67, which also confirmed that the electrode process is diffusion-controlled [47]. Additionally, the number of electrons participating in the electrodic reaction was calculated using Eq. (6)
Ep – Ep/2= \(\frac{47.7}{\alpha n}\)mV (6)
Here Ep refers to the peak potential and Ep/2 refers to the potential where the current is just half that of the peak current. The average value of Ep – Ep/2 is 17.75mV. The obtained value of the number of electrons in the electrodic reaction was approx 4.01which was taken as 4.0 for further electro-kinetics calculations.
Furthermore, the relation between peak potential (Ep) and the logarithm of scan rate (logν) is also used for the calculation of Tafel slope (b) as per the given Eq. (7) [47–48]
Ep = \(\frac{{b}}{2 }\) log ν + constant (7)
For an irreversible diffusion-controlled one-electron transfer process the theoretical value of the Tafel slope is 0.118 Vdec− 1. For the irreversible reduction of EFO at ZnO/GCE (Peak P-2), the calculated value of Tafel slope is 46 mVdec− 1 (calculated from regression equation Ep = 0.0236logν + 0.6485; for Ep vs. logν graph). The lower value of the tafel slope (< 100 mVdec− 1) also favors the superior electro-catalytic activity of ZnO/GCE [47].
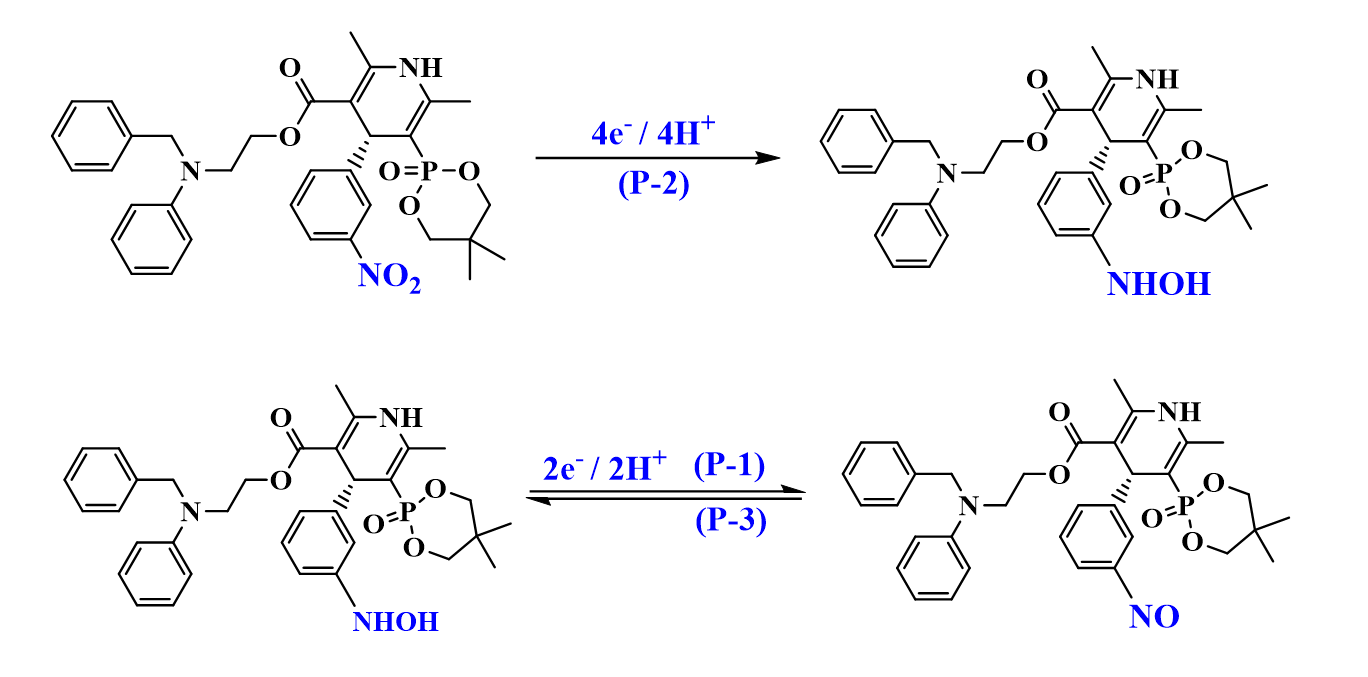
Possible Mechanism of Redox Reduction of EFO at ZnO/GCE
Cyclic voltammetric investigations of EFO at ZnO/GCE illustrated that a couple of well-defined reversible peaks (P-1 and P-3) in the lower potential region and an irreversible peak (P-2) in the higher potential region were observed in voltammograms. The irreversible peak (P-3) in the higher potential region was reported due to the reduction of the nitro (-NO2) group to hydroxylamine (-NHOH) via4e−/4H+ participation [ 49–50]. The reversible peaks (P-1 and P-3) were obtained due to the reversible conversion of the nitroso (-NO) group to hydroxylamine (-NHOH) via the participation of two electrons and two protons [51–52]. The proposed possible mechanism of reduction of EFO at ZnO/GCE based on cyclic voltammetric studies was shown in Scheme-3.
Determination of surface coverage (To) and diffusion coefficient (Do)
Double potential step chronocoulometry technique is used to determine the surface coverage (To)and diffusion coefficient (Do) for the reduction of 2.7×10− 4molL− 1 EFO at ZnO/GCE in pH 7.0 BR buffer using an Anson plot, as shown in Fig. 8. The intercept and slope values of the Anson plot were used for the calculation of surface coverage (To) and diffusion coefficient (Do), respectively, in the integrated Cottrell Eq. (8) [47, 50]
Q d = \(\frac{2{n}{F}{A}{{C}}_{{o}}\sqrt{{{D}}_{{o}}}\sqrt{{t}}}{\sqrt{{\pi }}}\) and Qd = nFATo (8)
Herein, Qd refers to the amount of charge consumed during electrolysis of EFO, n denotes the number of electrons, Doindicates diffusion coefficient (cm2s− 1), t refers to the time in seconds, Co refers to the effective concentration of EFO (2.7×10− 4molL− 1), F is Faraday’s constant(F = 96500 Cmol− 1), A denotes the effective surface area of the electrode(cm2). The obtained values of diffusion coefficient (Do) and surface coverage (To) in our experiments are 2.337×10− 5 cm2s− 1 and 3.104×10− 11molcm−2, respectively. The higher values of surface coverage and diffusion coefficient coincided with the electro-catalytic role of ZnO/GCE towards the reduction of EFO.
Calibration Curve and detection limit
Differential pulse stripping voltammetry (DPSV) and linear sweep voltammetry methods are comparatively highly sensitive techniques as compared to other quantitative methods. Additionally, both techniques have a linear correlation between peak current and concentration of analyte, so both can be used for quantitative analysis of EFO in pharmaceuticals. Linear sweep and differential pulse stripping (DPS) voltammograms were recorded with varying concentrations of EFO at ZnO/GCE, as demonstrated in Figs. 9a and 10a. The peak current in LS and DPS voltammograms increased linearly with increasing EFO concentration in the range of 0.14–0.98µmolL− 1, as represented in Figs. 9b and 10b respectively. The linear regression equations corresponding to calibration plots for LSV and DPSV are given in equations 9 and 10, respectively.
Ip (µA) = 0.723C (µmolL − 1 ) + 0.3727; R 2 = 0.9907 (for LSV) (9)
Ip (µA) = 0.937C (µmolL − 1 ) + 0.6740; R 2 = 0.9955 (for DPSV) (10)
The limit of detection (LOD) represents the minimum concentration of EFO that can be determined with significant certainty. LOD in our experiments was calculated by the equation LOD = 3S/m, where S represents the standard deviation of intercept and m denotes the slope of linearity of calibration plots. The obtained values of LOD and limit of quantification (LOQ = 10S/m) for the DPSV method were 0.07 and 0.24 µmolL− 1, respectively, which confirms the high sensitivity of the proposed method.
The various data of the calibration plots of EFO obtained by the proposed DPSV and LSV methods are listed in Table-1. Additionally, we also compare the LOD values of other reported methods available for the determination of EFO with the LOD values of our proposed methods. The data in Table-2 can be concluded that the proposed DPSV and LSV techniques are as sensitive as previously reported methods.
Table-1 Validation parameters for assay of EFO at ZnO/GCE by proposed LSV and DPSV methods.
|
Parameters
|
Results
|
|
LSV
|
DPSV
|
|
Linearity range
|
0.14–0.98 µmolL− 1
|
0.14–0.98 µmolL− 1
|
|
Measure potential
|
0.633 V
|
0.684 V
|
|
Correlation coefficient (R2)
|
0.9907
|
0.9955
|
|
Slope (m)
|
0.7723 µA/µmolL− 1
|
0.9371µA/µmolL− 1
|
|
Standard deviation (S)
Limit of detection (LOD)
|
0.055
0.21 µmolL− 1
|
0.022
0.07 µmolL− 1
|
|
Limit of quantification (LOQ)
|
0.71 µmolL− 1
|
0.24 µmolL− 1
|
|
Relative standard deviation (RSD)
|
0.6%
|
0.2%
|
Table-2 Comparison of the detection limit of present work with other previously reported methods for the determination of EFO.
|
Technique
|
Linearity range µmolL− 1
|
LOD
µmolL− 1
|
LOQ
µmolL− 1
|
%RSD
|
Reference
|
|
RP-HPLC
|
3.74–149.7
|
0.508
|
1.556
|
1.16
|
Rajput et al. 2020
|
|
First-order Spectrophotometric
Determination
|
2.99–26.94
|
0.598
|
1.81
|
1.32
|
Dudhrejiya et al. 2022
|
|
HPTLC
|
-
|
0.015
|
0.047
|
-
|
Chaudhri and Shrikhedkar 2020
|
|
UV spectrophotometric method
|
9.58–57.48
|
0.22
|
0.67
|
< 2
|
Solanki, Patel, and Meshram 2022
|
|
Voltammetry using ZnO/GCE
|
0.14–0.56
|
0.07
|
0.24
|
0.2
|
This work
|
Stability and reproducibility study of ZnO/GCE sensor
The outcomes of differential pulse stripping voltammetric methods are used to validate the applicability of the fabricated ZnO/GC electrode. In our experiments, we stored the ZnO/GCE at 25oC for three weeks, and only a small decrease in the peak current with RSD 1.6% was reported (inset Fig. 11). These results showed good stability of the developed sensor towards detection of EFO, furthermore, the reproducibility of the sensor was performed by comparing the peak current of 1.0 µmolL− 1EFO solution at seven ZnO fabricated GCE. The relative standard deviation was reported 2.05%, which authenticates the good reproducibility of ZnO/GCE.
Influence of interfering species
The effect of various interferents on the detection of efonidipine was reported under optimized conditions for 3.0mmolL− 1 EFO solution at ZnO/GCE. The maximum concentration of interfering species that cause an error of more than 5% in the determination of EFO has been defined as the tolerance limit [53]. The effect of some common interfering compounds like glucose, fructose, maltose, and NaCl was tested on the voltammetric response of EFO at the developed ZnO/GCE sensor. The data in the table-3 showed that approx.8.0 fold excess of glucose & fructose and 6.0 fold excess of maltose & NaCl did not have any interference in the voltammetric determination of EFO by the DPSV method.
Table-3 Effect of interfering compounds in the voltammetric determination of efonidipine at ZnO/GCE.
|
Tolerance Limit (Cin/CEFO)
|
Interfering compounds
|
|
8.0
|
Glucose and fructose
|
|
6.0
|
Maltose
|
|
6.05
|
NaCl
|
Cain refers to the interfering compound concentration and CEFO refers to the concentration of efonidipine.