Analysis of artemisinin content under different treatments
To assess the effects of GA or UV-B on artemisinin biosynthesis, we treated A. annua seedlings with either GA or UV-B radiation separately or subjected plants to a combined GA + UV treatment and determined the artemisinin concentrations in these plants after 0, 6, 12, and 18 h of the different treatments. In addition, the groups, which were received neither GA nor UV-B treatment at 0, 6, 12, and 18 h, were used as control group. Compared with the control plants, we detected an increase in artemisinin concentrations in those A. annua seedlings exposed to UV-B. Moreover, artemisinin concentrations in plants subjected to the GA + UV treatment were found to be notably higher than those in plants exposed to UV-B only (Fig. 1). As is shown in Fig. 1, artemisinin concentrations increased in a time-dependent manner in response to UV-B irradiation; however, a gradual decrease in the content of artemisinin was noted at 18 h, which we presume to be associated with UV-B-induced damage. In addition, we found that artemisinin concentrations under GA + UV treatment were significantly higher than that control group at 6 h and 12 h. Moreover, at 6 h, artemisinin concentrations in plants subjected to the GA + UV treatment were found to be significantly higher than those in plants treated with either UV-B or GA treatment, whereas no significant difference was observed between GA + UV and GA treatments at 18 h. Collectively, these results indicated that GA + UV and UV-B can enhance the artemisinin content of A. annua at 6 h after the initiation of treatment.
Identification of differentially expressed genes and functional annotation and classification
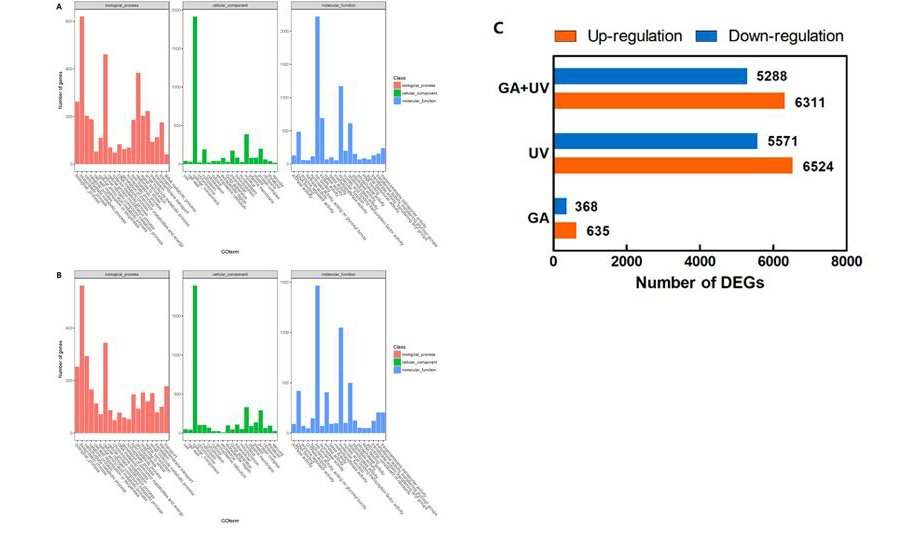
Given that GA and UV-B treatments had significant effects on the accumulation of artemisinin at 6 h, we performed transcriptome analysis using samples collected at 6 h after treatment initiation. We accordingly identified a total of 14,762 differentially expressed genes (DEGs) in A. annua, among which 635, 6524, and 6311 genes were up-regulated in plants treated with GA, UV-B, and GA + UV, respectively (Fig. 2A). Comparatively, 368, 5571, and 5288 genes were down-regulated in GA, UV-B, and GA + UV treatments, respectively (Fig. 2C). Comparison between the GA + UV and GA treatments revealed 214 and 138 genes that were up- and down-regulated, respectively. Whereas 5236 and 4252 genes were up- and down-regulated between the GA + UV and UV-B treatments, 234 and 111 genes were up- and down-regulated between the GA and UV-B treatments. Furthermore, we found that 162 and 88 genes were simultaneously up- and down-regulated, respectively in response to both GA, UV-B, and GA + UV treatments (Fig. 2, Table S2).
To identify differences in the processes affected by treatment with UV-B and GA, we subjected the DEGs to GO and KEGG pathway analyses. The proportions of genes enriched in the three main GO categories for GA + UV, UV-B, and GA treatments are summarized in Figure S1. A total of 5584 up-regulated DEGs were annotated into GO database and were classified into 60 functional groups, including biological process, molecular function and cellular component (Figure S1). Within the biological process, ‘biosynthetic process’ (GO: 0009058; 620 genes) and ‘cellular nitrogen compound metabolic process’ (GO: 0034641; 461 genes) and ‘response to stress’ (GO: 0006950; 384 genes) were predominant. The terms ‘cellular component’ (GO: 0005575; 1916 genes) was the most common in the cellular component category. In the molecular function category, the two main groups were the ‘ion binding’ (GO: 0046914; 2220 genes) and ‘molecular function’ (GO: 0003674; 1171 genes). To identify 4501 down-regulated DEGs were annotated in the GO database (Figure S1B). Within the biological process, ‘biosynthetic process’ (GO: 0009058; 562 genes) and ‘cellular nitrogen compound metabolic process’ (GO: 0034641; 344 genes) were predominant. The terms ‘cellular component’ (GO: 0005575; 1891 genes) was the most common in the cellular component category. In the molecular function category, the two main groups were the ‘ion binding’ (GO: 0046914; 1466 genes) and ‘molecular function’ (GO: 0003674; 1049 genes).
The analysis of KEGG pathway was performed to distinguish metabolic pathways (Fig. 2B, D). The analysis of up-regulated genes, within the organismal systems process, ‘Endocrine system’(21), metabolism process, ‘Global and overview maps’ (35) and ‘Carbohydrate metabolism’(37), genetic information processing, ‘translation’(31) and ‘folding, sorting and degradation’(40), environmental information processing, ‘signal transduction’(46), cellular processing, ‘transport and catabolism’ (22). The KEGG pathway analysis of down-regulated genes, within the organismal systems process, ‘Endocrine system’(11), metabolism process, ‘Global and overview maps’ (23) and ‘Carbohydrate metabolism’(45), genetic information processing, ‘translation’(14) and ‘folding, sorting and degradation’(9), environmental information processing, ‘signal transduction’(28), cellular processing, ‘transport and catabolism’ (21).
Expression Analysis Of The Genes Involved In Artemisinin Biosynthesis
Artemisinin is synthesized via multiple enzymatic steps in the sesquiterpene pathway. Our transcriptome analysis revealed that numerous differentially expressed genes were annotated as artemisinin biosynthetic genes. Among these, we analyzed the transcript levels of 21 artemisinin biosynthesis-related structural genes (Fig. 3A). In the mevalonate (MVA) pathway, 3-hydroxy-3-methyl-glutaryl CoA synthase (HMGS) and 3-hydroxy-3-methyl-glutaryl CoA reductase (HMGR) catalyze the two-step conversion of acetoacetyl-COA to mevalonic acid, and in the present study, we found the expression of HMGS was almost the same under GA, UV-B and GA + UV treatments, indicating that GA and UV-B does not promote the expression of HMGS. In contrast, the expression of HMGR was 3.42-fold higher in response to UV-B treatment compared with the control, and the response to GA + UV treatment was almost identical to that in induced by UV-B (Fig. 3B).
Farnesyl diphosphate (FPP), a precursor of amorpha-4, 11- diene, and other sesquiterpenes in A. annua, can be metabolized by different sesquiterpene synthases in competing pathways. Squalene synthase (SQS) is a key enzyme in the biosynthesis of sterols and triterpenes, which are competing pathways with respect to artemisinin biosynthesis. Zhang et al. [44] showed that inhibition of the expression of SQS by hairpin RNA-mediated RNAi increased artemisinin content by approximately 3.14-fold in transgenic plant lines. β-caryophyllene synthase (CPS) catalyzes the conversion of FPP to β-caryophyllene, which is also a competing pathway with respect to artemisinin biosynthesis, and it has previously been shown that down-regulation of CPS in A. annua resulted in a 54.9% increase in the content of artemisinin in transgenic plants [45]. In a further biosynthetic pathway that competes with that of artemisinin, β-farnesene synthase (BFS) catalyzes the conversion of FPP to β-farnesene [46]. In the present study, we compared with the control treatment, the expression of SQS, CPS, and BFS was down-regulated in response to UV-B and GA + UV treatments (Fig. 3B). Accordingly, we speculate that the observed increases in artemisinin content under these treatments could be explained by the down-regulation of enzymes in competing sesquiterpene pathways.
Amorpha-4,11-dienesynthase (ADS) is the first rate-limiting enzyme in the artemisinin biosynthetic pathway, and it has previously been observed that artemisinin contents were increased by approximately 59% in ADS-overexpressing transgenic plants [47]. Furthermore, overexpression of the CYP71AV1 and CPR genes in transgenic plants resulted in artemisinin contents that were almost 38% higher than those in non-transgenic A. annua [48]. Compared with the control treatment at 6 h, we found in the present study the GA, UV-B, and GA + UV treatments promoted 1.61-fold, 3.05-fold and 4.19-fold increases in the expression of ADS, respectively. Similarly, treatment with GA, UV-B, and GA + UV also led to 2.63-fold, 4.57-fold and 5.82-fold increases in the expression of CYP71AV1(Fig. 3B). Interestingly, we found that the expression level of ADS, CYP71AV1, DBR2 and CPR were up-regulated to a greater extent under GA + UV treatment than in response to UV-B treatment alone (Fig. 3). In order to validate the recorded levels of DEGs, we performed quantitative real-time PCR analysis of 9 selected genes. The resulting qRT-PCR expression profile were found to show a positive correlation with the transcriptome data (Fig. 3B).
Identification Of Co-expressed Transcription Factors And Artemisinin Biosynthesis Genes
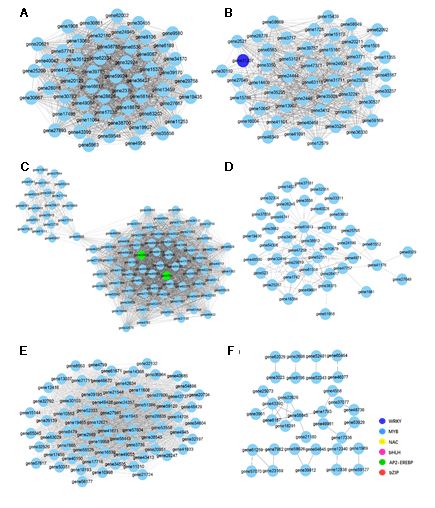
Among the DEGs detected, we identified a total of 1295 transcription factors (TFs), which were subjected to co-expression analysis to identify those TFs involved in the regulation of genes associated with artemisinin biosynthesis. We accordingly found that 179 and 161 TFs were co-expressed with gene35372 (ADS) and gene56138 (CYP71AV1) (|r| > 0.95), respectively. Among the TFs co-expressed with CYP71AV1, 26, 18, 15, and 13 were MYB, NAC, bHLH, and AP2-EREBP TFs, respectively (Fig. 4). Similarly, 24, 20, 20, 17, and 15 NAC, bHLH, MYB, AP2-EREBP, and WRKY TFs, respectively, were co-expressed with ADS (Table S3). Consistently, these TFs have previously been reported to play significant roles in regulating the expression of artemisinin biosynthesis genes. In this study, according to high degree value and high expression level, a total of 84 co-expressed transcription factors were identified, which were considered as the presumed regulators of artemisinin biosynthesis responding to GA + UV and co-expressed with ADS and CYP71AV1 genes (Fig. 4C). Transcription factors included MYB (MYB proteins), NAC (NAM/ATAF/CUC), WRKY (WRKY proteins), bHLH (basic helix-loophelix), bZIP (basic region/leucine zipper), AP2-EREBP (AP2/ERF domain-containing protein), C2H2 (C2H2 zinc-finger proteins), C3H (Cys3His zinc finger).
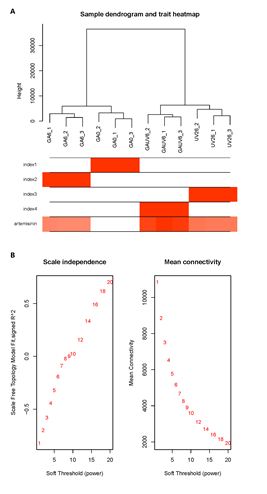
Wgcna And Identification The Functional Annotation Of Artemisinin‑related Modules
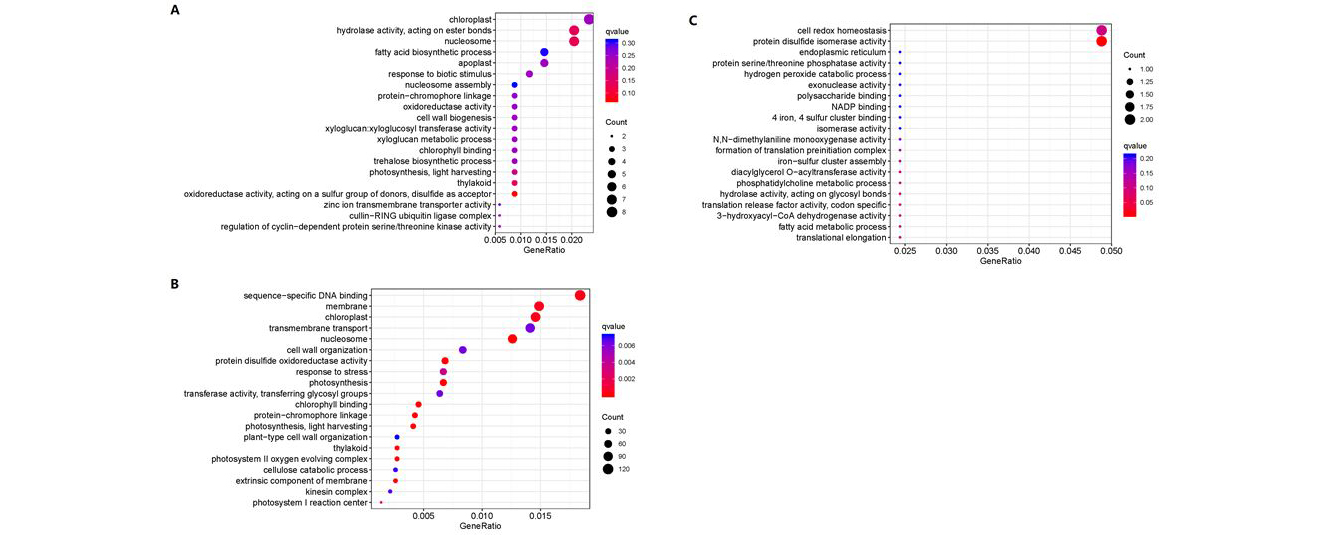
In order to determine the different modules of co-expressed genes, we performed weighted gene co-expression network analysis (WGCNA) on the DEGs. WGCNA divided the 14582 DEGs into six different modules, namely, MEblue, MEbrown, MEyellow, MEgreen, MEturquoise and MEgray, which contained 2829, 1450, 511, 482, 9233, and 34 genes, respectively (Fig. 5A, C; Table S4). Evaluation of the associations between the detected modules and artemisinin content indices revealed differences in the relationships between the six modules and artemisinin content. With respect to GA + UV treatment, we found that MEblue module was significantly correlated with artemisinin content (r = 0.83), suggesting that the DEGs in these modules should be up-regulated to promote an increase in artemisinin in response to GA + UV treatment. To examine the biological processes associated with the blue and green modules explored by WGCNA, we performed GO enrichment analysis (Fig. 6). We accordingly found that blue module-related genes stand for the basal defense of A. annua as evidenced by the enrichment of GO terms such as “signal transduction” and “sequence-specific DNA binding” (Fig. 6A). In contrast, with respect to control(CK) and GA treatment in the MEgreen module, were negatively correlated with artemisinin content (r = 0.99, -0.26, respectively), suggesting that the DEGs in these modules should be down-regulated to promote an increase in artemisinin content under control or GA treatment, enriched in the category “chloroplast” (Figure S4A). Further, we observed that the DEGs are associated with distinct responses according to the artemisinin content, highlighting the key roles played by regulatory genes in determining the artemisinin‑related processes (Fig. 5B). These results further support the premise that the co-expressed gene modules of the artemisia DEGs play different roles with respect to artemisinin‑related processes.
To understand the gene interactions within each module, we established the network of the detected co-expressed modules using Cytoscape 3.7.1 software, in order to distinguish candidate hub genes. In the above studies, the blue, brown, and yellow modules had higher responses to UV light or gibberellins, the plant hormone gibberellin and UV + GA treatments, respectively. So, the hub gene which was related to artemisinin, was found in the blue, brown, and yellow modules. Genes had clusters in the blue, brown, and yellow modules, each with a different number of genes (Figure S3). TFs were represented by different node colors, except that sky blue represents functional genes and the size of node circles was positively correlated with the number of interacting genes. Hub gene is the largest gene of nodes in network. In the blue module, we found several hub genes, including gene17498 (cytochrome P450 mono-oxygenase), gene20621 (plastid delta12-fatty acid acetylenase), gene63203 (photosynthetic reaction centre L/M Photosystem antenna protein-like protein plastid) and gene46617 (photosystem I P700 apoprotein A chloroplast) etc (Figure S3A). In the brown module, the hub genes detected are gene3771 (cytochrome P450), gene30537 (photosystem II 5kD protein), gene10647 (Dehydrogenase E1 component) and gene50594 (hypothetical protein) (Figure S3B). The yellow module contains complex clusters of genes, we observed two gene clusters linked by the gene45686 (leucine-rich repeat domain L domain-like protein). Namely, there are multiple biological functions in this module (Figure S3C). In addition, key TFs are also present in the blue, brown and yellow module, which may play the important regulatory role, including gene39715 (WRKY51) in the blue module, gene31207 (WRKY) in the brown module, gene25838 (AP2-EREBP) and gene760 (AP2-EREBP) in the yellow module. However, there is no gene encoding TFs in the green, turquoise and grey module (Figure S3, S4). We infer that these hub genes in their modules may be potential genes that regulate and enhance the specific response to UV light and gibberellin treatments in A. annua.