Phenotypicdifferencesbetweenthecold-sensitivelinece253andcold-tolerantwildriceY12-4undercoldstress
The cold-sensitive indica 253 and common wild rice (O.rufipogon Griff.) Y12-4 possessing a CT phenotype were used in this study. The two genotypes were obtained from Guilin, Guangxi Province, China. Under cold stress, the seeds were prepared with a coleoptile length of ≥5 mm. A marked difference in survival rate was observed between 253 and Y12-4 (Fig. 1), with Y12-4 showing better CT and recovery ability than 253. The germination rate of Y12-4 was 76% and that of 253 was 0% under 4 °C for 10 days and recovered for 5 days (mean values were compared by Student’s t test, P ≤ 0.01) (Fig. 1).
Libraryconstructionandsequencing
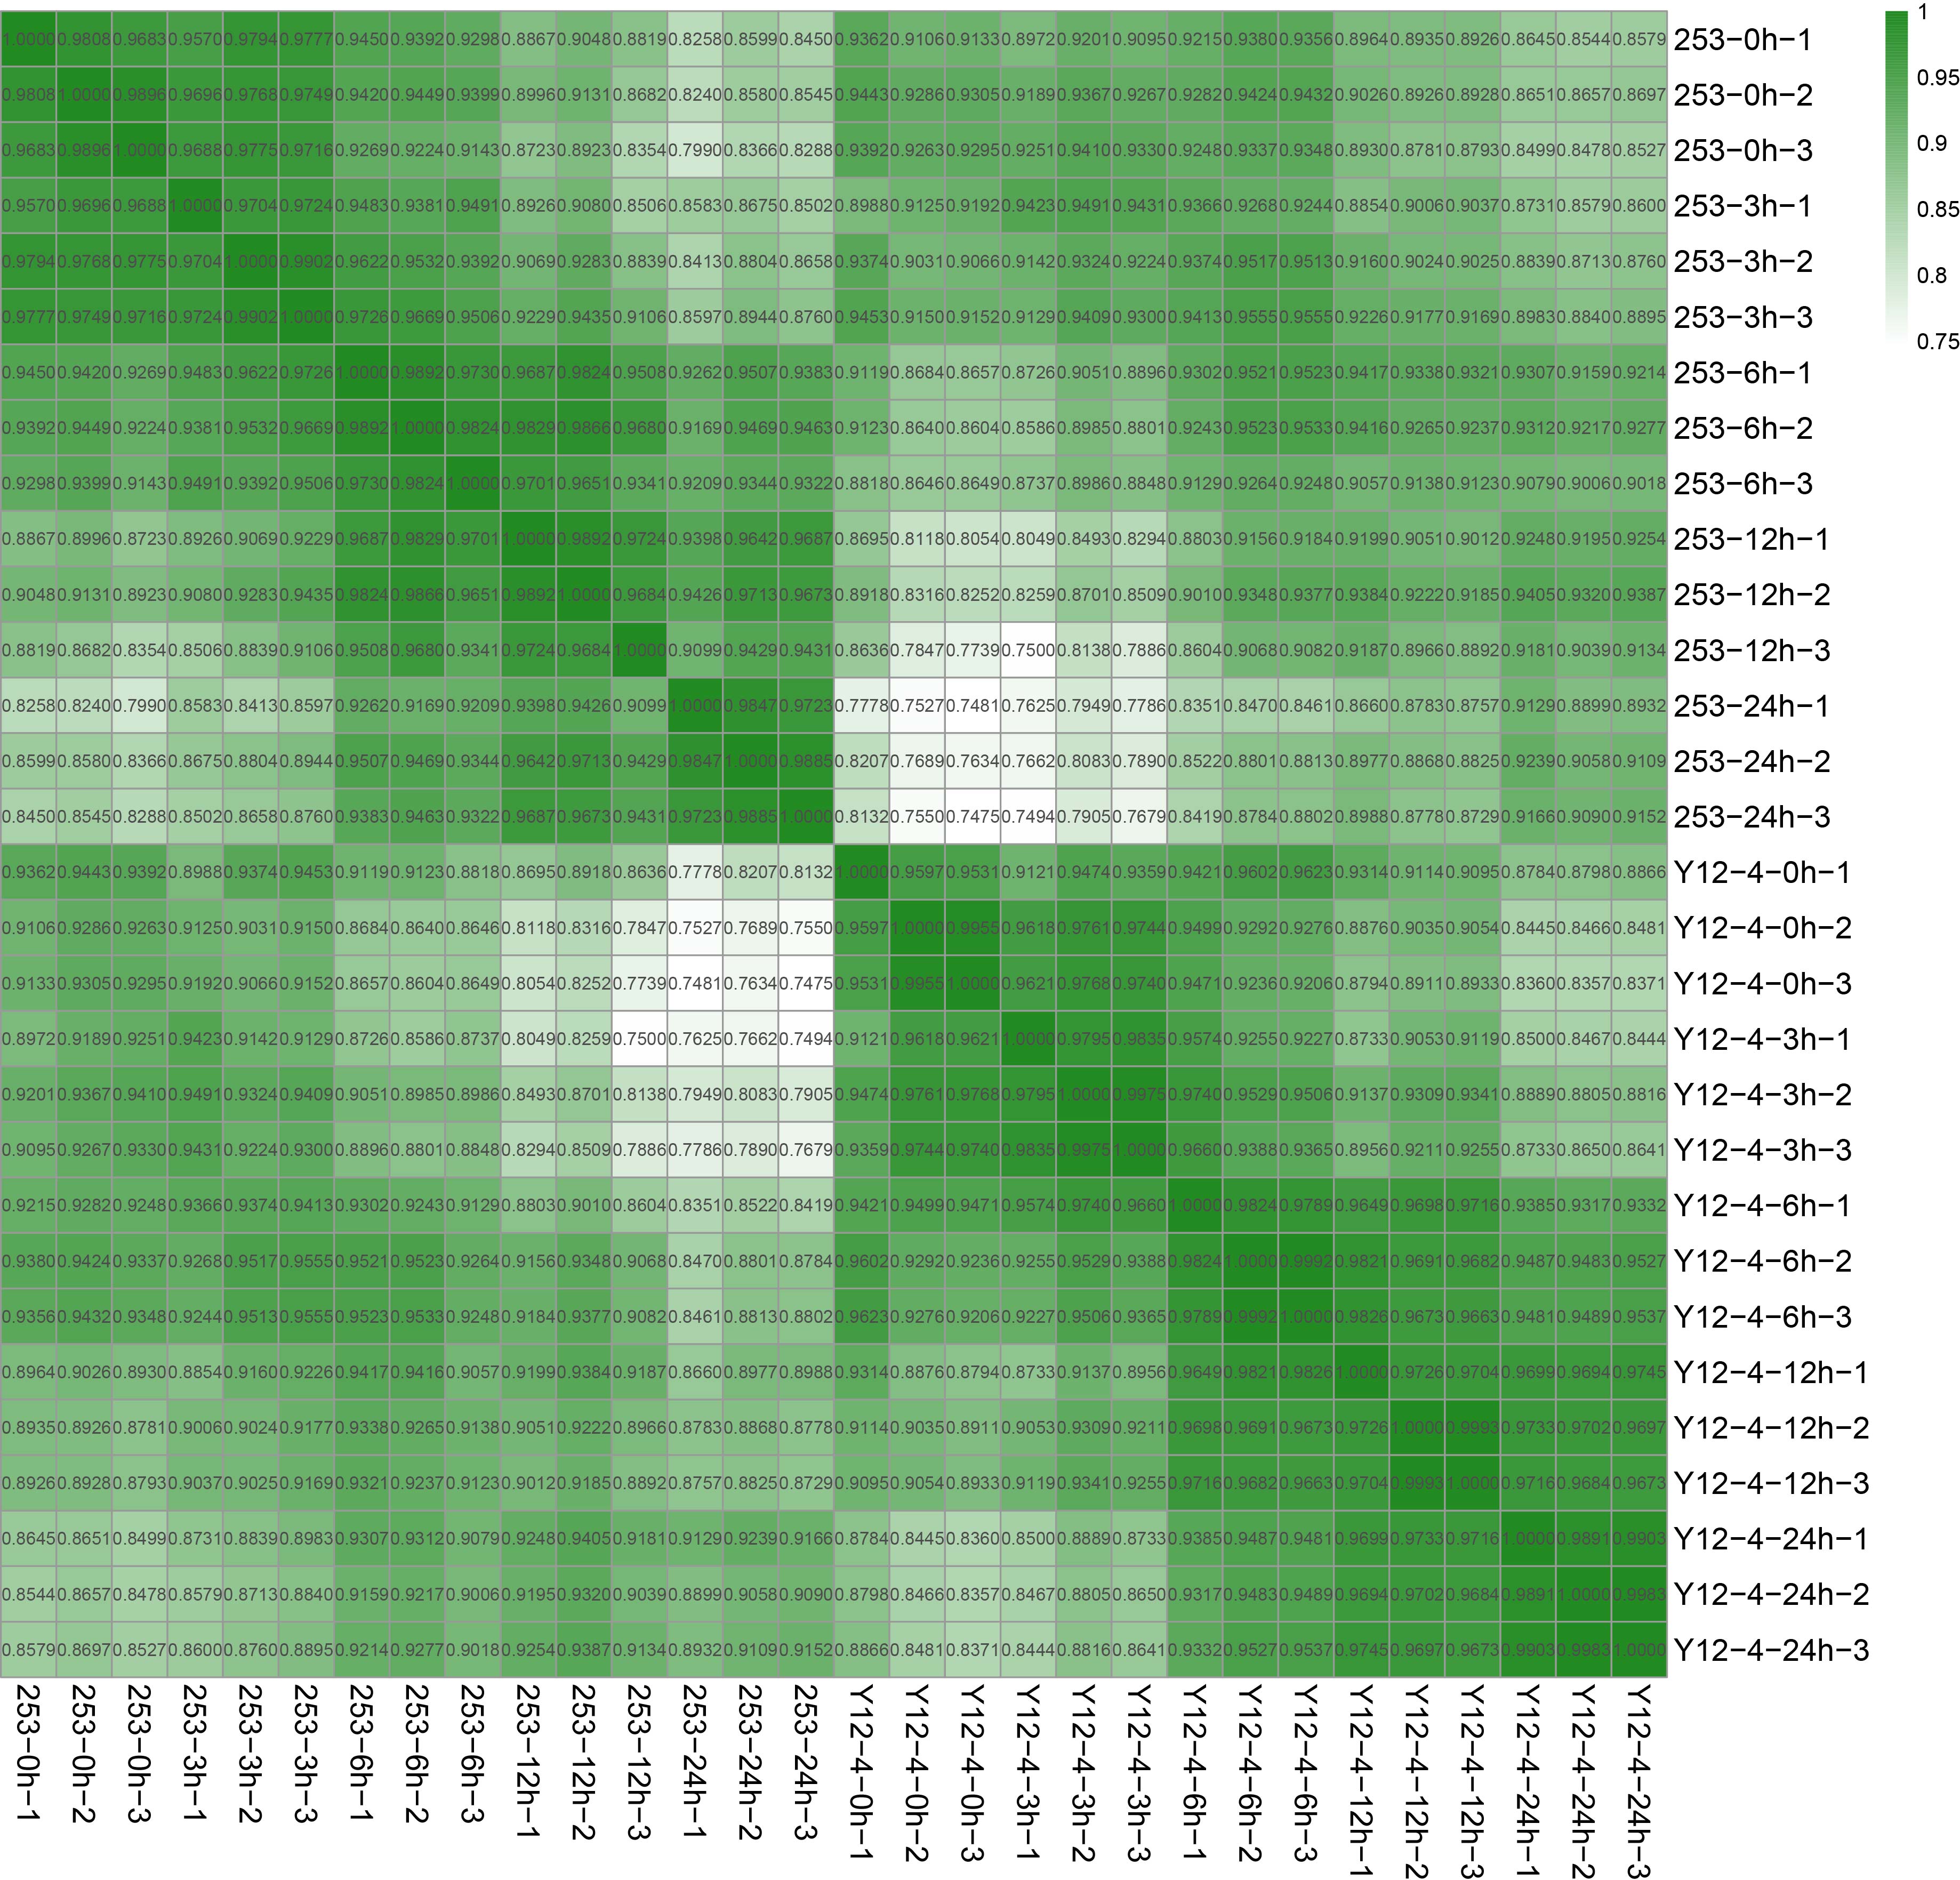
Clean reads were collected from each sample, and a limited transcriptome that provides a profile of the transcript dynamics under cold stress was obtained. Cold (4 °C) conditions influenced gene expression and induced different kinds of rice at the global transcriptome level (Fig. 2a), indicating that cold induced an extensive activation of transcription. Moreover, principal component analysis revealed a different activation of gene networks involved in cold-induced responses between 253 and Y12-4 (Fig. 2b). PC1 (49.9%) and PC2 (18.4%) explained 68.3% degrees in 30 variables. Correlation analysis indicated large differences among the sample treatments (Supplementary Fig. 1).
High-throughput sequencing generated 42.44–68.71 M 100 bp paired-end reads from each library (Table 1). A total of 31 577 genes were defined as known genes (84.53% of the total model 37 358 genes). After filtering out new transcripts shorter than 200 bp and those with only one exon, 2238 transcripts were predicted as new genes. RNA-Seq results showed that 577 (451 upregulated/126 downregulated), 4949 (1524 upregulated/3425 downregulated), 8393 (2054 upregulated/6339 downregulated), and 12010 (2811 upregulated/9199 downregulated) DEGs were found in rice buds after 3, 6, 12, and 24 h in 253 under the same cold conditions, whereas 2310 (1373 upregulated/937 downregulated), 4309 (1694 upregulated/2615 downregulated), 7677 (2576 upregulated/5101 downregulated), and 11 296 (3266 upregulated/8030 downregulated) DEGs were found in rice buds after 3, 6, 12, and 24 h in Y12-4 (Fig. 3). Notably, more upregulated genes were found in cold-tolerant Y12-4 than in cold-sensitive 253 at 3, 6, 12, and 24 h. Y12-4 had fewer downregulated DEGs than upregulated DEGs after 3 h than at other stages. The results indicated that more genes were upregulated actively in response to LT stress in Y12-4. The 253 and Y12-4 genotypes at the germination stage were subjected to cold (4 °C) for 0, 3, 6, 12, and 24 h. Cold treatment affected the global patterns of gene expression. Under cold stress, 253 and Y12-4 showed 1128 and 1401 differentially expressed transcripts, respectively (Fig. 4a and 4b).
To identify the gene expression patterns, we performed hierarchical clustering of DEGs for the two rice lines under cold treatment at 0, 3, 6, 12, and 24 h according to the log2 (fold change) values >1 and corrected P-value < 0.05 (Fig. 5). RNA-Seq data analysis revealed 4566 and 4220 DEGs in 253 and Y12-4, respectively (Tables S1 and S2). The complex transcriptional response pattern to early cold stress in 253 and Y12-4 can be visualized by hierarchical clustering. In addition to the remarkably increased number of upregulated and downregulated genes after cold treatment, the expression ratio also changed considerably between 253 and Y12-4 relative to the control, as indicated by the heatmap analysis (Fig. 5). Long-term exposure (24 h) to cold stress increased the number of regulated genes. Few genes supported the basic mechanism in both varieties, but several distinct genes responded to LT in 253 and Y12-4.
Co-expressionnetworkanalysisfor identification ofcold-relatedDEGs
To identify genes related to cold treatment in rice, we performed a weighted gene co-expression network analysis (WGCNA) of all genes. The analysis identified 18 WGCNA modules in 253 and 14 WGGNA modules in Y12-4 (Fig. 6a and 6b). The P value and color gradation of the two modules showed the correlation between the modules. To identify the connectivity of genes related to CT, we performed a heatmap using Student’s t test. The gene eigenvalue of the module showed the comprehensive expression level of module in the samples. A total of 3970 and 5829 genes were found in the “brown” modules of 253 and Y12-4, respectively. Moreover, 1962 genes were found in the two “brown” modules. A total of 218 genes were included in the pathways, including amino acid metabolism, biosynthesis of other secondary metabolites, carbohydrate metabolism, energy metabolism, environmental adaptation, folding, sorting and degradation, translation, signal transduction, membrane transport, nucleotide metabolism, and lipid metabolism. Such genes regulated important pathways for rice adaptation to LT.
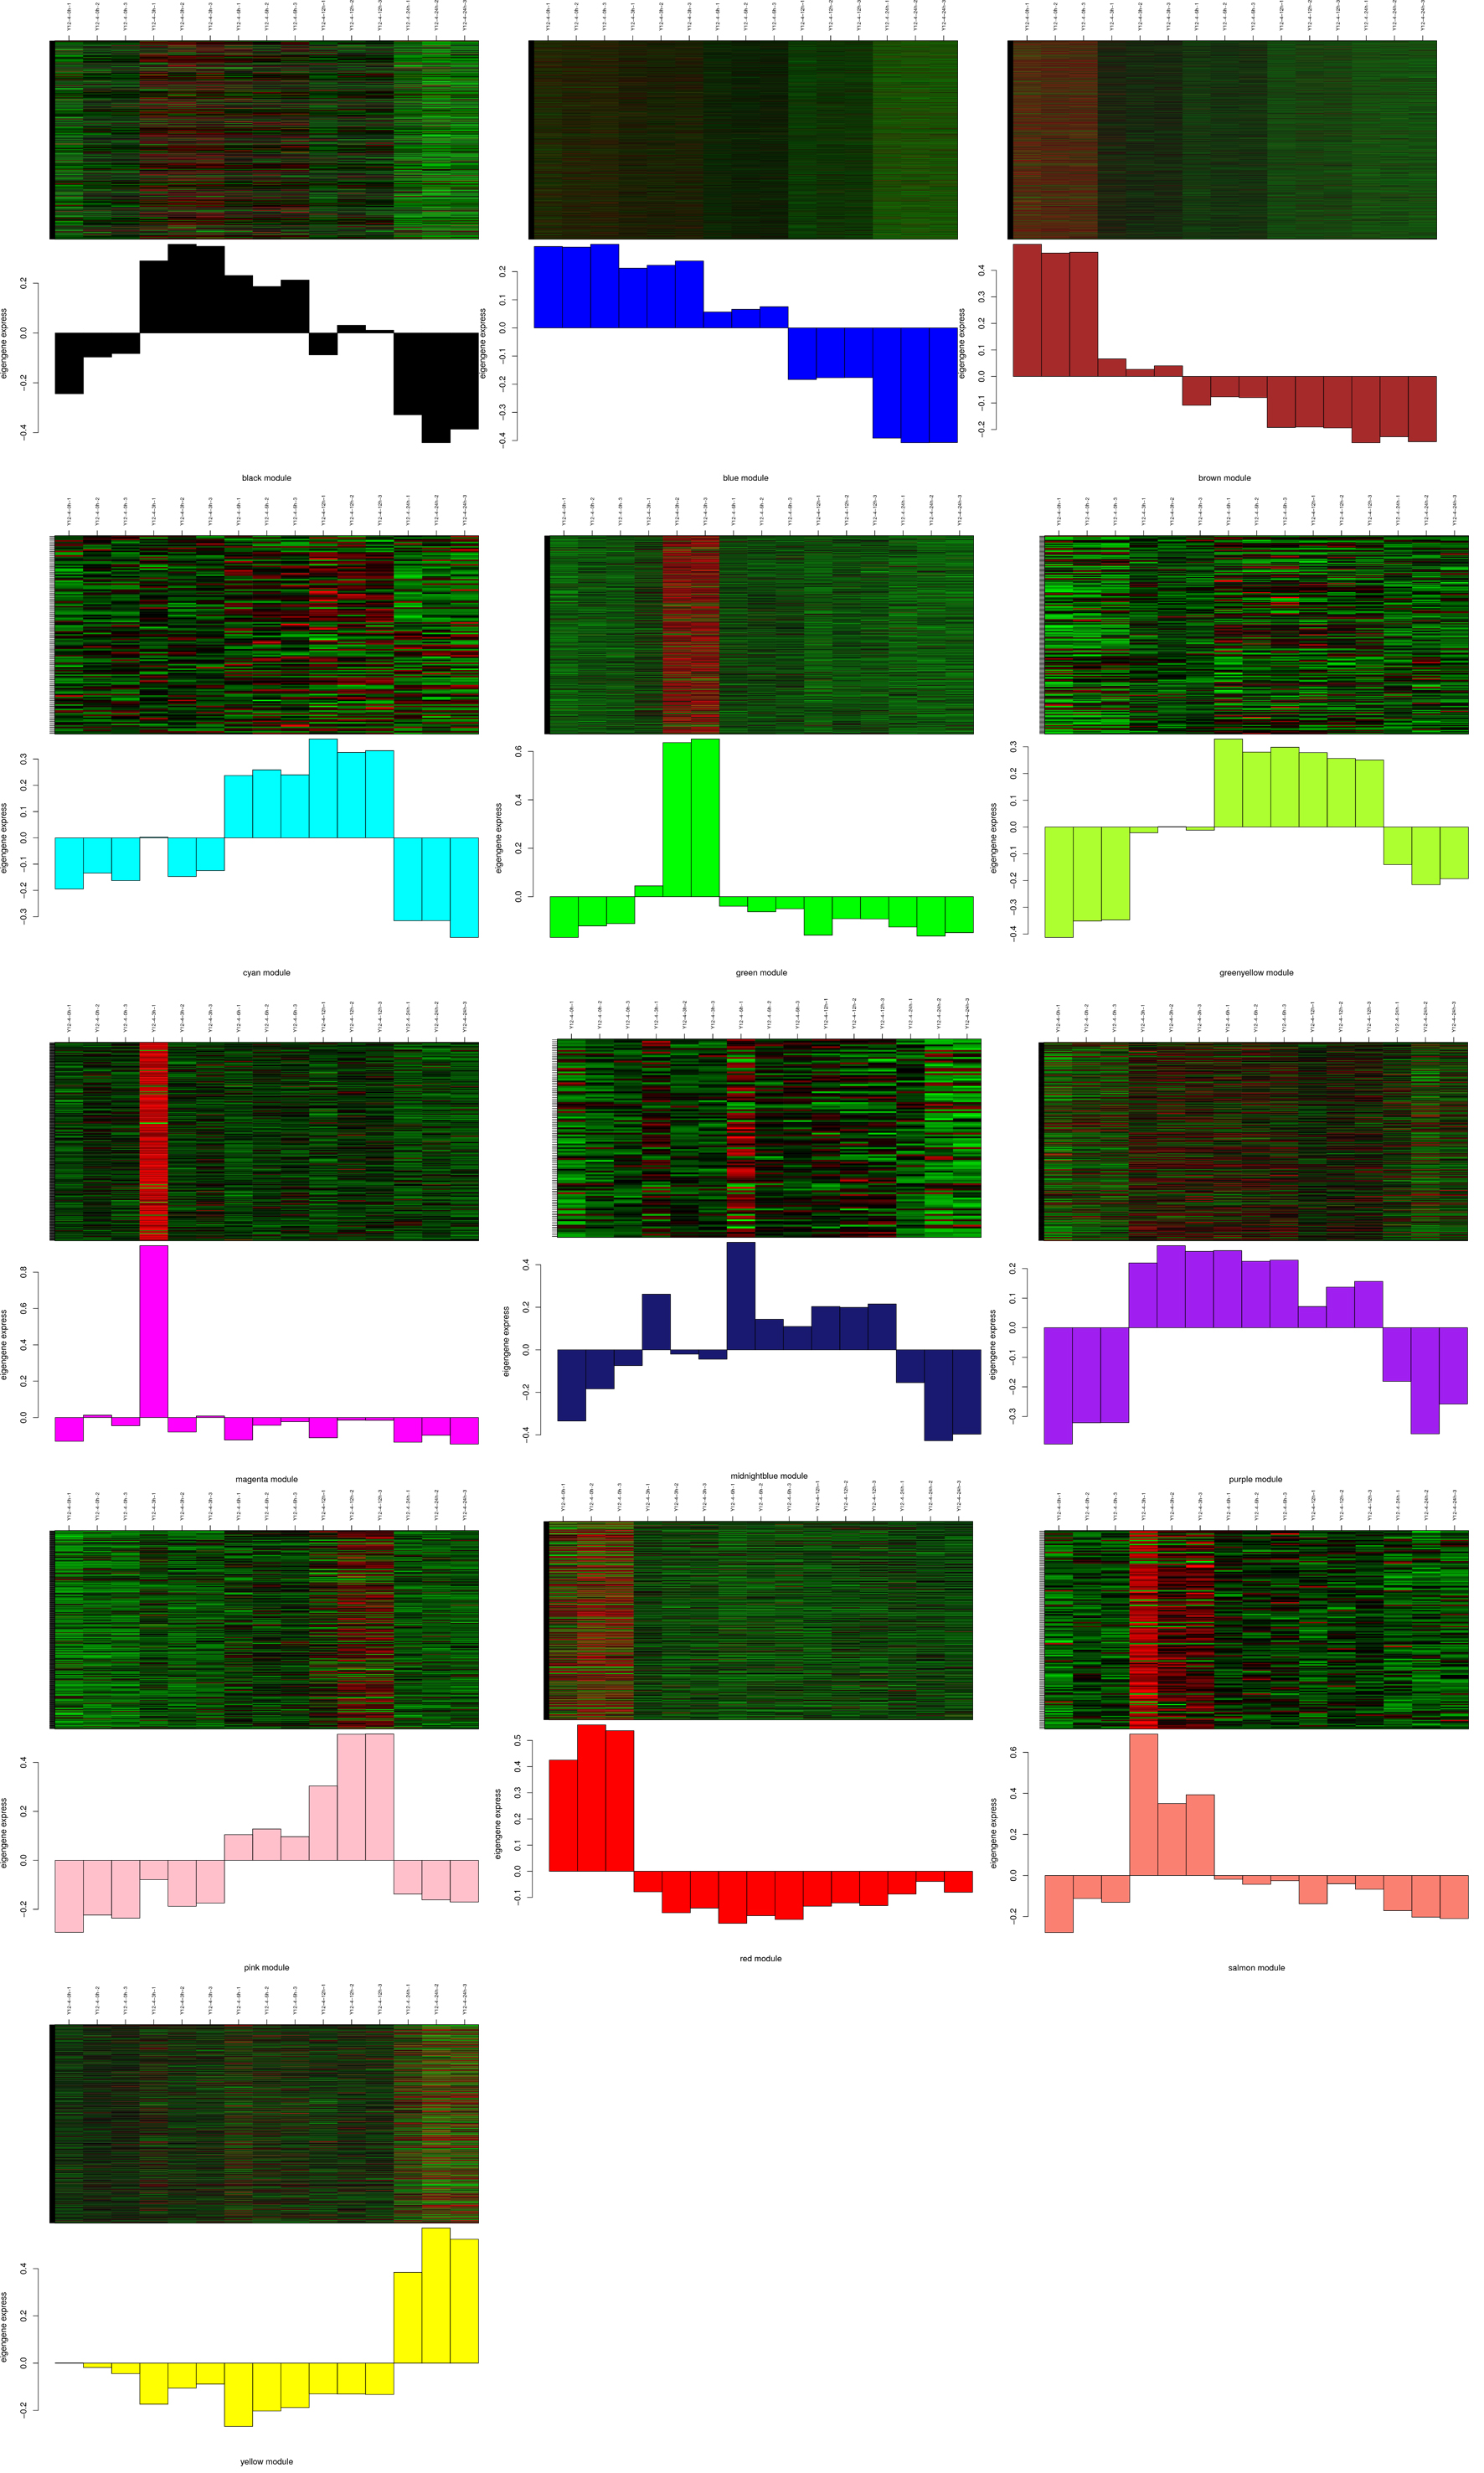
Three modules showed a positive correlation (r =0.56, r = 0.35 and r = 0.43 for yellow, greenyellow, and pink, respectively) with cold stress, indicating that genes in these modules positively regulate cold stress in Y12-4 (Fig. 6c). Seven modules had a negative correlation (r =-0.98, r =-0.92, r = -0.63, r =-0.926, r =-0.33, r = -0.32, and r = -0.46 for blue, brown, red, magenta, salmon, green, and black, respectively) with cold stress, suggesting that the genes in these modules negatively regulate cold stress in Y12-4 (Fig. 6c). In the yellow module, the gene expression levels were upregulated under cold stress in 24 h but downregulated in 0, 3, 6, and 12 h. In the greenyellow and pink modules, the gene expression levels were upregulated under cold stress in 6 and 12 h but downregulated in 0, 3, and 24 h. In the blue module, the gene expression levels were upregulated under cold stress in 0, 3, and 6 h but downregulated in 12 and 24 h. In the brown module, the gene expression levels were upregulated under cold stress in 0 and 3 h but downregulated in 6, 12, and 24 h. In the red module, the gene expression levels were upregulated under cold stress in 0 h but downregulated in 3, 6, 12, and 24 h. In the salmon module, the gene expression levels were upregulated under cold stress in 3 h but downregulated in 0, 6, 12, and 24 h. In the black module, the gene expression levels were upregulated under cold stress in 3, 6, and 12 h but downregulated in 0 and 24 h(Supplementary Fig. 3).
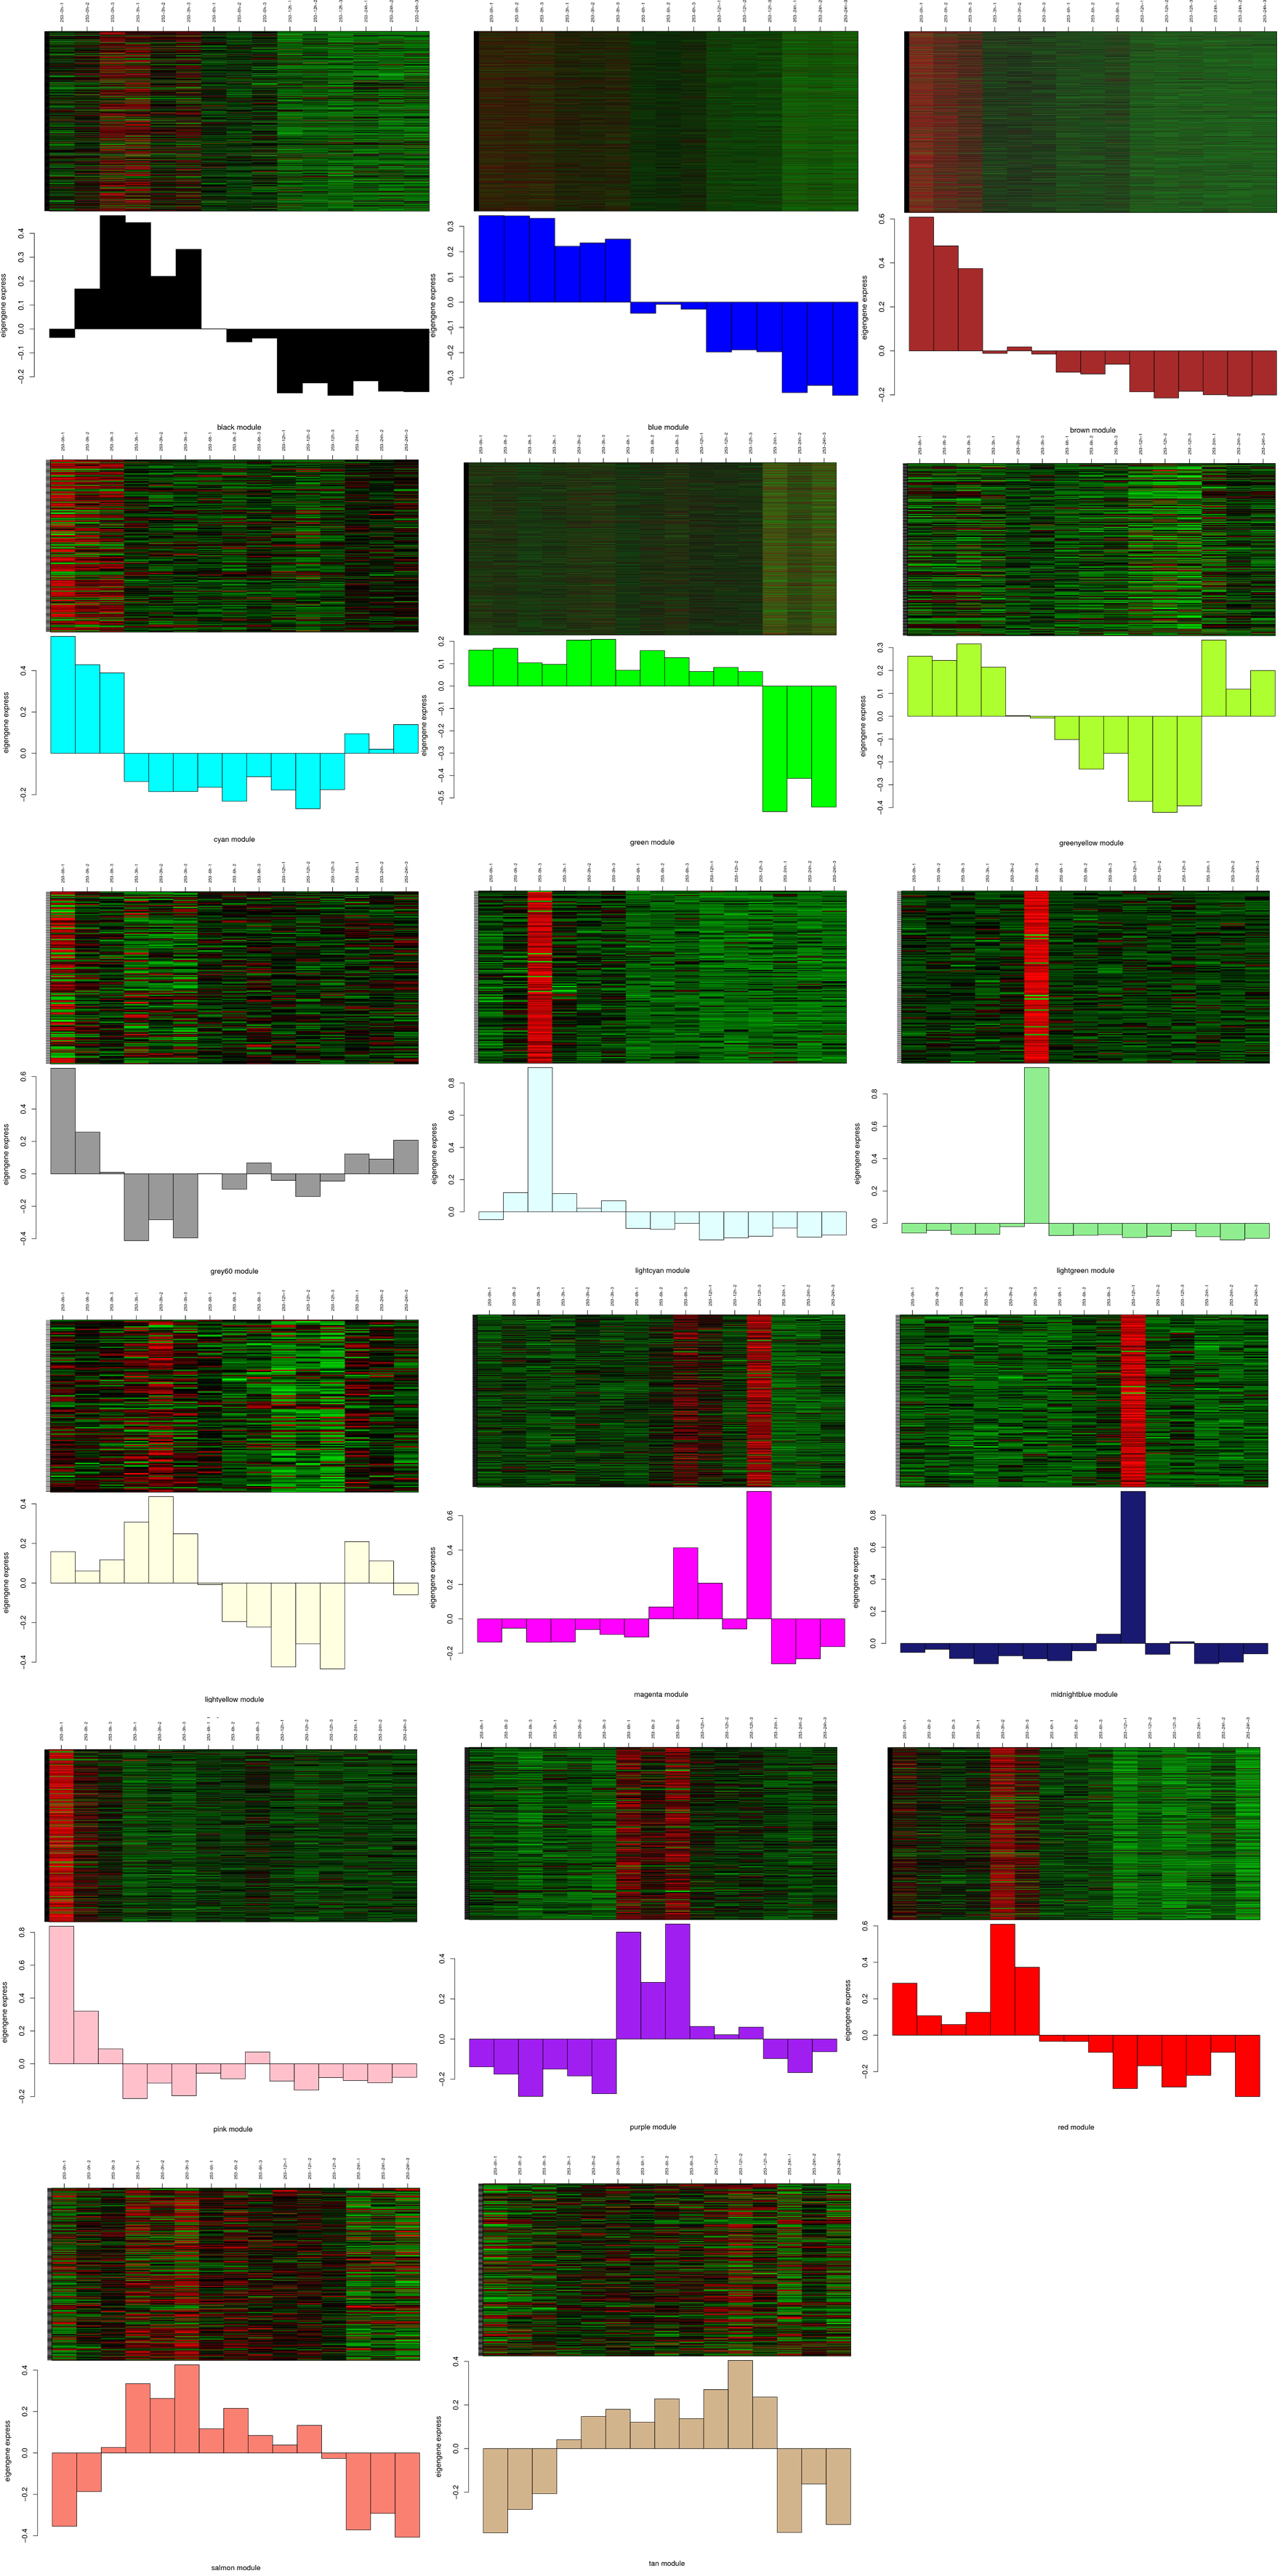
Four modules had a positive correlation (r =0.091, r = 0.17, r = 0.095, and r = 0.24 for tan, midnightbule, magenta, and purple, respectively) with cold stress, indicating that tge genes in these modules positively regulate cold stress in 253 (Fig. 6d). Twelve modules had a negative correlation (r =-0.43, r =-0.86, r = -0.53, r =-0.32, r =-0.42, r = -0.63, r = -0.74, r = -0.81, r = -0.99, r = -0.24, r = -0.77, and r = -0.36 for cyan, brown, pink, greenyellow, lightyellow, lightcyan, red, black, blue, lightgreen, green, and salmon, respectively) with cold stress, suggesting that the genes in these modules negatively regulate cold stress in 253 (Fig. 6d). In the lightgreen module, the gene expression levels were upregulated under cold stress in 24 h but downregulated in 0, 3, 6, and 12 h. The 253 genotype showed more negative modules than Y12-4. The positive modules exhibited more positive correlation in Y12-4 than in 253. The result suggests that Y12-4 is a tolerant variety (Supplementary Fig. 4).
In the present study, we classified genes COLD1, CTB4a, LTG1, ctb1, ICE1 in the blue module; qLTG3-1 in the brown module; CBF1 and CBF3 in the purple module; and CBF2 in the greenyellow module in Y12-4[10, 23-25, 37]. However, LTT7 was absent in all modules in Y12-4. This results suggests that the genes in the blue, brown, purple, and greenyellow modules are involved in CT. KEGG analysis revealed that the common enriched metabolic pathways are “response to stimulus” and “signaling.” The genes in the blue, brown, purple, and greenyellow modules contributed to CT-related metabolites and plant hormones. The gene response to cold positively correlated with the greenyellow module as detected by WGCNA. CBF2(Osl_21453) is an important transcription factor that regulates the downstream gene response to LT (Fig. 6e).
EnrichmentofGOtermscomparingtolerantandsensitivetranscriptomes
Enriched categories comparing each dataset were searched using GO terms to compare the transcriptomes of germinating seeds from both genotypes (Fig. 7). The GO assignment system was used to obtain functional information for the DEGs, a procedure that can assist in understanding the distribution of gene functions at the macro level. All genes were assigned into three primary GO categories: biological process, cellular component, and molecular function. Thirty-four terms were differentially enriched. Most of the terms enriched in the cold-tolerant dataset in Y12-4-0h vs. Y12-4-3h showed upregulated genes, except for rhythmic process, cell junction, and membrane-enclosed lumen. In addition, biological regulation, celluar process, localization, metabolic processs, response stimulus, single-organism process, cell part, extracellular matrix extracellular matrix component membrane, membrane part, organelle, binding, catalytic activity, molecular function regulator, and nucleic acid binding transcription factor activity indicated more upregulated genes than downregulated genes. All terms showed more downregulated genes than upregulated genes, except for structural molecule activity in 253-0h vs. 253-3h. Moreover, the model where upregulated genes were greater in number than downregulated genes can be constantly decreased with time when such genes received the same LT stress. The growth, immune system process, metabolic process, molecular function regulator, nucleic acid binding transcription factor activity, and signal transducer activity displayed more upregulated than downregulated genes in Y12-4-0h vs. Y12-4-6h. Biological regulation, immune system process, extracellular region part, molecular function regulator, and nucleic acid binding transcription factor activity revealed a uniform trend in 253-0h vs. 253-6h. The growth, nucleic acid binding transcription factor activity, signal transducer activity, and structural molecular activity uncovered more upregulated genes in Y12-4-0h than in Y12-4-12h. Immune system process and extracellular region part revealed a uniform trend in 253-0h vs. 253-12h. Rhythmic process and extracellular region part displayed more upregulated genes in Y12-4-0h than in Y12-4-24h. Nucleic acid binding transcription factor activity and extracellular region part revealed more upregulated genes in 253-0h than in 253-24h. These terms could be related to known cold-induced processes, such as increased cellulose synthesis, accumulation of unsaturated membrane lipids, osmoregulation, and antioxidant defense activation (Fig. 7).
Annotations were assigned to each transcript and gene by BlastX search against the plant protein collections of four public databases (NR, Swiss-Prot, KEGG, and KOG), with 36 being enriched in the cold-tolerant germination and 53 in the cold-sensitive germination at 0 h vs. 3 h, 61 being enriched in the cold-tolerant germination and 70 in the cold-sensitive germination at 0 h vs. 6 h, 53 being enriched in the cold-tolerant germination and 75 in the cold-sensitive germination at 0 h vs. 12 h, and 81 being enriched in the cold-tolerant germination and 54 in the cold-sensitive germination at 0 h vs. 24 h (Fig. 7).
Interestingly, the terms “carbohydrate metabolic process,” “lipid metabolic process,” “transport,” “ion transport,” “immune response,” “phospholipid binding,” “glucuronosyltransferase activity,” and “antioxidant activity” were found in the cold-tolerant dataset but not in the cold-sensitive dataset at 0 h vs. 3 h. Thus, these mechanisms were potentially involved in the CT observed in the tolerant genotype. Among the terms enriched in the cold-sensitive dataset, “lipid transport” and “defense response to other organism” were observed at 0 h vs. 3 h.
Among the terms enriched in the cold-tolerant dataset, “lipid transport” and “response to oxidative stress” were observed at 0 h vs. 6 h. Among the terms enriched in the cold-sensitive dataset, “defense response” and “response to external stimulus” were regulated many processes at 0 h vs. 6 h.
Among the terms enriched in the cold-tolerant dataset, “response to external stimulus,” “regulation of response to biotic stimulus,” and “oxidoreductase activity” existed at 0 h vs. 12 h. In the cold-sensitive dataset, “defense response,” “response to external stimulus,” and “oxidoreductase activity” were found at 0 h vs. 12 h.
Among the terms enriched in the cold-tolerant dataset, “membrane protein complex” and “response to external biotic stimulus” were observed at 0 h vs. 24 h. Among the terms enriched in the cold-sensitive dataset, “oxidoreductase activity” was observed at 0 h vs. 24 h. The data obtained provided indications of processes that might be involved in the CT mechanism of Y12-4 germination. The cold-tolerant ones triggered other mechanisms that were more efficient in conferring CT. These results might reflect the distinct nature of chilling stress responsiveness in the tolerant and sensitive genotypes. From the 3 h as early-response genes to 12 and 24 h as late-response genes, the genes that regulated the pathway were dynamic and continuous processes. The different GO terms between the tolerant and sensitive genotypes were determined in the 253 and Y12-4.
Pathwayenrichmentindifferentgenotypes
The pathway of gene regulation was a dynamic and continuous process. Pathway enrichment is extensively applied to understand the biological progress of rice response to LT. Therefore, we analyzed the pathway enrichment in the terms in 253 and Y12-4. In particular, phemylpropanoid biosynthesis was the most important enrichment among all terms, except in 253-0h vs. 253-3h (Supplementary Fig. 2). With the extension of cold treatment time, the number of genes of signal transduction pathway increased (Supplementary Fig. 2). In addition, a considerable number of genes was found in the metabolic pathways in 253-0h vs. 253-6h. However, the number of genes in the single pathway in Y12-4-0h vs. Y12-4-24h was greater than that in the three other terms in Y12-4 (Supplementary Fig. 2). For genes enriched to plant hormone signal transduction, the important pathway under cold treatment was dropped gradually to top 20 of pathway enrichment in 253. The plant hormone signal transduction pathway was the top 1 in 253-0h vs. 253-3h but dropped to top 3, top 6, and top 13 in 253-0h vs. 253-6h, 253-0h vs. 253-12h, and 253-0h vs. 253-24h, respectively. The Q-value dropped as the time decreased. However, the plant hormone signal transduction pathway was the top 2 in Y12-4-0h vs. Y12-4-3h but dropped to top 3, top 3, and top 9 in the Y12-4-0h vs Y12-4-6h, Y12-4-0h vs Y12-4-12h, and Y12-4-0h vs Y12-4-24h, respectively(Supplementary Fig. 2). The Q-value showed close correlation under cold treatment until 12 h. These results suggested that LT caused dynamic changes in pathway and different regulated genes in the two genotypes. These data suggested that the plant hormone signal transduction was maintained at a high level in Y12-4. Moreover, LT caused the upregulation of brassinosteroid biosynthesis in cold-tolerant germination. The cold-tolerant germination can maintain plant hormone signal transduction under LT more efficiently than the cold-sensitive germination.
ValidationofRNA-seqdatabyqRT-PCR
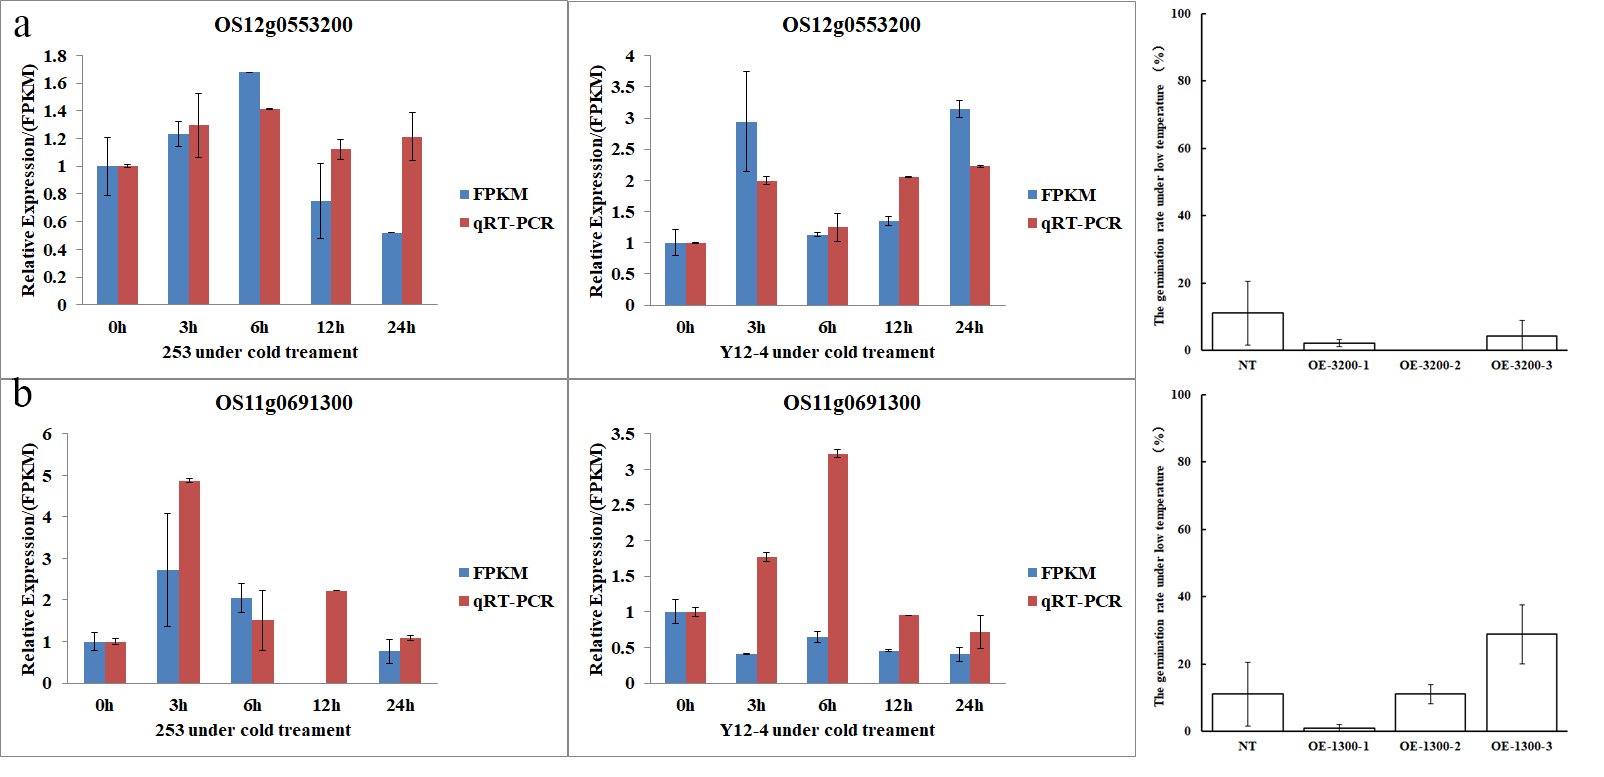
Seven genes with remarkably altered expression were analyzed by qRT-PCR to validate the RNA-seq data results. All of these genes were predicted to be related to CT, and functional annotations of these genes are listed in Table S3. The expression patterns of Os01g0695700, Os07g0515100, Os05g0149400, Os12g0576600, Os11g0523700, Os02g0312600, and Os02g0535400 showed similar expression patterns in the qRT-PCR analysis as in the RNA-Seq analysis. This result indicated the validity of the RNA-seq study(Fig.8).
LTG5cloningandsequenceanalysis
Basing from the nucleotide polymorphisms identified by RNA-Seq, we selected three genes from the WGCNA brown and greenyellow modules with high relative expression and different expression patterns between 253 and Y12-4 for cloning and functional indetification. The results of WGCNA imply that CBF2 regulates LTG5 in the greenyellow module (Supplementary Fig. 5). LTG5 was responsible for encoding UDP-glucosyltransferase and for the sensitivity to LT from the greenyellow module in Y12-4. One pair of primers (Appendix S1 in Supplementary materials) was designed to amplify LTG5 ORFs from “Y12-4” (Appendix S2) of O.rufipogonGriff. on the basis of other available Nipponbare LTG5 nucleotide sequences (Genbank accession: ORUFI05G24900.1). One SNP and one Indel were found in the promoter region of ORUFI05G24900.1 between Y12-4 and 253. The expression of LTG5 in Y12-4 played an important role on CT at the germination stage (Fig. 9).
LTG5regulatesCTatthegerminationstage
Several experiments were conducted to estimate the the function of LTG5. First, an overexpression line containing the LTG5 from Y12-4 driven by the 35S promoter from tobacco cauliflower mosaic virus (CaMV35S) was separately introduced into 253. Reverse-transcription PCR indicated that independent T0 transgenic lines showed different expression levels of LTG5, and the gene expression in T3 lines was also verified by qRT-PCR. Three overexpression transgenic lines of each LTG5 were used for further analyses. OE-LTG5 showed stable and evidently enhanced CT compared with non-transgenic lines (NT) under LT conditions. Compared with the NT, the germination rates of OE-LTG5-1, OE-LTG5-2, and OE-LTG5-3 under LT enhanced by 96.97%, 61.11%, and 37.78%, respectively (Fig. 9). In the leaf of OE-line, bulliform and parenchymal cells were broken, but mesophyll tissue, vascular bundle, and mechanical tissue retained their structure and morphology under cold stress. However, bulliform cell, mechanical tissue, and parenchymal cell were broken in the leaf of NT (Fig. 9).
LTG5expressionpatternandsubcellularlocalizationofitsgeneproduct
The expression of LTG5 was detected in various tissues by fluorescence quantification to detect the temporal and spatial expression patterns of LTG5.
The expression of LTG5 was detected in many rice tissues used for qRT-PCR to confirm the spatial expression patterns of LTG5 (Fig. 10). LTG5 was widely expressed in several rice tissues, such as the sheath, leaf, stem, root, spike, node, neck, seed, flag leaf, and tiller tissues. The highest expression of LTG5 was detected in the seeds (Fig. 10). LTG5-green fluorescent protein (GFP), a fusion protein, was expressed under the control of the 35S promoter in rice leaf protoplasts to ensure the subcellular localization of LTG5. As shown in Fig. 10b, the GFP fluorescence in 35S:LTG5-GFP transgenic protoplast cells was observed exclusively in the membrane. As such, this result suggests that LTG5 is a membrane and nucleus-localized protein, consistent with its proposed function in regulating growth and development in rice.
