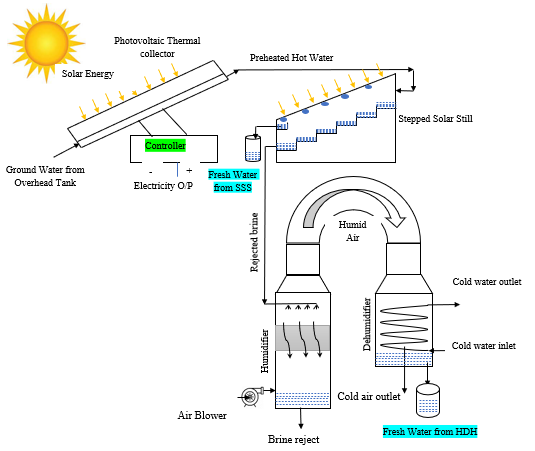
The present research aimed at the experimental evaluation of the proposed hybrid PVT-SSS-HD desalination unit operated at 1.5, 2.0, 2.5 and 3 litres per minute of saline water flow. The influence of heat recovery by the thermal absorber on PV efficiency, SSS and HD productivity is investigated in detail. The observations measured during experimentation are analyzed for the overall performance of the hybrid system. Further, the energy, exergy, environmental and economic evaluation of the system are discussed.
The daily average values of meteorological conditions for the experimental days are tabulated in Table 3.
Table 3
The ambient conditions on the experimental days
| Mass flow rate (LPM) | Experimental day | Sky conditions | Average Solar radiation (W/m2) | Average Wind Velocity (m/s) | | Average ambient temperature (°C) | Average relative humidity (%) |
| 1.5 | 15/05/2023 | Clear | 610.48 | 1.77 | | 38.18 | 46.54 |
| 2.0 | 16/05/2023 | Clear | 612.68 | 1.49 | | 38.16 | 47.09 |
| 2.5 | 18/05/2023 | Clear | 608.15 | 1.10 | | 37.82 | 47.23 |
| 3.0 | 19/05/2023 | Clear | 611.89 | 1.08 | | 37.16 | 49.97 |
Variation of solar radiation and atmosphere temperature for the experimental days of May 15th, 16th, 18th, and 19th, 2023 is shown in Fig. 3. The average daily solar intensity and atmosphere temperature of 610 W/m2 and 38°C are observed respectively for all the experimental days. It is also observed that the solar intensity is maximum during noon time and maximum temperature at 15.00 hours.
The stepped solar still base and cover glass temperatures influence the evaporation and condensation of saline water. The hourly temperature change of stepped solar still cover glass, basin water and the ambient temperatures measured on experimentation days for the flow rates of 1.5, 2.0, 2.5 and 3 LPM is depicted in Fig. 4. The average basin water temperature is higher on all three days except the 19th May 2023 for the water flow rate of 3.0 LPM. The glass cover's average temperature range is the same for all three days except 19th May 2023 and the average ambient temperature is less for 18th May 2023 compared to other days.
Figure 5. depicts the variation of air temperature at the inlet and outlet of the humidifier and dehumidifier of the HD system for respective saline water flow rates of 1.5, 2.0, 2.5 and 3 LPM. It is observed from the Fig. 5 that the peak temperature of air attained in the HD system is about 52.5°C at 2:00 PM for a flow rate of 3.0 LPM on 19th May 2023. Further, the air leaving the dehumidifier has a lower temperature than the ambient for 2.5 LPM and 3.0 LPM flow rates, because due to low cooling water temperature from the overhead tank.
Figure 6. depicts the potable water productivity from the hybrid PVT-SSS-HD desalination unit. It is observed that the freshwater productivity of the hybrid system is around 2210 ml, 1920 ml, 1710 ml, and 1370 ml for a unit square meter area respectively for saline water flow rates of 1.5, 2.0, 2.5, and 3.0 LPM. For all the days of experimentation, the maximum productivity is observed during the noon time of the day due to the higher solar radiation and the heat accumulation.
The influence of hourly accumulated freshwater in the PVT-SSS system is indicated in Fig. 7. which depicts that it is increased from morning till the evening. The pace of productivity increase is higher during the noon time of the days when compared to morning and evening for all the days of experimentation. Also, the accumulated freshwater yield is higher for lower saline water flow rates than the higher flow rates. This is because at higher saline water flow the averaged water temperature is reduced and hence reduced evaporation in the stepped solar still.
Figure 8. shows the hourly variation of freshwater productivity of the HD desalination unit. It is observed from Fig. 8 that the freshwater yield of the HD system increases from the morning till noon and then it decreases for all flow rates. Higher flows of saline water enhance the air humidification rate for the given flow, hence the higher freshwater yield. A freshwater yield of 4190 ml, 5020 ml, 5670 ml and 6085 ml are observed respectively for a unit meter square solar area for the saline water flow rates of 1.5, 2.0, 2.5, and 3.0 LPM.
The influence of hourly accumulated freshwater yield in a humidification-dehumidification system is indicated in Fig. 9. for different flow rates. This follows the same trend as shown in Fig. 7. for stepped solar still, however, it is observed that accumulated yield is increased with higher flows compared to lower flows due to the aforementioned reason.
Hourly electricity generation and its efficiency for the reference PV and PVT panels are shown in Fig. 10. and Fig. 11. for the experimentation days. Electricity generation and its efficiencies are increased from morning till noon and then decrease because the solar radiation is lower in the morning and evening whereas it is maximum during the noon time. The difference between electrical output and efficiency for PV and PVT panels is maximum during noon time and is negligible during morning and evening. This is due to higher heating of the reference PV at noon time, whereas the PVT will transfer the heat to the circulating cooling water and hence the PVT panel is at a lower temperature than the reference PV panel. It is also observed that among all the flow rates, 2.0 LPM gives better electrical power output and 2.5 LPM gives better electrical efficiency. This is due to the change in solar radiation and ambient temperature between the days of experimentation. The average electric power generation from PV and PVT panels for the experimentation days are observed as 91.63, 98.78, 95.72 & 94.85 Watts and 90.43, 97.83, 94.12 & 93.56 Watts respectively. Also, the respective average electrical efficiency from PV and PVT panels for the experimentation days is observed as 15.15%, 15.79%, 15.8% & 15.65% and 14.96%, 15.62%, 15.54% & 15.43%. To conclude, the PV panel electricity generation can be increased by providing cooling and it is observed that an average increase in power generation and electrical efficiency is 1.3 W and 0.2% respectively.
The change in hourly thermal efficiency for the SSS-HD system is depicted in Fig. 12. The thermal efficiency of the SSS-HD system increases from morning till noon and then it decreases because it follows the trend of solar radiation on any day. For higher saline water flow rates, the overall freshwater production is higher, and hence enhanced thermal efficiency. Further, the average thermal efficiency of SSS-HD is observed as 46.0%, 47.51%, 52.62%, and 52.34% respectively for the considered saline water mass flow rates.
Figure 13. depicts the combined PVT-SSS-HD system’s hourly overall efficiency which is a combination of the electrical efficiency of PVT and the thermal efficiency of combined SSS-HD systems. From Fig. 13. it is noticed that the overall efficiency of PVT-SSS-HD is 61.10%, 63.30%, 68.43%, and 68.00% respectively for various saline water flows.
Figure 14. shows the exergy efficiency for 1.5, 2.0, 2.5, and 3.0 LPM flow rates and it increases till noon time of the day and then it decreases. The exergy out from the system depends on the power and freshwater generation and exergy in depends on the ambient and Sun temperature. The variation of exergy into the system for different flow rates is almost negligible and hence it follows the overall efficiency trend. Further, the PVT-SSS-HD average exergy efficiency is observed as 17.16%, 17.5%, 17.6%, and 17.3% respectively for the mentioned flow rates.
The daily accumulated freshwater productivity of SSS, HD and PVT-SSS-HD systems are shown in Fig. 15. The productivity of SSS is reduced with an increase in saline water flow rates, but it is increased for the HD system. The decremental rate of productivity is less compared to the incremental rate hence the overall accumulated yield is increased for higher flow rates of saline water. Hybrid system can produce a maximum of 7.5 L/day at 2.5 LPM and a minimum of 6.2 L/day at 1.5 LPM per day. Similarly, SSS is most productive at lower mass flow rates, while HD systems are most productive at higher mass flow rates.
Figure 16. displays the gain output ratio change for the SSS, HD and the combined SSS and HD systems for different saline water flows. The findings demonstrate that the gain output ratio decreases for SSS, and it increases for both HD and combined SSS-HD configurations. Changes in the mass flow rate of saline water are shown to have a considerable impact on the system's performance. This is because higher hot saline water flow rates enhance the air humidification rate which leads to an increased freshwater yield. The system GOR is at its highest of 6.57 at 2.5 LPM and its lowest of 5.98 at 1.5 LPM, and the system's higher productivity accounts for its high gain output ratio.
To analyze the economic viability of the PVT-SSS-HD system, an enviro and economic study is conducted on the proposed hybrid system. Various influencing parameters on the economic analysis are displayed in Table 4 in USD. The annual water produced is a product of daily freshwater output and the number of days in the year. The computed results for the unit litre of freshwater cost 0.079, 0.073, 0.068 and 0.068 USD respectively from the hybrid system.
Table 4
Economic analysis of the PVT-SSS hybrid system
| Sl. No. | Description | Unit | Hybrid PVT-SSS-HD system |
| 1 | CRF | - | 0.154 |
| 2 | EAC | $/Year | 168.26 |
| 3 | ASV | - | 1.02 |
| 4 | AMC | $/Year | 16.826 |
| 5 | UAC | $/Year | 185.08 |
| 6 | CPL (1.5 LPM) | $/L | 0.079 |
| 7 | CPL (2.0 LPM) | $/L | 0.073 |
| 8 | CPL (2.5 LPM) | $/L | 0.068 |
| 9 | CPL (3.0 LPM) | $/L | 0.068 |
| *1 USD = ₹ 82.17 (20-06-2023) |
The embodied energy, CO2 emission and CO2 reduction during the lifetime of the system for respective flow rates are tabulated in Table 5. CO2 reduction of the proposed hybrid system is estimated as 3.87, 4.19, 4.48 and 4.53 tons for respective saline water flow rates.
Table 5
Environmental analysis of the PVT-SSS-HD hybrid system
| Sl. No. | Parameter | 1.5 LPM | 2.0 LPM | 2.5 LPM | 3.0 LPM |
| 1 | Lifetime(years) | 25 | 25 | 25 | 25 |
| 2 | Embodied energy(kWh) | 2612.75 | 2612.75 | 2612.75 | 2612.75 |
| 3 | Yearly energy generation(kWh/year) | 1551.75 | 1678.27 | 1793.85 | 1815.36 |
| 4 | CO2 emissions during lifetime(kg/year) | 209.02 | 209.02 | 209.02 | 209.02 |
| 5 | CO2 mitigation during lifetime(tons/year) | 77.58 | 83.91 | 89.69 | 90.76 |
| 6 | Net CO2 mitigation (ton CO2) | 3.87 | 4.19 | 4.48 | 4.53 |
Annual potable water productivity and the production cost of the present work are compared with the reported literature for validation is shown in Table 6. From the results listed in the table, the lowest freshwater cost per litre is observed in the proposed PVT-SSS-HD configuration for a saline water flow of 2.5 and 3.0 LPM. However, the highest productivity and costs are observed for the HD-PV-FPC combination because of the higher saline water temperatures provided by FPC. Further in PVT-SS-HD and solar concentrator combination, the productivity is more than the present study because of the solar concentrator. Hence optimum freshwater productivity at a reduced cost can be achieved by the proposed hybrid system using waste heat recovery and brine reuse.
Table 6
Validation of the present study with previous ones for freshwater productivity and economic analysis
| System description | Reference | Annual freshwater productivity (L/m2 ) | CPL (USD/L) |
| Cascade Solar still with HD | (Farshchi Tabrizi et al. 2016) | 1,971 | - |
| Solar still with PVT | (Shoeibi et al. 2023) | 424 | 0.084 |
| Solar still with HD | (Ghazy and Fath 2016) | 2,372 | - |
| HD-PV-FPC | (Deniz and Çınar 2016) | 3,913 | 0.0981 |
| PVT-SS-HD and Solar concentrator | (Mahmoud et al. 2018) | 3,285 | - |
| PVT-SSS-HD (1.5 LPM) | present study | 2,336 | 0.079 |
| PVT-SSS-HD (2.0 LPM) | present study | 2,533 | 0.073 |
| PVT-SSS-HD (2.5 LPM) | present study | 2,694 | 0.068 |
| PVT-SSS-HD (3.0 LPM) | present study | 2,719 | 0.068 |