2.1 Synthesis and characterization of AuNPs@POM@PEG
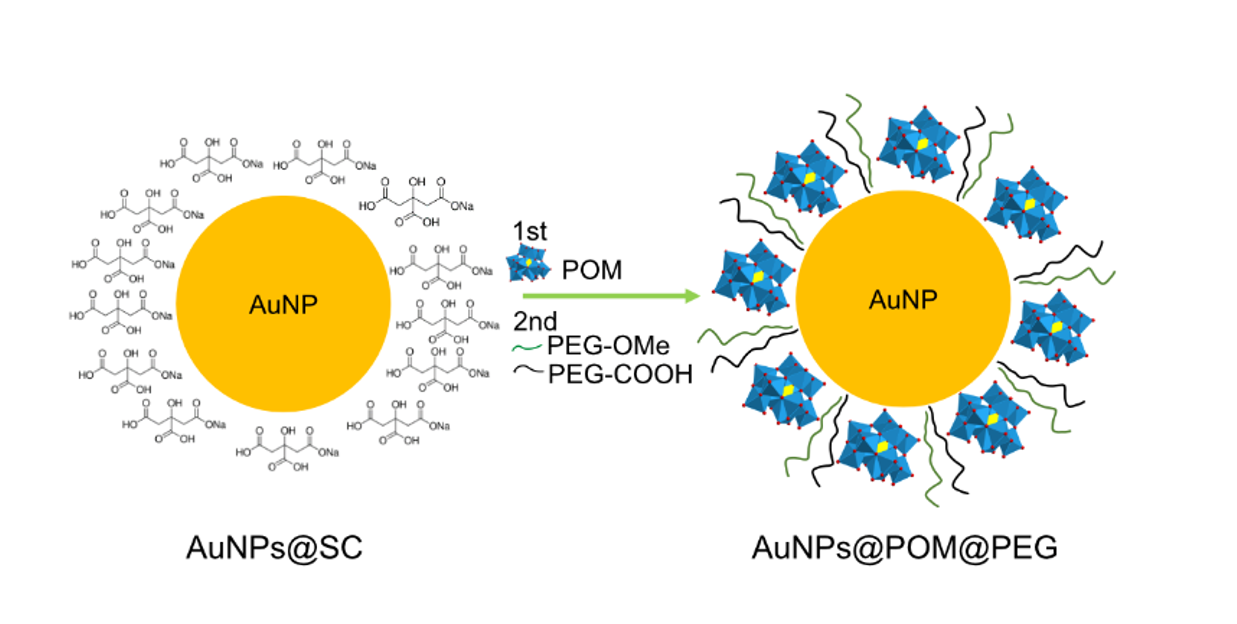
Citrate-capped spherical gold nanoparticles (AuNPs@SC) were synthesized following the Turkevich method described in detail in the experimental section [36–38]. In this reaction, a gold precursor (HAuCl4) is mixed with sodium citrate (SC) at high temperature. SC acts both as a reductive agent and surfactant, allowing tuneable particle sizes to be obtained by changing the ratio between SC and HAuCl4 [37, 39]. We obtained AuNPs@SC of 16.0 ± 0.8 nm of diameter as determined by electron microscopy (Figure S1).
Our polyoxometalate choice was the β2 isomer of the monolacunary Keggin β2-K8SiW11O39·12H2O (POM) (Scheme S1), since it has previously been used in Aβ aggregation inhibition assays demonstrating good performance [30]. POM was synthesized from sodium tungstate and sodium silicate, using the procedure described by Tézé et al. [40]. The purity of the POM was assessed by infrared spectroscopy (IR), and by cyclic voltammetry (CV). The β2-K8SiW11O39 IR spectrum (Fig. 1A, Table S1) shows characteristic peaks at 989.5 [ʋ s (W–Od)], 943.2 [ʋ as (W–Od)], 872.9 [ʋ as (Si–Oa)], 852.5 [ʋ as (W–Ob–W)], 790.8 and 713.7 [ʋ as (W–Oc–W)] cm−1,[41] where Oa, Ob, Oc, and Od represent the central, corner-sharing, edge-sharing, and terminal oxygen atoms of the Keggin structure (Scheme S1). Fig. 1B shows the CV in 1 M sodium acetate buffer (pH 4.7) of the [SiW11O39]8− POM and its parent anion [SiW12O40]4- for comparison. The [SiW12O40]4- anion is stable in acid solutions of pH less than 5 [42]. As reported previously [43], Fig. 1B demonstrates that reduction of [SiW12O40]4- under pH < 5 occurs via two initial 1e- steps (processes I and II) followed by an overall 2e- step (process III). On the other hand, the CV of [SiW11O39]8- at pH 4.7 shows two reduction processes (process I and II) assigned to two overall 2e- redox couples. From Fig. 1B we can observe that i) the potentials in the CV for the first two redox processes of [SiW11O39]8- anion are more negative than those observed for [SiW12O40]4-, and ii) process I in [SiW11O39]8- becomes irreversible due to the formation of ion pairs with the cations of the electrolyte (Na+) at high 1 M acetate buffer ionic strength. These observations are consistent with the literature [44].
POM was attached to the surface of AuNPs through a ligand exchange reaction (Scheme 1), promoted by the weak interaction between SC and gold and the excess of POM in solution [45]. It has been reported, that this lacunary POM binds to silver nanoparticles via the penta-dentate aperture with 5 oxygen atoms directly bound to the surface [46]. Analogously, we assume that a similar chemical bond interaction may occur in the case of AuNPs. Reaction conditions were optimized through the combination and modification of different methods reported in the literature, as described in the methods section [47–51]. As depicted in Figure 2A, in contrast to the IR spectra of AuNPs@SC, the IR spectra of AuNP@POM clearly display the presence of the main IR peaks characteristic of β2-K8SiW11O39· (Figure 1A), demonstrating the correct incorporation of POM on the AuNP (see also table S1). Then, AuNPs@POM were functionalized with two types of thiolated-PEGs, O-methylated and O-carboxylated through the bonding of the thiol groups to gold. The thiol O-methylated PEG (SH-PEG-OMe) was used to provide colloidal stability by introducing neutral charges, and the thiol carboxylated PEG (SH-PEG-COOH) allows us to further functionalize the nanosystem. We characterized the resulting AuNP@POM@PEG by infrared (IR) spectroscopy. IR spectra of AuNP@POM@PEG (Figure 2A and Table S1) not only display the characteristics peaks from POM, but also additional peaks at 1350.2, 1298,1, and 1095.6 cm-1 due to PEG vibrations (C-H bending and O–H and C–O–H stretching, respectively [52] demonstrating the PEG functionalization was achieved while preserving POMs. In addition, Figure 2B shows an electron microscopy image of AuNPs@POM@PEG exhibiting a spherical shape and a size of 17.7 ± 2.3 nm (Figure S1).
Ultraviolet-visible spectroscopy (UV-Vis) is a very widely used technique to characterize spherical gold nanoparticles, thanks to the surface plasmon resonance (SPR) peak around 520 nm. It can be used to quickly determine the concentration of AuNPs, and it is also a good indicator of any changes occurring at the AuNPs surfaces [53, 54]. Figure 2C shows a red shift in the SPR signal of the AuNPs after ligand exchange, caused by the increase of the refraction index after POM and PEG binding on the AuNPs surface [47].
As mentioned, PEG functionalization brings stability to the nanosystem in solutions that present an elevated ionic/salt content, such as the physiological media [55, 56]. Figure 2D demonstrates that AuNPs@POM (without PEG) rapidly aggregate in PBS showing a weak SPR peak in the UV-Vis spectra. After PEG functionalization, AuNPs@POM@PEG SPR peak remains intact, only a bit red shifted due to the increase of the dielectric constant of PBS [57]. UV-Vis spectra did not suffer major changes after 14 weeks (Figure S2), demonstrating the good stability of AuNPs@POM@PEG in PBS.
Table 1 Dynamic light scattering data from AuNPs with different functionalization.
|
AuNPs@SC
|
AuNPs@PEG
|
AuNPs@POM
|
AuNPs@POM@PEG
|
|
Dh (nm) ± SD
|
33 ± 1,50
|
50 ± 0,50
|
-
|
60 ± 1,5
|
|
Pdi
|
0,45
|
0,23
|
-
|
0,27
|
|
pZ (mV) ± SD
|
-43,97 ± 0,21
|
-40,80 ± 2,00
|
-60,07 ± 1,52
|
-57,30 ± 0,90
|
X-ray photoelectron spectroscopy (XPS) was used to confirm the presence of POM in the AuNPs@POM@PEG and to determine the oxidation state of gold (Figure S3). The Au 4f core-level spectrum resolves into two spin-orbit components. The Au 4f7/2 and 4f5/2 peaks occur at a BE of 84.05 and 87.75 eV, respectively. These values indicate that gold is present only in the metallic form. The W4f spectrum shows a W4f 5/2 and W4f 7/2 doublet with binding energies of 36.30 and 38.47 eV respectively which correspond to W(VI) species present in POM [58]. XPS was also used to analyse the POM coverage of the AuNPs@POM@PEG since it gives quantitative information about the composition of the surface when using different ratios of POM/AuNPs and PEG/AuNPs, obtaining a W coverage of around 5.5%.
In addition, to prove the incorporation of different ligands onto the AuNPs surface, hydrodynamic diameter (Dh) and zeta potential (pZ) values were determined. As shown in Table 1, Dh changed from 33 nm to 60 nm due to the PEGs and POM functionalization onto AuNPs@SC surface. Further, Table 1 shows pZ changes on the charge of the
nanoparticles where AuNPs@SC display more negative charge after POM conjugation to form AuNPs@POM due to the high negative charge (-8) of POM. On the other hand, SH-PEG-OMe and SH-PEG-COOH addition to AuNPs@SC maintain the charge since SH-PEG-COOH has also negative charge in solution and SH-PEG-OMe has no formal charges. Finally, AuNPs@PEG@POM reveals a Dh increase and pZ changes towards more negative values after POM addition. In conclusion, changes in the hydrodynamic diameter (Dh) and zeta potential (pZ) values confirmed the functionalization of the AuNPs@SC surface with PEG and POM.
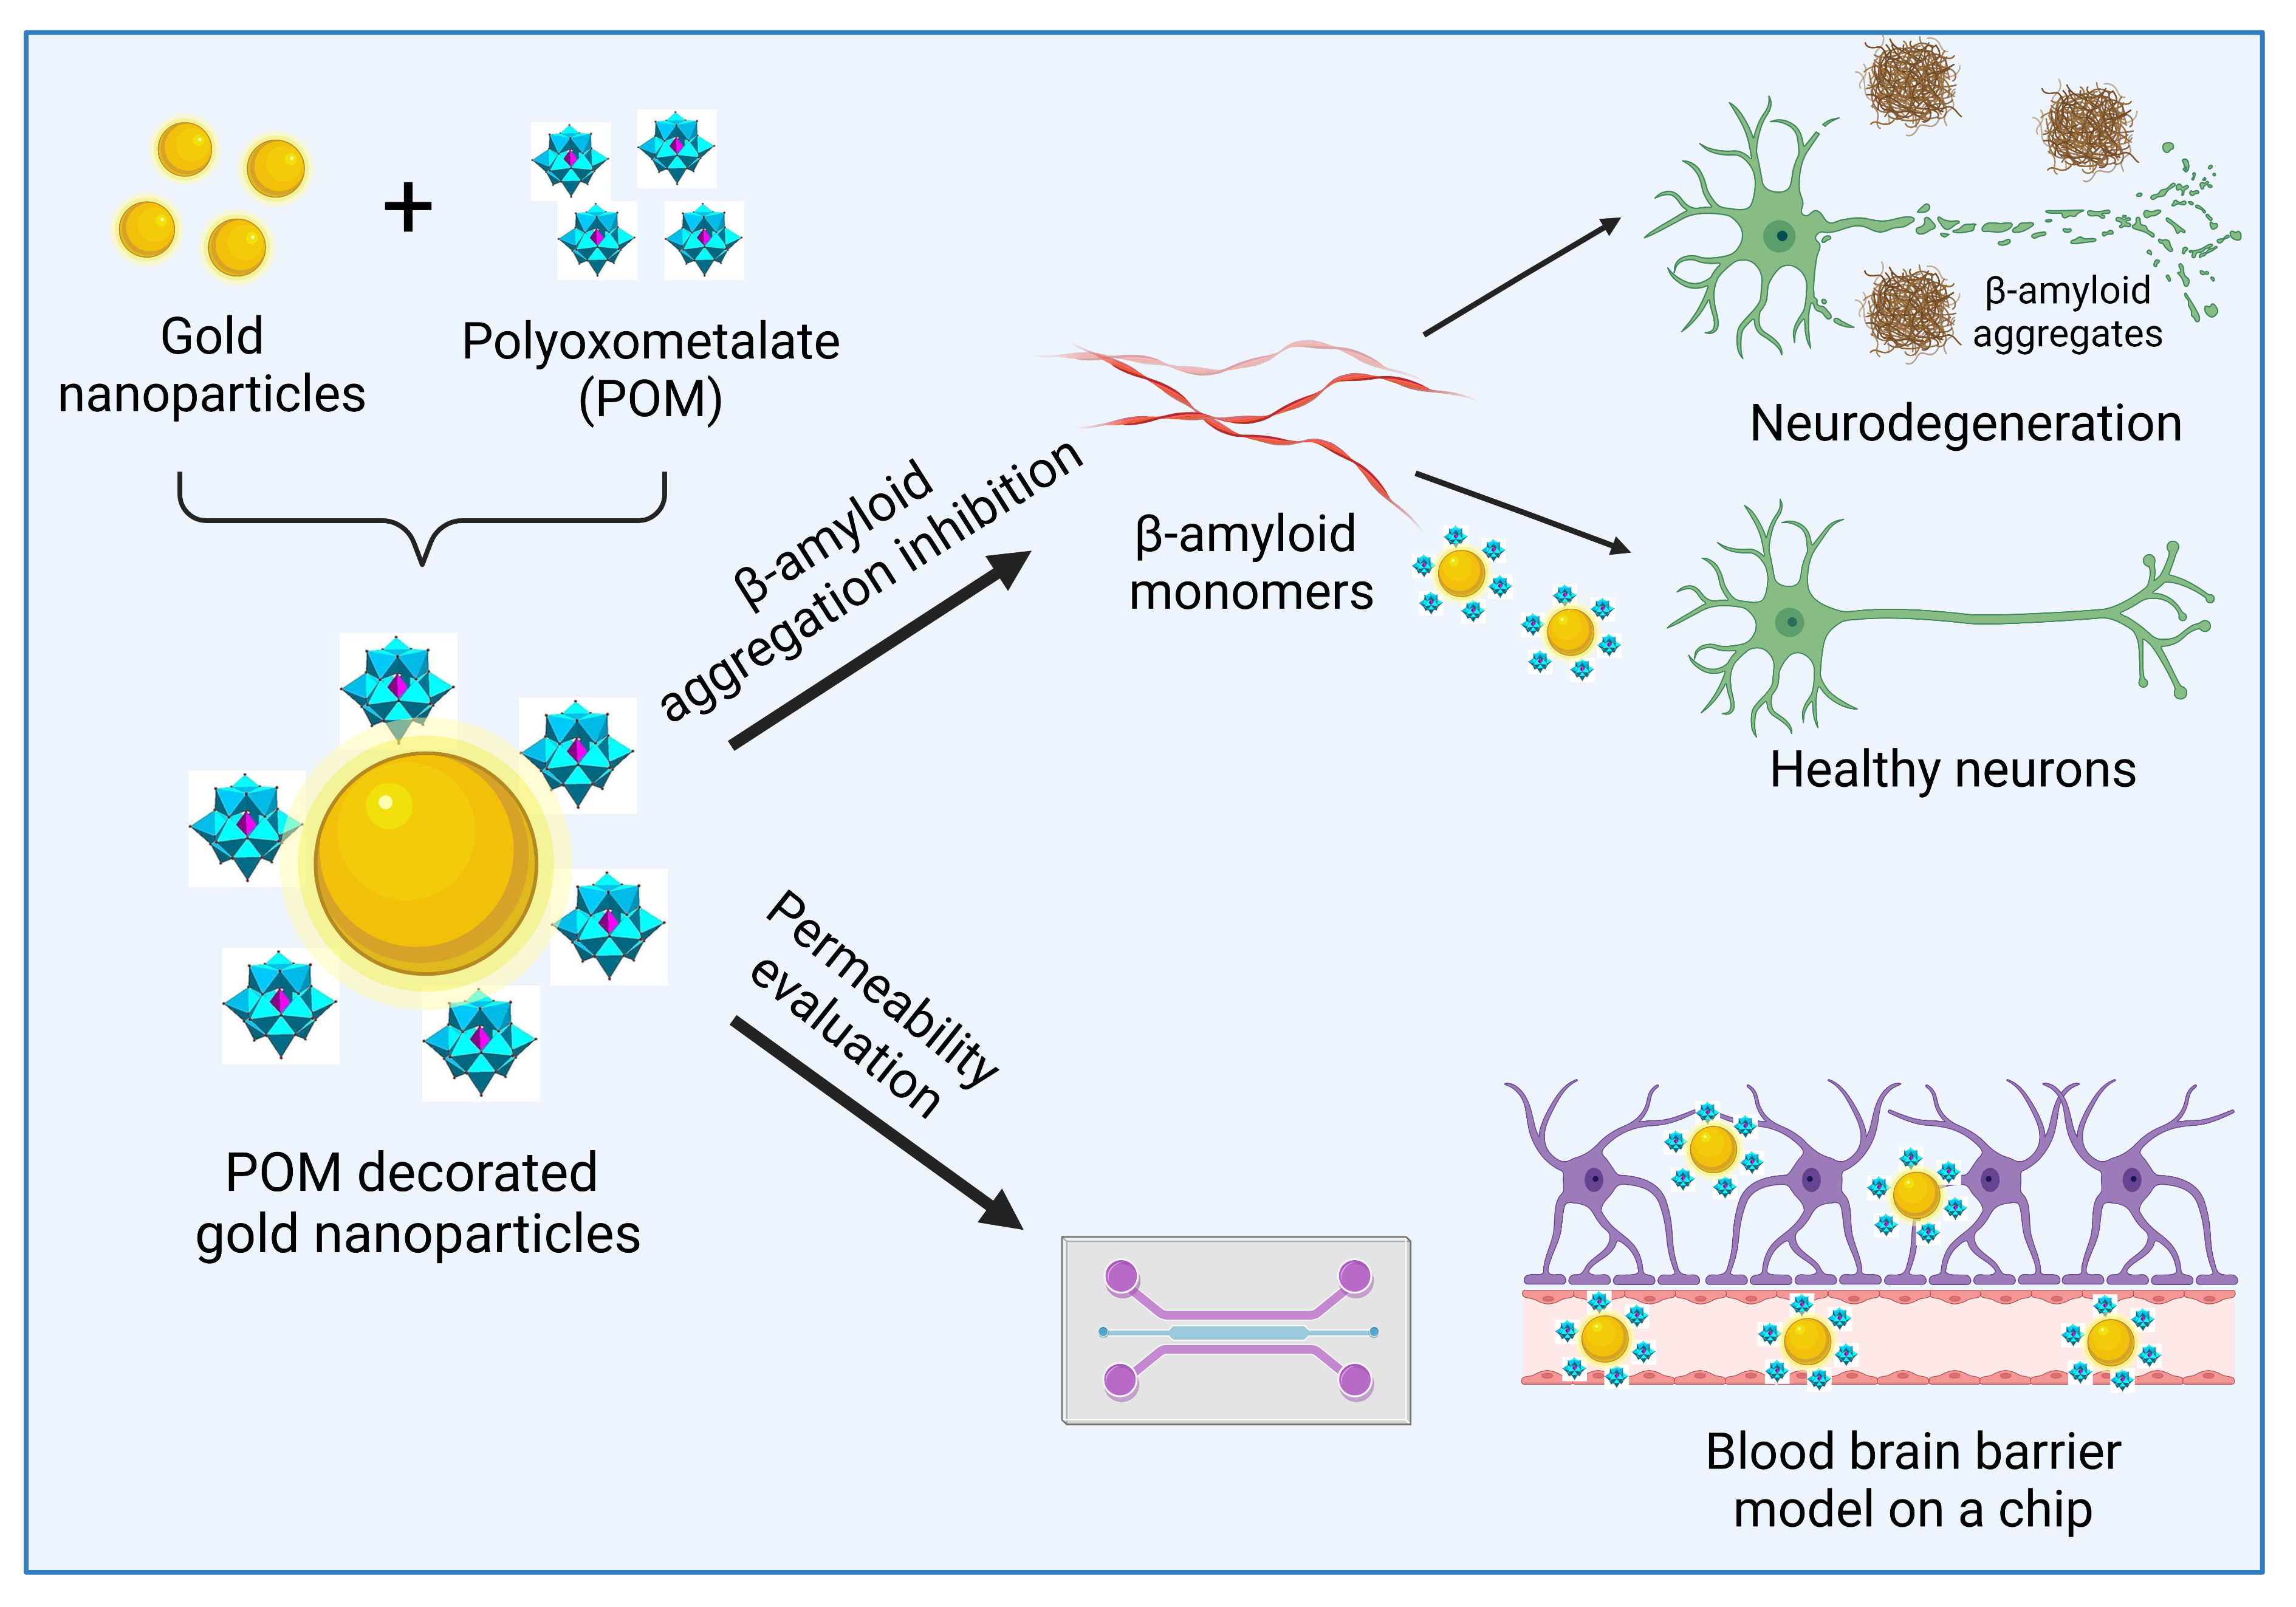
2.2 Evaluation of the inhibition of Aβ fibrillization in vitro by AuNPs@POM@PEG
Aβ aggregation was characterized and monitored using the Thioflavin T (ThT) fluorescence assay. This technique is based on the binding of ThT to the β-sheet conformation of aggregated Aβ, giving fluorescence emission at 480 nm, being proportional to the number of fibrils formed [59, 60]. To evaluate the inhibition of Aβ aggregation in vitro, we incubated Aβ1-42 peptide with different concentrations of AuNPs@POM@PEG (1, 2.5 and 5 nM), with AuNPs@PEG control at 4 nM and with free-standing POM at 100 µM, as used in previously reported assays [28], for 2 h at 37ºC. In addition, controls with ThT with glycine and glycine buffer only were also conducted.
Figure 3A shows the kinetics of Aβ aggregation for each condition during 2 h at 37 ºC. Specifically for untreated Aβ peptide, fluorescence intensity increases, which can be attributed to the growth of Aβ fibres or to an increase in the total number of fibres that finally reaches a plateau, as described for the classic amyloidogenic process [61]. In contrast, samples treated with AuNP@POM@PEG did not display this fluorescence increase, which is attributed to their inhibitory action on Aβ aggregation. We observed that the different concentrations used of AuNP@POM@PEG did not show significant differences in the degree of inhibition, and that both POM and AuNP@PEG alone show anti-aggregation activity, as previously described [18, 28, 62], although at lower levels than when combined in the AuNP@POM@PEG. Results demonstrated how the anti-aggregation potential of POM improves over a 50% by its conjugation with AuNPs. Note that AuNPs@POM (without PEG) could not be included in the study since they are not stable enough in the high salinity medium used in the assay. However, previous studies reported that PEGs can also bind to the Aβ protein and stabilize its native structure, therefore suppressing fibrillization in its initial stage [63]. This may suggest a synergetic behaviour of the three components of the nanosystem (AuNPs, POM and PEG) enhancing its performance. Aβ treated with POM and AuNP@PEG exhibit an ascendent kinetic behaviour at early stages of the Aβ aggregation process, while samples with AuNP@POM@PEG show a negative tendency at the beginning, as was previously reported [18]. Finally, controls of ThT with glycine and glycine buffer present the lowest fluorescence signal proving there is no interference in the fluorescence measurements. Figure 3B shows the aggregation percentage of each condition relative to the untreated Aβ. We observe a strong inhibitory effect of AuNPs@POM@PEG with an inhibition of about 75% in fibril formation after treatment compared with the untreated Aβ sample, surpassing the performance of previously reported AuNPs-POMs including the specific Aβ-targeted peptide inhibitor Aβ15-20 [32].
2.3 Evaluation of the permeability of AuNP@POM@PEG across the blood-brain barrier-on-a-chip (BBB-oC) in vitro model
As a possible candidate for AD treatment, AuNPs@POM@PEG should be able to cross the BBB. Therefore, we evaluated the permeability of AuNPs@POM@PEG in an animal-free, microphysiological model of the human BBB. Our BBB-oC system consists of a 3D scaffold made of fibrin hydrogel where human astrocytes and pericytes are embedded (brain chamber), and in direct contact with human endothelial cells in a lateral channel (blood channel), which is separated of the main chamber through microposts (Figure 5A) [64]. Before testing the permeability of the nanosystem, we conducted cytotoxicity assays in the three different cell types used in the BBB-oC model to make sure that the administered dose of nanoparticles is not harmful for the cells. We screened through two complementary methods, live/dead assay and MTS the cell viability in the presence of four different AuNPs@POM@PEG concentrations ranging 0.5 to 5 nM based on previous reported cytotoxicity limit of AuNPs@POM [65].
After 24 h of incubation, we performed live/dead assay and MTS and the results demonstrated that AuNPs@POM@PEG are not cytotoxic below 2.5 nM. Percentages of cell viability calculated from both MTS and Live/Dead are shown in Figure 4. As expected, both methods show the same trend: a concentration-dependent behaviour, where a higher concentration is more cytotoxic. For both human pericytes and astrocytes cell viability is very high for all concentrations except for 5 nM AuNPs@POM@PEG, where viability is still higher than 50%. Human endothelial cells were more affected by AuNPs@POM@PEG 5 and 2.5 nM, however, between 1 and 0,5 nM they present over 80% of viability. Figure S4 shows some Live/Dead images of the different treatments in endothelial cells where differences in the alive cell density can be observed.
To evaluate the BBB permeability of the AuNP@POM@PEG, and according to cytotoxicity results, 2.5 nM AuNP@POM@PEG were fluorescently labelled with Alexa fluor 647 and injected into the blood channel of the chip. Fluorescent images were recorded for 1 hour to determine the permeability coefficient (P). Also, fluorescently labelled 2.5 nM AuNP@PEG were used to determine whether POM molecules have any effects on the BBB crossing. Figure 5B reveals that both nanoparticles were effectively internalized towards the barrier. The permeability values calculated were found within the same range than those previously reported for nanoparticles with similar features as material and size, in analogous BBB-oC devices [66]. The P values of AuNP@POM@PEG (3.47·10-6 cm/s) and AuNP@PEG (3.07·10-6 cm/s) showed no significant differences, thus indicating that POM has no effects on the barrier integrity. Finally, the hydrogel of the brain channel was dissolved with TRIzol®, used for their capacity to sample homogenization, and then observed by STEM. AuNP@POM@PEG were found in the dissolved hydrogel (Figure 5C) confirming that the nanosystem crossed the endothelial barrier in the BBB-oC; additionally, EDX showed the presence of gold in the sample and so the presence of the AuNPs (Figure 5D).