Identification of a list of differentially expressed ARGs (DE-ARGs)
After integration and analysis of the 232 autophagy-related gene expression data from 552 cancerous tissue samples and 35 non-tumor samples from TCGA EC cohort, we obtained 51 up-regulated and 43 down-regulated ARGs with the criteria of P-value < 0.05 and log|Fold change (FC)|> 0.5 (Fig. 2A-B). The detailed flow chart for the prediction model construction in this study was shown in Fig. 1. In addition, the expression pattern of 94 differentially expressed ARGs (DE-ARGs) was shown in a box plot (Fig. 2C).
Functional Enrichment Of The DE-ARGs
Then, we probed into the biological function of 94 DE-ARGs by performing GO and KEGG enrichment analysis. GO enrichment showed that the DE-ARGs were mainly involved in autophagy, intrinsic apoptotic signaling pathway and cellular response to oxygen levels (Fig. 3A). The expression level of correlated genes in the enriched GO terms are displayed in the heatmap (Fig. 3B). KEGG pathway enrichment presented that DE-ARGs were mainly involved in apoptosis, HIF-1 signaling pathway, EGFR tyrosine kinase inhibitor resistance, p53 signaling pathway, platinum drug resistance and various cancer processes (Fig. 4A). The enriched KEGG pathways and related genes expression profile were presented in Fig. 4B.
The PPI network of 94 DE-ARGs and hub gene alteration analysis
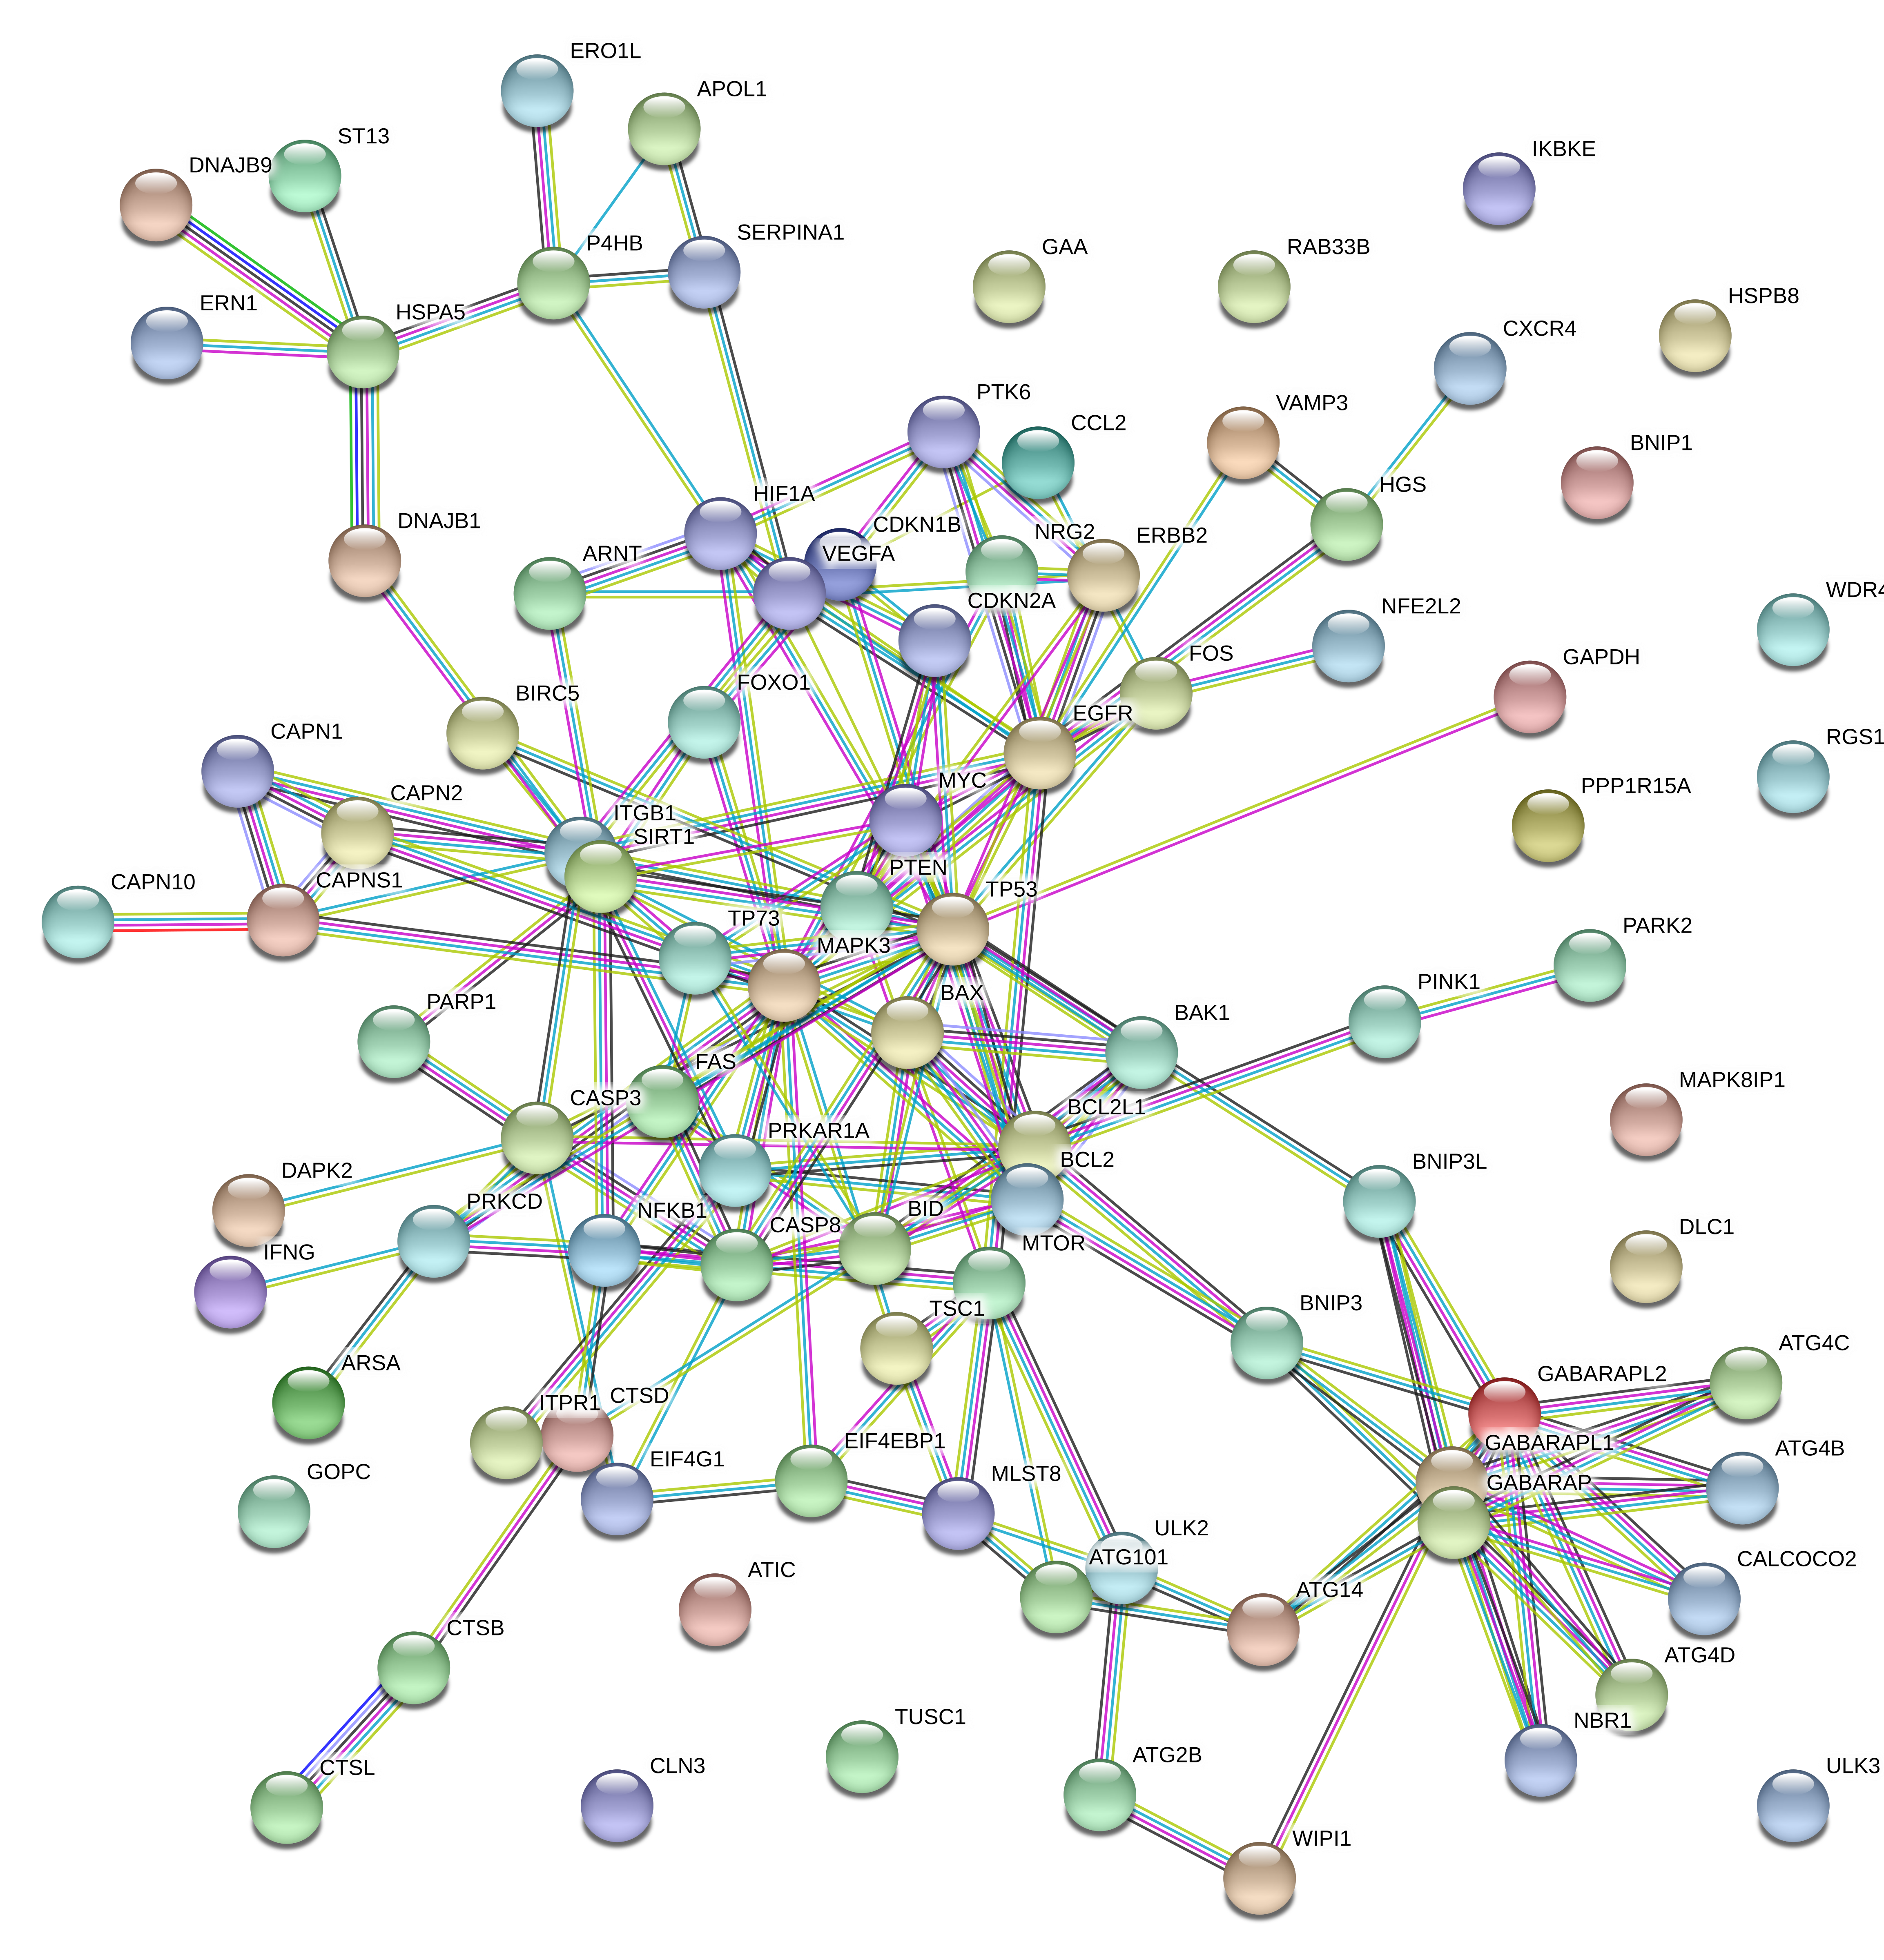
Through the STRING website, we constructed an interaction network of 94 DE-ARGs (Supplementary Fig. 1). There were 79 nodes and 192 edges in the network based on the interaction score criteria. Top 15 hub genes with the highest connectivity degrees in the string network were selected as follows: TP53, MAPK3, EGFR, BCL2L1, GABARAPL1, BCL2, GABARAP, GABARAPL2, BID, CASP8, ITGB1, SIRT1, CASP3, HIF1A and mTOR (Fig. 5A-B). The alteration results of the hub genes showed that TP53, mTOR and BCL2L1 ranked as the most frequently altered genes. TP53 more often occurred with a missense mutation (putative driver) while mTOR presented with a missense mutation (unknown significance). BCL2L1 was frequently over-amplified among endometrial cancer patients (Fig. 5C).
Identification Of A Four DE-ARGs Based Prognostic Model
Next, we randomly divided the 541 TCGA EC patients into the training cohort (n = 272) and the testing cohort (n = 269). Univariate cox regression analysis was performed in the training cohort and identified 5 genes among the 94 DE-ARGs closely related to patients' outcomes, which were presented in Table 1. Subsequent lasso and multivariate cox regression analysis further picked out 4 genes significantly associated with prognosis, which are ERBB2, PTEN, TP73 and ARSA (Fig. 6 and Table 2). According to the results of multivariate Cox regression analysis, we constructed the prognostic model as follows: risk score = ( 0.001423 × expression value of ERBB2)+ ( -0.14307 × expression value of PTEN) + ( -0.2439 × expression value of TP73) + ( -0.02447 × expression value of ARSA).
Table 1
Univariate Cox regression identified 5 ARGs correlated to endometrial cancer patients' OS
| Gene ID | HR | HR.95L | HR.95H | P-value |
| CDKN2A | 1.026531627 | 1.009917387 | 1.043419189 | 0.00165897 |
| ERBB2 | 1.001501287 | 1.00049562 | 1.002507965 | 0.003426745 |
| TP73 | 0.755473706 | 0.607575446 | 0.939373908 | 0.011649278 |
| ARSA | 0.971274216 | 0.94540475 | 0.997851557 | 0.034335042 |
| PTEN | 0.902900646 | 0.816729251 | 0.998163804 | 0.045947383 |
| Abbreviation: ARGs: Autophagy related genes; HR: Hazard Ratio, OS: overall survival time. |
Table 2
Multivariate cox regression selected 4 ARGs correlated to endometrial cancer patients' OS
| Gene ID | HR | HR.95L | HR.95H | P-value |
| ERBB2 | 1.001423915 | 1.000390213 | 1.002458685 | 0.00692645 |
| PTEN | 0.866697329 | 0.778078128 | 0.965409814 | 0.009332535 |
| TP73 | 0.783565307 | 0.628160539 | 0.977416683 | 0.030580492 |
| ARSA | 0.975830053 | 0.950211196 | 1.002139627 | 0.071466256 |
| Abbreviation: ARGs: Autophagy related genes; HR: Hazard Ratio, OS: overall survival time. |
According to the above signature, we calculated the risk scores of each individual in the training cohort and divided them into high-risk (n = 136)and low-risk (n = 136) subgroups with the mean risk score as the cut-off value. To uncover the outcome discrepancy between two subgroups, we ranked each individuals' risk score and displayed their distribution and the survival status on the dot plot (Fig. 7A, C). The expression profile of 4 prognostic ARGs among the high and low-risk groups was also presented via heatmap (Fig. 7B). The results showed that the high-risk group seemed to accompany more death events and patients expressed higher ERBB2 level and lower expression of TP73, PTEN and ARSA. We used these four ARGs as a signature, Kaplan-Meier curve analysis showed that the OS of the higher-risk group was significantly shorter than the low-risk group (P = 1.222e-05) (Fig. 7D). In addition, the ROC curve analysis revealed the area under the ROC curve (AUC) of the prognostic ARGs signature was 0.743 (Fig. 7E).
Validation The Efficacy Of The 4 ARGs Prognostic Signature
To evaluate the efficacy of the prognostic signature constructed in the training cohort, we introduced the risk model into the testing cohort and the entire cohort and calculated each individuals' risk scores. As for the testing cohort, we divided the group into 142 high-risk and 127 low-risk individuals based on the training cohort' cut-off risk score. The survival time, survival status and gene expression pattern were also presented based on two subgroup patients' risk scores and the results were consistent with those in the training group (Fig. 8A-C). Kaplan-Meier curve analysis also showed that high-risk subgroup patients exhibited worse outcomes compared to the low-risk subgroup in the testing cohort with shorter OS(P = 2.008e-03) (Fig. 8D). The area under the ROC curve (AUC) of the prognostic model was 0.711 (Fig. 8E).
In accordance with the results from the training and testing group, the high-risk subgroup of the entire cohort also presented shorter survival time, worse survival status and similar gene expression profile(Fig. 9A-C). Kaplan-Meier curve analysis presented that the low-risk subgroup in the entire cohort followed with longer overall survival time(P = 1.034e-07) (Fig. 9D). ROC curve analysis showed the AUC of the prognostic model was 0.723 (Fig. 9E).
The clinical independence and correlation estimation of the risk signature
To evaluate the clinical independency of the model, we combined it with other clinical factors and then performed univariate and multivariate analysis. The results indicated that the prognostic model was able to serve as an independent prognostic indicator(P < 0.001 and P = 0.009, respectively) (Fig. 10A-B). ROC curve analysis also showed that the AUC value of the ARGs signature was 0.705, much significantly higher than patients’ age (AUC = 0.535) and weight (AUC = 0.633), the tumor grade (AUC = 0.656), histology (AUC = 0.522) and lymph node status (AUC = 0.697), and slightly lower than the clinical stage (AUC = 0.710)(Fig. 10C). After removing some patients without clinical information, we integrated the risk scores, the clinical characteristics and the expression profiles of remaining EC patients to analyze the relationship between ARGs prognostic model and clinical features (Fig. 10D). In addition to the significant difference of survival status among two subgroups, we observed a significant increase regarding patients' age, clinical stage, tumor grade, serous histology and lymph node metastasis in high-risk group endometrial cancer patients (Fig. 10E). The correlation between each gene from the prognostic model and the clinical features were also measured. The results showed that ARSA and TP73 were significantly negatively correlated with stage, tumor grade and histology whereas ERBB2 was positively correlated with tumor grade, histology and lymph node status (Figure S2).
Nomogram Building And Validation
To establish a clinically applicable method for predicting the prognosis of endometrial cancer patients, we established a prognostic nomogram to predict the survival probability during 5 years based on the TCGA entire set(Fig. 11A). Seven independent prognostic parameters (age, stage, grade, weight, histology, lymph node status and ARGs) were enrolled in the prediction nomogram (Fig. 11A). The calibration plots show excellent consistency between the nomogram prediction and actual observation in terms of the 3- and 5-year survival rates in the TCGA cohort (Fig. 11B-C).