A dinuclear copper (II) complex, Cu2 (RCOO)4(L)2 (1) while [RCOO = benzoate, L = 2-amino-3-chloro-5-trifluoro methyl pyridine], with square pyramidal geometry with four carboxylate bridged groups has been reported. This dinuclear copper (II) unit (with the most robust, frequently occurring paddle wheel structure) was characterised by single crystal X-ray diffraction, IR, UV, CV, TGA and EPR studies. It exhibits catechol oxidase activity in methanol medium and the catecholase activity was monitored by the UV–Vis spectroscopy. The kinetic parameters have been determined by using Michaelis–Menten equation which shows that the complex is an efficient catalyst with very high turnover number. Mechanistic investigation of the catalytic behavior was established with the help of ESI-MS spectra.
Research Article
Synthesis, Crystal Structure and Catechol Oxidase Activity of a Di- nuclear Paddle-Wheel Cu (II) Carboxylate Complex
https://doi.org/10.21203/rs.3.rs-3216342/v1
This work is licensed under a CC BY 4.0 License
Journal Publication
published 19 Sep, 2023
You are reading this latest preprint version
Copper (II) complex
Crystal Structure
Paddle wheel
Catalytic Oxidation
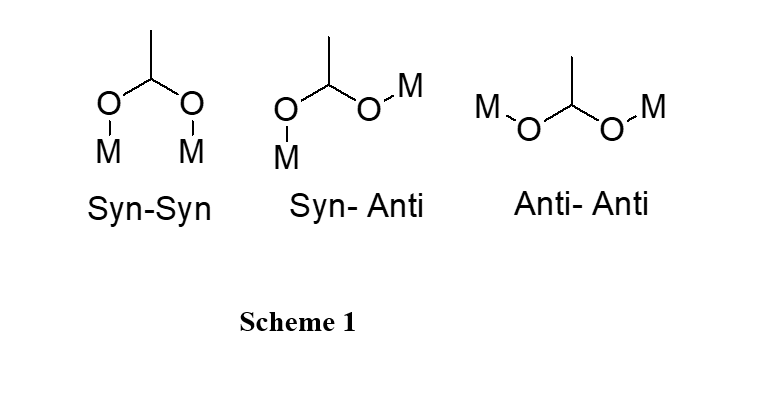
A significant part of research on coordination chemistry is based on the use of metal ions as a key connector and organic molecules as linkers [1,2] to promote the structural features of the supramolecular products for their interesting structural motifs and potential applications in ion exchange, biology, porous materials, molecular adsorbents and their potential electronic properties [3]. Generally, metal carboxylates can produce open-framework supramolecular structures. Carboxylate anions exhibit a versatile coordination behaviour displaying distinct bonding modes toward metal cations, such as monodentate, chelate, monoatomic bridge as well as bridging ligands in syn-syn, syn-anti, and anti-anti conformations shown in scheme 1 and hence can lead to the formation of different two- and three-dimensional structures resulting complexes and metal organic frameworks. Chemistry of the dimeric and polynuclear copper (II) carboxylates complexes with various carboxylates have been investigated for a long time. As expected on the basis of their respective geometries, the syn-syn configuration favors the formation of dinuclear complex while the anti-anti and syn-anti configurations generally correspond to chain or layer structures [4]. A good number of paddle-wheel (PW) type dimeric copper (II) carboxylate adducts along with their magneto-structural correlation have been reported [5-8]. The interest of the PW motif is that both structural and functional changes can be achieved simply by varying the metal cores, the bridging moieties, or the ligands [9]. This functional versatility of the dinuclear PW motifs makes them attractive for the design and synthesis of many crystalline materials ranging from zero-dimensional (0D) species to three-dimensional (3D) coordination polymers with interesting properties [10-11]. The Polynuclear copper(II) carboxylates were found to exhibit three classes of local paddle-wheel structures: (i) stepped polymeric structure with the second lone pair is donated to a metal ion of another paddle-wheel unit; (ii) stepped without additional ligands with polymeric structures can also be obtained by means of ligands which are able to bridge between dinuclear units; (iii) the bridging ligand coordinates axially to a Cu ion and at the same time interacts with a carboxylate oxygen atom of another paddle-wheel unit. From structural–functional correlation it has been found that the catecholase activity exhibited by model dicopper complexes is dependent on several parameters including metal–metal distance, electronic and steric properties of coordinated ligands and the nature of bridging ligands. Generally, solvents physical parameters like dipole moment, dielectric constant have no major effect in controlling catalytic activity. Among protic and aprotic solvents, protic solvents are best choice [12]. Dinuclear copper (II) complexes that can mimic the structural or/and the functional aspect of catechol oxidase are well reported in literature [13-18]. From the literature review it is observed that the Cu(II) based paddle wheel complexes having different catalytic activities are well known [19-20], however, having catecholase activity of such type of complexes are still rare [21].
In this work we report the synthesis and crystal structure of one copper (II) PW complex having benzoate bridging in syn-syn fashion and its catecholase-like activity. The complex was characterised by spectroscopic studies along with its single crystal X-ray diffraction study.
Materials and methods
All chemicals and solvents used for the synthesis were of analytical grade. 2-amino-3-chloro-5-trifluoro methyl pyridine (ACTP), copper perchlorate and sodium benzoate were purchased from Aldrich Chemicals Co. and were used without further purification.
Synthesis of the complex [Cu2 (C6H5COO)4 (ACTP)2] (1)
2-amino-3-chloro-5-trifluoro methyl pyridine (ACTP) (0.196g, 1 mmol) was dissolved in dry methanol (10 mL) and added very slowly to a methanolic solution (10 ml) of Cu (ClO4)2. 6H2O (0.371g, 1 mmol) and stirred for 20 minutes in hot condition. Then sodium benzoate (0.13g, 2 mmol) was added to the hot solution and the resulting hot green solution was stirred at around 60⁰C for 40 minutes, filtered and left to evaporate at room temperature and suitable single crystals for SCXRD study were obtained after 5 days.
Yield: (85 %). Anal. Calcd. for [C40H28Cl2Cu2F6N4O8]: C, 48.01; H, 2.41; N, 5.59 (%). Found: C, 47.43; H, 2.98; N, 5.49 (%).
Physical measurements
Elemental analyses (carbon, hydrogen, and nitrogen) were carried out with a Perkin –Elmer 2400 II elemental analyzer. The FT-IR spectrum (4000-400 cm-1) was recorded on a Perkin–Elmer FT-IR spectrophotometer with solid KBr pellet. The electronic spectra (1100-200 nm) were recorded on a Perkin-Elmer Lambda 35 UV-Vis spectrometer using HPLC grade methanol as a solvent. The concentrations of the solutions were 1×10⁻⁵ M. The PXRD data were collected by X-ray diffractometer (Rigaku, Smartlab) with a source of Cu Kα radiation. Thermogravimetric analysis was carried out with a heating rate of 10°C/min with a Perkin Elmer STA 6000 thermal analyser system in a dynamic atmosphere of N2 (flow rate 80mL min-1), the sample was in an alumina crucible, and the temperature range was 30-500°C. A three electrode assembly comprising a Pt (for oxidation) & glassy carbon (for reduction) working electrode, Pt auxiliary electrode and Ag/AgCl reference electrode were used. EPR measurement was performed on JEOL JES-FA200 instrument.
X-ray Crystallography
The molecular structure of complex was determined by the single crystal X-ray diffraction method. A suitable single crystal of approximate dimension 0.23 × 0.22 × 0.21mm for complex 1 (C40H28Cl2Cu2F6N4O8) was chosen under a polarizing microscope and mounted on a glass fiber. Data were collected at 298(K) on D8 Quest ECO X-Ray Diffractometer (SCXRD) equipped with a graphite monochromator and a MoKα radiation (λ = 0.71073 Å). Unit cell parameters were determined by using APEX3 Programme. Data reduction was carried out by the SAINT programme [22]. The integration of the data using a monoclinic unit cell yielded a total 19301 reflections to a maximum theta angle of 25.05o of which 3647 were independent and 3240 were greater than 2 sigma F2. The ratio of minimum to maximum apparent transmission was 0.647. Correction for adsorption was performed using the SADABS program [22] for complex. The structures were solved using the SHELXT program [23] and refined with SHELXL-2018/3 [24]. All the non-hydrogen atoms were refined anisotropically. The goodness-of-fit was 1.028. Further crystallographic data and structure refinement parameter of the complex summarized in Table 1. A few selected bond distances and bond angles for the complex are given in Table 2.
FT-IR Spectroscopy and PXRD
FT-IR spectrum of the copper (II) complex revealed all the characteristic bands which were in accordance with the results of the X-ray single crystal analysis. Previous work has suggested that the frequency of separation (Δν) between the two asymmetric & symmetric V(COO) is related to the nature of the carboxylate coordination [25]. In this complex two bands in 1571 cm⁻1 and 1408 cm⁻1 indicates the antisymmetric and symmetric COO- stretching vibrations of carboxylate moiety respectively. ∆ν = 163 cm-1 indicates the bridging mode of benzoate moiety. The Cu–O absorption bands in 516-515 cm⁻1 range for complex 1, confirm the coordination of the carboxylate ligand through oxygen [S1]. The appearance of C=N stretching band at 1609 cm-1 instead of its normally observed characteristic region (1625–1610 cm⁻1) [26-28] indicated the involvement of nitrogen of pyridine in bonding with the copper (II) ion. This was further supported by the appearance of a new medium intensity band in the region 465–463 cm⁻1, attributable to Cu–N vibration. The aromatic C=C and C–H stretching vibrations were observed in 1512–1498 and 3069–3034 cm⁻1regions, respectively. A broad band at 1121 cm-1 assignable to ۷sym (CF3) vibration in complex. The powder X- ray diffraction data [S2] was recorded in the range of 2θ = 10-50o. Sharp peak shows the crystalline nature of the bulk sample. The stimulated X-ray diffraction and PXRD data are completely matched with the single crystal X ray diffraction pattern, shows purity of the bulk sample.
Description of Crystal Structure
The crystallographic characterization reveals that the complex 1 crystallize in the monoclinic space group P1 21/c1. As the center of the paddle-wheel dimer, for the crystal structure of complex 1, is situated on a crystallographic inversion center, only half of the complex molecules are within the asymmetric units shown in Fig. 1. The molecular structure comprised of four μ-benzoate ligands and two ACTP ligands at the two copper (II) ions (shown in Fig. 2), formulated as [Cu2 (C6H5COO)4 (ACTP)2] have the typical structure of the widely known copper carboxylates, with a central Cu2(μ-O,O′−O2CR)4 [R= -C6H5, -CH3 etc.] core . Each copper ion is coordinated in ‘syn-syn mode’ from four different benzoate groups in the equatorial plane with Cu-Oeq distances at around 1.96 Å. This typical arrangement around each cupric center, allowing a rather short intermetallic distance, typically around 2.6612 Å for complex 1 and leaving two axial positions available for terminal ligands. These axial positions of each copper atom belong to nitrogen of substituted pyridine moiety from each ACTP ligand, which act as ancillary ligands. The difference in Cu–Cu distances is attributable to the relatively higher basic strength of the N-donor ligands in complex, resulting in slight decrease in their Cu–O bond ionic character [29]. Thus, the properties of Cu (II) complex, arising as a result of the inter-copper (II) ions separation can be tuned by changing the attached ligand and its donor atoms. As expected, the 2.245(2) Å of Cu-N bond lengths of these ancillary ACTP ligands are significantly longer than those of the four basal benzoate ligands of 1.956(2) Å–1.980(2) Å, due to the weaker bonds and the Jahn–Teller effect of the d9, Cu2+ ions and generate a square pyramidal coordination geometry. Due to centrosymmetric in nature, all trans bond lengths are equal to each other along with their trans bond angles. The maximum bond angles around each Cu atoms in complex O6- Cu1- O3=167.43°, which are shorter than 180° and the little expansion of the O–Cu–N angle from 90°, which is typical in a paddlewheel structure. The distortion of the coordination polyhedral is also evident from the values of the bond angles (Table-2). The small variation in the structure from reported complexes is due to the difference in the electronic and other properties of the group attached to the phenyl ring in the respective complexes. Moreover, the intramolecular hydrogen bonding interaction of complex 1 is linked by the amide groups of ancillary ACTP ligands with the nearest carboxylic group of benzoate ligands creating the 2.046 Å of O3…H102-N3, to stabilize the structure. From the packing diagrams it is also very clear that the complex prefers an isolated dimeric structure with intramolecular hydrogen bonds (S3) rather than a tetrameric or polymeric structure & thus inter dimer interaction is absent in complex.
Electronic spectra
The electronic spectrum was taken in 200-1100 nm range with 1 x 10⁻⁵ (M) methanolic solutions of the complex. The intense band is observed around 200-310 nm range, shown in Fig. 4, which is due to intra ligand charge transfer transition. Intense signal display charge transfer transitions in origin at around 280 nm is due to - * transition and peaks in the range 305 nm may be due to the n to * transition which may be assigned as charge-transfer absorption (oxygen-to-copper; LMCT) and could be indicative of a dimeric structure of the complex. Moreover, the complex shows a strong absorption band due to the d-d charge transfer transition at 755 nm. Thermo gravimetric analysis
The thermal stability of the polycrystalline sample was investigated using TGA at a heating rate of 10 oC / min in N2 atmosphere over the temperature range from 30°C to 500°C. The complex shows no weight loss up to 110oC. After that the complex shows two step weight loss in the temp rage 110-206oC and 206 -295oC with a weight loss of 52% and 34% corresponds to two ACTP groups and then the loss of remaining benzoate moieties respectively [S4]. No further weight loss observed upon heating up to 500oC. The black residue is identified as CuO upon qualitative analysis.
The sequence of the decomposition reactions, as deduced from TGA studies, is summarized below:
[Cu2 (C6H5COO)4(ACTP)2] → Cu2(C6H5COO)4 + 2 ACTP
[Cu2(C6H5COO)4] → 4 C6H5COO + 2CuO
Electrochemical and EPR studies
Cyclic voltammetry was employed to investigate the redox behavior of the synthesized copper (II) complex. Study concerning the redox behavior of the compound was carried out in methanol solution containing 0.01 M TBAP in the potential range -2.5 to + 2.5 V at a glassy carbon electrode (GCE) versus an Ag/AgCl reference electrode at 25 °C. Cyclic voltammogram shows one oxidation and one reduction peak in the potential range -0.4 to + 1.1 V, shown in Fig. 5. The cathodic peaks appeared at Epc= -0.4V and anodic peaks appeared at Epa=1.1 V, which is attributed to the reduction of the copper (II) ion into copper(I) ion in reversible manner. The E1/2 value for the complex is 0.35V.
An EPR spectrum of copper (II) benzoate based paddle wheel complex was recorded at low temperature and it shows five signals which are typical for the antiferromagnetically coupled copper (II) centers (S5).
Catecholase activity and kinetics
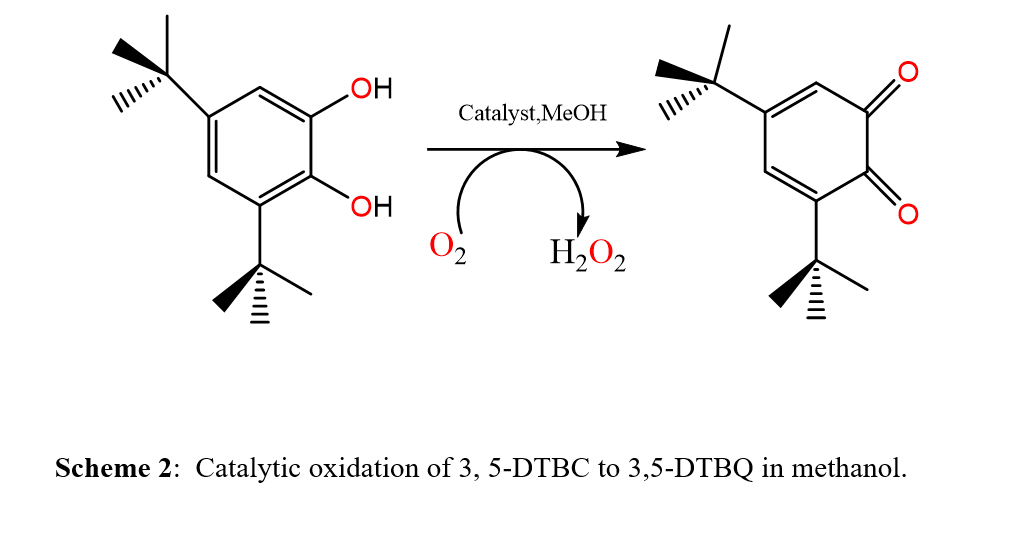
The catecholase activity of complex was determined by 3, 5-di-tertbutylcatechol (3,5-DTBC) as a substrate at room temperature under aerobic condition .The catecholase activity was checked by mixing a methanolic solution of complex (1 x 10⁻⁴) with 3, 5-ditert-butylcatechol (100 equiv.) under aerobic conditions at room temperature. There was a gradual increase at 400 nm with addition of 3, 5 DTBC in methanolic solution of the complex (due to the formation of the oxidized product 3,5-DTBQ (Fig. 6). The course of the reaction was checked by UV-vis spectroscopy, by observing the increase in absorbance of the quinone band shows maximum around 400 nm [30]. The time dependent UV-vis spectral scan was performed in pure methanolic solution. The observed rate versus substrate concentration data were then analyzed on the basis of the Michaelis–Menten approach of enzymatic kinetics. The Michaelis−Menten constant (KM) and maximum initial rate (Vmax) were determined by linearization using Lineweaver−Burk plots [31]. The turnover number (kcat) was obtained by dividing the Vmax value by the concentration of the complex [Table 3 and Fig. 6].
The catecholase-like activity of Cu (II) complex was determined by the catalytic oxidation of 3,5-DTBC. 3,5-di-tert-butylquinone (3,5-DTBQ), is highly stable and a characteristic absorption band maxima appeared at around 400 nm (ε = 1900 M−1 cm−1) in a pure methanol solvent system. By choosing initial rate method the rate constant for a particular complex substrate concentration ratio can be obtained by change in absorbance versus time plot. The Cu (II) complex showed high turnover number (Table 4) for the catalytic oxidation of 3,5-DTBC to 3,5-DTBQ under mild conditions by molecular oxygen and the formation of 3,5-DTBQ was identified from ESI-MS+(m/z) study. The observed rate vs. [substrate] plot in methanol solution, as well as Lineweaver-Burk plot, is given in Fig. 6. In methanolic solution of the complex, with addition of 3,5- di-tert-butyl catechol in presence of air, there was a gradual increase in absorbance at 400 nm as shown in Fig. 7.
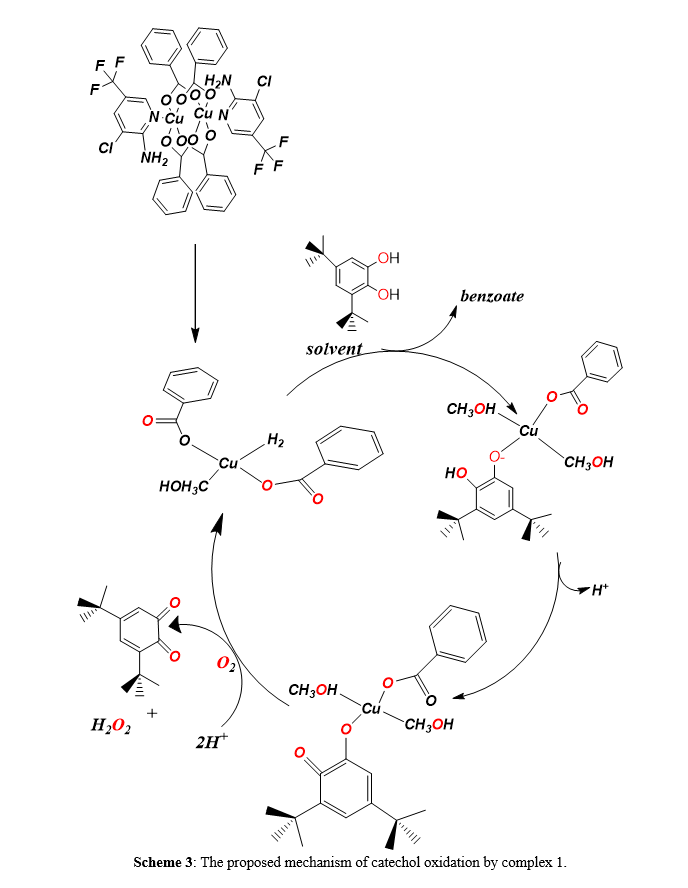
For complex−substrate intermediate and a mechanistic inference of catecholase activity during the oxidation reaction, we have recorded ESI-MS spectra of the complex after 15 min mixing of 3,5-DTBC in methanol solvent (S6) to check if there was any complex –substrate aggregate formed or not . The peaks at m/z = 243.1 can be assigned to the quinone sodium aggregates [3,5-DTBQ-Na] +. Complex 1 shows a peak 464.35 which can be assigned to corresponding species, [Cu (PhCOO-)(MeOH)2(3,5-DTBC)] and 463.35 due to [Cu (PhCOO-)(MeOH)2(3,5-DTBC)] +, formation of catalyst-substrate intermediates that take part in substrate activation during the oxidation of 3, 5 DTBC to 3,5 DTBQ. Peak at 324.16 may be due to formation of [Cu (PhCOO-)2(Solvent)H2].
Detection of Hydrogen Peroxide in the Catalytic Reactions
Modification of iodometric method is carried out to detect H2O2 quantitatively during the catalytic reaction [32-33] and mixtures of reaction were prepared as in the kinetic experiments. Using dichloromethane after 1 h of the reaction, same volume of water was added to extract the formed quinone. Further oxidation was stopped by acidified with H2SO4 to pH≈2 to the aqueous layer, and 10% solution of KI (1ml) and 3% solution of ammonium molybdate (three drops of) were added. In the presence of hydrogen peroxide I- is oxidised to I2, H2O2 + 2I- + 2H+→ 2H2O + I2, and with an excess of iodide ions, the tri-iodide ion is formed according to the reaction I2(aq) + I-→I3 -. Normally the reaction rate is slow but rate is increases with increasing acid concentrations, and the reaction almost condenses immediately when an ammonium molybdate solution was added to the reaction. The formation of I3 - is detected by UV-vis spectroscopy due to development of the characteristic I3 - band. (λ = 353 nm) [S7].
In the present study we have synthesized one complex containing dinuclear Copper (II) unit in good yield and characterized by single crystal X-ray diffraction technique along with spectroscopic studies. The dinuclear units are bridged by four syn-syn carboxylate ligands in the equatorial position and the apical position is occupied by the ACTP ligands, showing a paddle-wheel cage type structure with a distorted square pyramidal geometry. Complex 1 shows a good catecholase-like activity in the aerial oxidation of 3,5-di-tert butylcatechol to the corresponding o-quinone. Mechanistic investigations of the catalytic behavior of the complex were established by electrospray ionization mass study.
Supplementary Materials
The online version contains supplementary material available at ……
Acknowledgements
SKD gratefully acknowledge the Higher Education department, West Bengal for funding the instrumental facilities to the SKBU. We are gratefully thanks to Dr. Rajat Saha of Kazi Nazrul University, WB, India for his assistance.
Author contribution
All authors contributed to the study conception and design. Complex preparation, data collection, and analysis were performed by Priyanka Chakraborty and Abhishikta Chatterjee. The first draft of the manuscript was written by Priyanka Chakraborty and all authors commented on draft versions of the manuscript. Methodology, formal analysis, and visualization were performed by Priyanka Chakraborty and Abhishikta Chatterjee. All authors read and approved the final manuscript.
Funding
This work was financially supported by the WB-DST (Project Memo No 746 (Sanc)/ST/P. S&T/15G dt. 22.11.2016.). We acknowledge the WB-DST fellowship (partial) and SVMM fellowship (partial) to P. C. and the INSPIER fellowship to A.C. (Ref. No. DST/INSPIRE Fellowship/2017/IF170767 dt. 04.07.2018) was funded by DST, New Delhi.
Data availability: The corresponding .CIF files are available in the Cambridge Structural Database (CSD); for complex 1, the CCDC number is 2269299.
Code availability : Not applicable.
Competing interests: The authors declare that they have no known competing financial interests or personal relationships that could have appeared to influence the work reported in this paper.
Open Access This article is licensed under a Creative Commons Attribution 4.0 International License, which permits use, sharing, adaptation, distribution and reproduction in any medium or format, as long as you give appropriate credit to the original author(s) and the source, provide a link to the Creative Commons licence, and indicate if changes were made. The images or other third-party material in this article are included in the article's Creative Commons licence, unless indicated otherwise in a credit line to the material. If material is not included in the article's Creative Commons licence and your intended use is not permitted by statutory regulation or exceeds the permitted use, you will need to obtain permission directly from the copyright holder. To view a copy of this licence, visit http:// creativecommons. org/licenses/by/4.0/
- Noro S, Kitagawa S, Kondo M, Seki K (2000) A new, methane adsorbent, porous coordination polymer [{CuSiF6 (4, 4′-bipyridine) 2} n]. Angew Chem Int Ed 39:2081–2084
- Chatterjee A, Mondal P, Chakraborty P, Kumar B, Mondal S, Rizzoli C, Saha R, Adhikary B, Dey SK (2023) Strategic Synthesis of Heptacoordinated Fe (III) Bifunctional Complexes for Efficient Water Electrolysis, Angew Chem Int Ed, e202307832
- Dai J-C, Wu X-T, Fu Z-Y, Cui C-P, Hu S-M, Du W-X, Wu L-M, Zhang H-H, Sun R-Q (2002) Synthesis, structure, and fluorescence of the novel cadmium (II) – trimesate coordination polymers with different coordination architectures. Inorg Chem 41:1391–1396
- Dey SK, Bag B, Malik KMA, Fallah MS, El, Ribas J, Mitra S (2003) A Quasi-Tetrahedral Cu4 Cluster and a Helical-Chain Copper(II) Complex with Single Syn – Anti Carboxylate Bridges: Crystal Structure and Magnetic Properties. Inorg Chem 42(13):4029–4035
- Reger DL, Debreczeni A, Reinecke B, Rassolov V, Smith MD, Semeniuc RF (2009) Highly organized structures and unusual magnetic properties of paddlewheel copper (II) carboxylate dimers containing the π – π stacking,1,8-naphthalimide synthon. Inorg Chem 48:8911–8924
- Chattopadhyay K, Shaw BK, Saha SK, Ray D (2016) Unique trapping of paddlewheel copper (ii) carboxylate by ligand-bound {Cu 2} fragments for [Cu 6] assembly. Dalton Trans 45:6928–6938
- Viola, Muhammad N, Ikram M, Rehman S, Akhtar M, AlDamen M, Schulzke C (2019) A paddle wheel dinuclear Copper(II) carboxylate: Crystal structure, thermokinetic and magnetic properties. J Mol Struc 1196:754–759
- Jenniefer SJ, Muthiah PT (2013) Synthesis, characterization and X-ray structural studies of four copper (II) complexes containing dinuclear paddle wheel structures. Chem Cent J 7:35
- Tonigold M, Volkmer D (2010) Comparative solvolytic stabilities of copper (II) nanoballs and dinuclear Cu (II) paddle wheel units. Inorg Chim Acta 363:4220–4229
- Walczak-Nowicka ŁJ, Herbet M (2022) Sodium Benzoate-Harmfulness and Potential Use in Therapies for Disorders Related to the Nervous System: A Review. Nutrients 14:1497
- Agterberg FP, Provó Kluit HA, Driessen WL, Oevering H, Buijs W, Lakin MT, Spek AL, Reedijk J (1997) Dinuclear Paddle-Wheel Copper (II) Carboxylates in the Catalytic Oxidation of Carboxylic Acids. Unusual Polymeric Chains Found in the Single-Crystal X-ray Structures of [Tetrakis(µ-1-phenylcyclopropane-1-carboxylato-O,O’)bis(ethanol-O)dicopper (II)] and catena-Poly[[bis(µ-diphenylacetato-O:O’)dicopper](µ3-diphenylacetato-1-O:2-O’:1’-O’)(µ3-diphenylacetato-1-O: 2-O’:2’-O’)], Inorg. Chem. 36:4321–4328
- Banu KS, Mukherjee M, Guha A, Bhattacharya S, Zangrando E, Das D (2012) Dinuclear copper(II) complexes: Solvent dependent catecholase activity. Polyhedron 45:245–254
- Neves A, Rossi LM, Bortoluzzi AJ, Szpoganicz B, Wiezbicki C, Schwingel E, Haase W, Ostrovsky S (2002) Catecholase activity of a series of dicopper (II) complexes with variable Cu – OH (phenol) moieties. Inorg Chem 41:1788–1794
- Rey NA, Neves A, Bortoluzzi AJ, Pich CT, Terenzi H (2007) Catalytic promiscuity in biomimetic systems: catecholase-like activity, phosphatase-like activity, and hydrolytic DNA cleavage promoted by a new dicopper (II) hydroxo-bridged complex. Inorg Chem 46:348–350
- Osório RE, Peralta RA, Bortoluzzi AJ, de Almeida VR, Szpoganicz B, Fischer FL, Terenzi H, Mangrich AS, Mantovani KM, Ferreira DE (2012) Synthesis, magnetostructural correlation, and catalytic promiscuity of unsymmetric dinuclear copper (II) complexes: Models for catechol oxidases and hydrolases. Inorg Chem 51:1569–1589
- Banu KS, Chattopadhyay T, Banerjee A, Bhattacharya S, Suresh E, Nethaji M, Zangrando E, Das D (2008) Catechol oxidase activity of a series of new dinuclear copper (II) complexes with 3, 5-DTBC and TCC as substrates: syntheses, X-ray crystal structures, spectroscopic characterization of the adducts and kinetic studies. Inorg Chem 47:7083–7093
- Mandal S, Mukherjee J, Lloret F, Mukherjee R (2012) Modeling tyrosinase and catecholase activity using new m-xylyl-based ligands with bidentate alkylamine terminal coordination. Inorg Chem 51:13148–13161
- Torelli S, Belle C, Gautier-Luneau I, Pierre J, Saint-Aman E, Latour J, Le Pape L, Luneau D (2000) pH-Controlled change of the metal coordination in a dicopper (II) complex of the ligand H – BPMP: Crystal structures, magnetic properties, and catecholase activity. Inorg Chem 39:3526–3536
- Hwang IH, Jo YD, Kim H, Kim KB, Jung KD, Kim C, Kim Y, Kim SJ (2013) Catalytic transesterification reactions of one-dimensional coordination polymers containing paddle-wheel-type units connected by various bridging ligands. Inorganica Chim Acta 402:39–45
- Meng Q, Chen C, Wang L (2016) Synthesis, Structure and Catalytic Properties of a Cu(II) Coordination Polymer Constructed from Paddle-Wheel Building Blocks. J Clust Sci 27:1229–1238
- Dutta B, Pal B, Dey S, Maity S, Ray PP, Mir MH (2022) Exploitation of Structure-Property Relationships towards Multi-Dimensional Applications of a Paddle-Wheel Cu(II) Compound, Eur. J Inorg Chem 4:e202100904
- Bruker APEX3, Bruker SAINTSADABS (2016) AXS Inc., Madison,Wisconsin
- Sheldrick GM (2015) Acta Cryst. A71 3–8
- Sheldrick GM, Acta Cryst (2015). C71 3–8
- Dey SK, Shit S, Mitra S, Thompson LK, Malik KMA (2007) An antiferromagnetically coupled trinuclear Cu (II) complex containing µ (O, O′), µ (O) carboxylates and µ (O) phenoxide bridges. Inorg Chim Acta 360:1915–1920
- Ackermann MN, Nakamoto (1971) Kazuo), ACS Publications
- Dey SK, Bag B, Zhou Z, Chan AS, Mitra S (2004) Synthesis, characterization and crystal structure of a monomeric and a macrocyclic copper (II) complex with a large cavity using benzylacetylacetone ligand. Inorg Chim Acta 357:1991–1996
- Chatterjee A, Chakraborty P, Kumar B, Rizzoli C, Mandal P, Dey SK (2022) Synthesis, characterization of one Cr (III) complex: An efficient chemosensor for Cr (III) ions and designing of a molecular logic gate. J Mol Struct 1256:132486
- Sarkar M, Clerac R, Mathoniere C, Hearns NG, Bertolasi V, Ray D (2010) New µ4-oxido-bridged copper benzoate quasi-tetrahedron and bis-µ3-hydroxido-bridged copper azide and copper thiocyanate stepped cubanes: core conversion, structural diversity, and magnetic properties. Inorg Chem 49:6575–6585
- Zippel F, Ahlers F, Werner R, Haase W, Nolting H-F, Krebs B (1996) Structural and functional models for the dinuclear copper active site in catechol oxidases: syntheses, X-ray crystal structures, magnetic and spectral Properties, and X-ray absorption spectroscopic studies in solid state and in solution. Inorg Chem 35:3409–3419
- Jana A, Aliaga-Alcalde N, Ruiz E, Mohanta S (2013) Structures, magnetochemistry, spectroscopy, theoretical study, and catechol oxidase activity of dinuclear and dimer-of-dinuclear mixed-valence MnIIIMnII complexes derived from a macrocyclic ligand. Inorg Chem 52:7732–7746
- Das M, Nasani R, Saha M, Mobin SM, Mukhopadhyay S (2015) Nickel (II) complexes with a flexible piperazinyl moiety: studies on DNA and protein binding and catecholase like properties. Dalton Trans 44:2299–2310
- Vogel AI (1961) A Text Book of Quantitative Inorganic Analysis. Wiley, New York
- Mukherjee D, Nag P, Shteinman AA, Vennapusa SR, Mandal U, Mitra M (2021) Catechol oxidation promoted by bridging phenoxo moieties in a bis (µ-phenoxo)-bridged dicopper (ii) complex. RSC Adv 11:22951–22959
- Adhikari S, Banerjee A, Nandi S, Fondo M, Sanmartín-Matalobos J, Das D (2015) Structure, magnetism and catecholase activity of the first dicopper (ii) complex having a single µ-alkoxo bridge. RSC Adv 515:10987–10993
- Yang C-T, Vetrichelvan M, Yang X, Moubaraki B, Murray KS, Vittal JJ (2004) Syntheses, structural properties and catecholase activity of copper (II) complexes with reduced Schiff base N-(2-hydroxybenzyl)-amino acids. Dalton Trans 1:113–121
- Sreenivasulu B, Zhao F, Gao S, Vittal JJ (2006) Synthesis, structures and catecholase activity of a new series of dicopper (II) complexes of reduced Schiff base ligands. Eur J Inorg Chem 13:2656–2670
- Caglar S, Aydemir IE, Adıgüzel E, Caglar B, Demir S, Buyukgungor O (2013) Four copper (II) diclofenac complexes with pyridine derivatives: Synthesis, crystal structures, spectroscopic properties, thermal analysis and catechol oxidase activities. Inorg Chim Acta 408:131–138

Table 2. Selected (a) Bond distances (Å) and Bond angles (°) for complex 1.

Table 3. Kinetic parameters for the oxidation of 3, 5-DTBC catalyzed by complex 1
|
Solvent |
Vmax (M min-1) |
Std. error |
KM (M) |
Std. error |
kcat (h-1) |
|
Methanol |
1.98 × 10⁻² |
0.26 × 10⁻¹ |
4.79 × 10⁻⁴ |
2.72 × 10⁻³ |
28801.27 |
Table 4. Comparison of Kcat value for the oxidation of 3, 5-DTBC to 3,5-DTBQ by different copper complexes
|
complex |
solvent |
Vmax(M/min) |
KM(M) |
Kcat (h-1 ) |
Ref. |
|
[Cu2(papy)2(CH3OH)2] |
Methanol |
2.0 x 10⁻⁴ |
2.97x 10⁻⁴ |
7200 |
[29] |
|
[Cu(H2La)(HL)]ClO4 |
Methanol |
151.8 x 10⁻⁴ |
2.62x 10⁻³ |
9.11 x 10³ |
[30] |
|
[Cu2(Sam)2(H2O)2].H2O |
Methanol |
0.41 x 10⁻⁴ |
5.4 x 10⁻³ |
1140 |
[31] |
|
[Cu2(Sae)2].2H2O |
Methanol |
1.63 x 10⁻⁴ |
4.3 x 10⁻³ |
4612 |
[31] |
|
[Cu2(MeSch11)2(H2O)2] |
Methanol |
0.36 x 10⁻⁴ |
14.6 x 10⁻³ |
1080 |
[32] |
|
[Cu(dicl)2(2-pic)2] |
Methanol |
2.35 x 10⁻⁴ |
6.91 x 10⁻⁶ |
140.04 |
[33] |
|
[Cu(dicl)2(4-pic)2] |
Methanol |
1.69 x 10⁻⁴ |
9.84 x 10⁻⁵ |
101.16 |
[33]
|
|
[Cu2(H2L22 ) (OH) (H2O)-(NO3)](NO3)3.2H2O |
Methanol |
9.0x 10⁻⁴ |
2.3 x 10⁻³ |
32 400 |
[12] |
|
[Cu2(L23 ) (OH) (H2O)2](NO3)2 |
Methanol |
4.0x 10⁻⁴ |
7.6 x 10⁻³ |
14400 |
[12] |
|
[Cu2 (C6H5COO)4 (ACTP)2] |
Methanol |
1.98 × 10⁻² |
4.79 × 10⁻⁴ |
28801.27 |
Present work
|
Scheme 1 to 3 are available in the Supplementary Files section.
No competing interests reported.