4.1 FTIR analysis
FTIR spectra of pure ILs PY-HSO4 & BMIM-HSO4 and IL treated BC sheets i.e BC (Py-HSO4) & BC (BMIM-HSO4) is shown in Fig. 1. FTIR spectra of ILs showed that 800–950 range is attributed to S-O single bond and the range 950–1300 is responsible for S═O and 1300–1450 showed S-OH bonds (Fig. 1A).
All the distinguishing bands of bacterial cellulose have been identified in accordance with the literature. The broad band at 3340–3500 cm− 1 range shows functional group of bacterial cellulose and is ascribed to the OH stretching. Alkane (CH stretch) vibrations and asymmetric CH2 stretching are responsible for the peak at 2900 cm− 1. The peak at 2700–2800 cm− 1 depicts CH2 symmetric stretching. The peak at 1640 cm− 1 is due to OH distortion. The peak at 1400–1430 cm− 1 is due to CH2 deformation and the band at 1370 cm− 1 is ascribed to CH3 deformation. At 1340 cm− 1, IR displays OH deformation, and the bands responsible between 1320 cm− 1 and 1030 cm− 1 correspond to CO deformation [33].
ILs used to treat BC left no noticeable bands behind, showing that the treated cellulose had been thoroughly washed [23] as shown in Fig. 1B and C. After being treated with both ILs, the peak at 1640 cm− 1 which is dramatically reduced has been linked to OH distortion. Similar to this, after being treated with two different types of ILs, the intensity of the band at 1340 that has been linked to OH deformation [34]. When compared to the original cellulose, IR spectra of BC (BMIM-HSO4), BC (Py-HSO4) show no remarkable differences which is an indication of no chemical changes due to ILs treatment on BC [23].
4.2 Scanning electron microscopy (SEM)
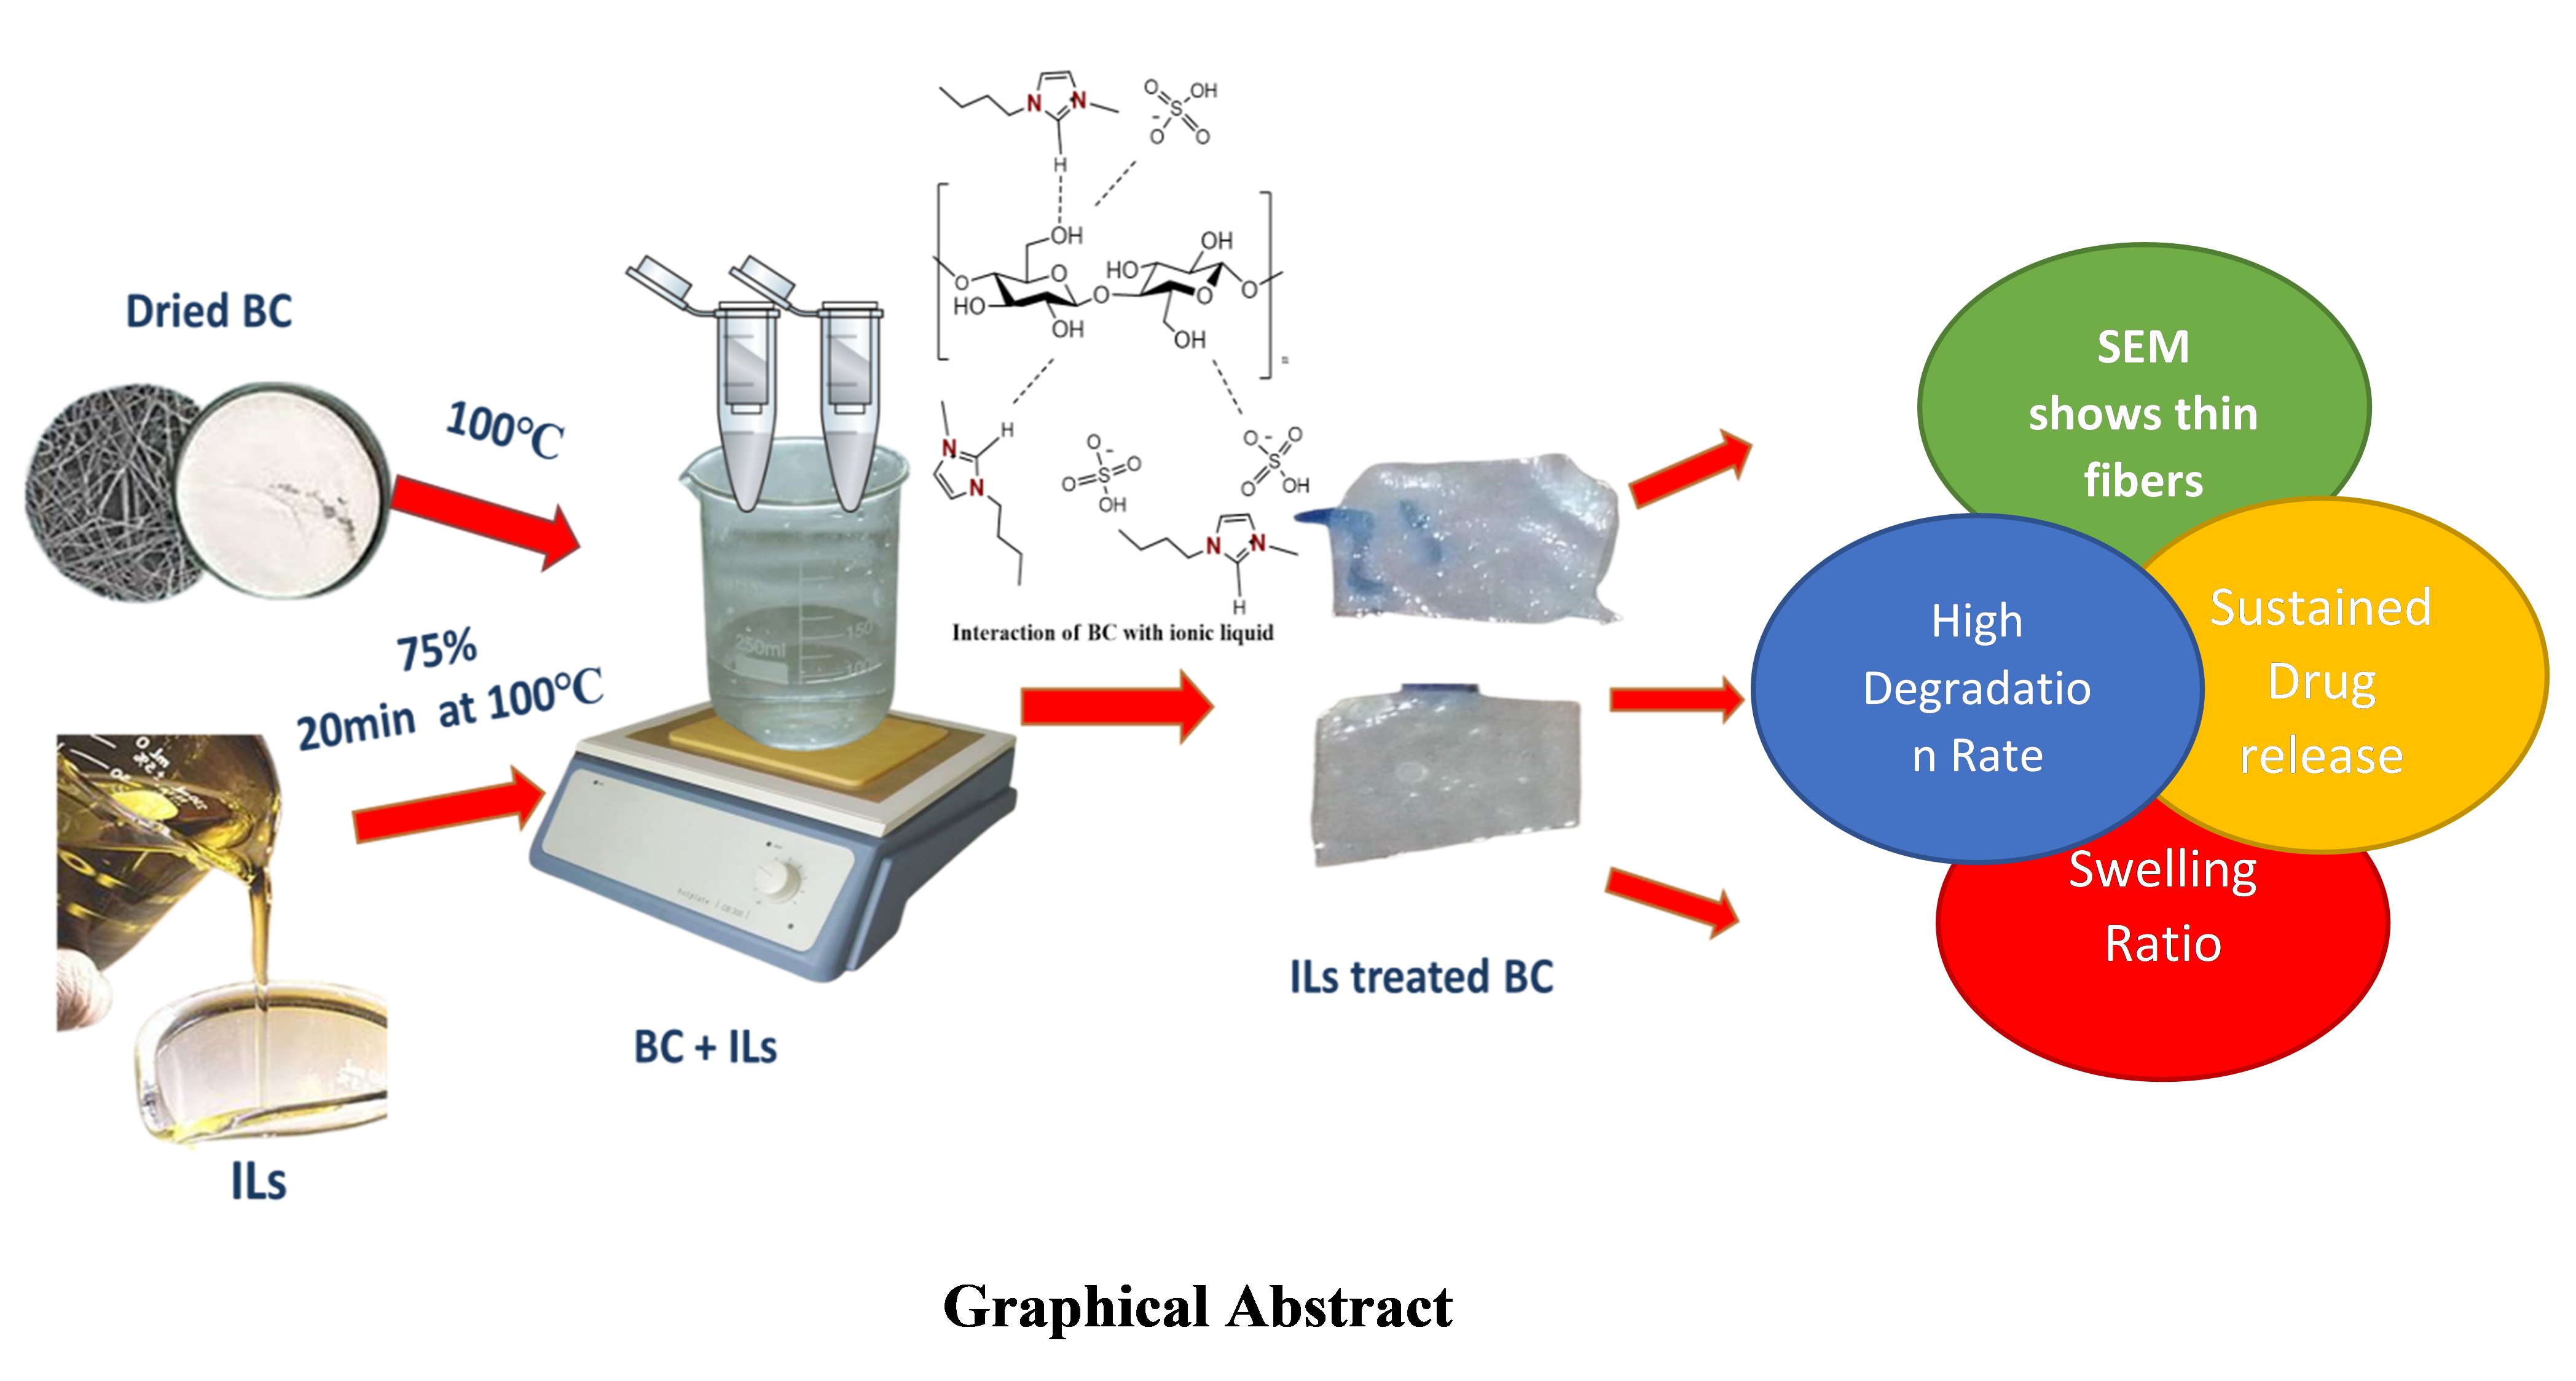
The structural morphology of BC after treatment with two types of ILs (BMIM-HSO4, Py-HSO4) at concentrations of 75% and temp of 100°C was examined using Scanning Electron Microscopy, as seen in Fig. 2. The structure of BC (control) was smooth, with visible normal BC fibrous structure. Continuous nanofibers with a diameter of roughly 60 nm made up the BC membrane. The BC nanofibers displayed a smooth surface morphology and a three-dimensional porous network structure [44]. Microfibrils that are intertwined, securely fastened, and extremely robust constitute the surface morphology of BC (Fig. 2) [45].
Fiber networks structured erratically or arbitrarily in three dimensions were converted into bacterial cellulose films by bacteria during fermentation. BC web ribbons range in length from 1 to 9 m and produce an extensive network of hydrogen bonding in a complex reticulation pattern serving as a stabilizer for framework [35]. Following IL treatment, morphological alterations occurred in both BC (BMIM-HSO4), BC (Py-HSO4) membranes. The treatment of BC caused partial degradation in both cases. The fibrous structure of BC after treatment with BC (Py-HSO4) resulted in partial melting of the fibers and they became merged into one another (Fig. 2D, E, F). While after treatment with BMIM-HSO4, the fibrous structure of BC became thin and sowed some degradability (Fig. 2G, H, I). Because BMIM-HSO4 and Py-HSO4 are solvents in their own capacity therefore they have the potential to break hydrogen bonds inside BC fibers, resulting in amorphous and fragile-looking particles and fibers [36].
The two ionic liquids were utilized in three different concentrations (25%, 75%,100%) to treat BC. The BC sheets were not degradable after three hours at a concentration of 25% at 100oC. Similarly, no changes were seen using 75% at 100oC for 5, 10, or 15 minutes, but after 20 minutes, BC became porous and thinner. However further exposure for longer time disintegrated the fibrous structure followed by dissolution. When BC was treated with 100% ILs for 5, 10, and 15 minutes, it became thin and partly disintegrated and further exposure after 15 minutes completely disintegrated and dissolved. Therefore, in comparison to other concentrations the 75% of ILs at 100°C was considered to be more suitable for developing degradable BC without disturbing its integrity.
4.3 XRD Analysis of BC and ILs treated BC
Figure 3 displays the diffractogram of BC after treatment with BMIM-HSO4 and Py-HSO4. Three intense peaks can be seen in the diffraction patterns of 22.7°, 14.4°, 16.6° which denote the planar crystals of (100), (010), and (110). BC has a cellulose I crystal structure that created a triclinic structure [36]. BC (Fig. 3) possesses a crystal structure indicative of cellulose type I and a high crystallinity (84–89%) [8]. After treatment with ionic liquid BMIM-HSO4, crystallinity of BC sheet was reduced at a concentration of 75% at 100℃. It demonstrates that crystallinity of BC was lost and relates to the morphology of the material that exhibits damage. After being treated with Py-HSO4, crystallinity of BC was lost at 75% conc. and 100℃ and the fibrous structure of BC became more distorted. After the treatments of two ILs, the crystallinity is disrupted. As a result of the reaction of ILs, the structure of BC becomes amorphous.
4.4 Contact Angle Measurements
A precise metric for detecting changes in surface characteristics of polymer is wettability [37]. Variations in the contact angle of a liquid on the surface are used to quantify wettability. Untreated BC surfaces typically have contact angles below 90° because they are hydrophilic. The contact angle of the untreated BC was 57° (Fig. 4A). It is clear that the ILs treatments had a significant impact on the contact angle reduction, increasing the hydrophilic properties of the material (Fig. 4B & C). Py-HSO4 treated BC showed contact angle of 46° and the contact angle of BC after treatment with BMIM-HSO4 was 30°. Hydrophilic nature is attributed to more amorphous regions.
4.5 Swelling Studies of BC-ILs
The swelling or water absorption of the IL treated BC is shown in Fig. 5. All BC-ILs membranes quickly absorb water during the first three hours of the assay before gradually increasing for next 24 hrs. Bacterial cellulose shows a higher swelling ratio after being treated with ILs than it does without treatment. Initially the control BC membrane absorbed a significant amount of water (Fig. 5) within an hr the BC membrane attained swelling ratio of 421.6%, which subsequently slightly rose to 513% after 2 hrs and 586% after 3 hrs and after 4 hrs 651% and 696% 5 hrs. The total swelling ratio achieved after 24 hrs was 718%. After one hr, the swelling ratio of BC (Py-HSO4) reached a value of 591% and then gradually increased to 743% after 2 hrs, and 816% after 3 hrs, 907% after 4 hrs and 951% after 5 hrs. BC (Py-HSO4) reached its maximum swelling ratio of 996% after 24 hrs. BC (BMIM-HSO4), exhibited significantly higher swelling ratio than BC (Control) and BC (Py-HSO4). The swelling ratio BC (BMIM-HSO4) reached 764% after one hour, and it gradually increased to 799% after 2 hrs, 968% after 3 hrs,1051% after 4 hrs and 1087% after 5 hrs and 1113% after 24 hrs (Fig. 5). Both BC (BMIM-HSO4) and BC (PY-HSO4) swell at a rate that is noticeably higher than BC (control), which is associated with the hydrophilic character of the ILs [38]. BC has a lower swelling ratio because of its increased crystallinity. The BC fiber structure is, however, degraded by ILs, and as a result, BC membranes treated with ionic liquids became amorphous. Therefore, BC treated with these ionic liquids has higher swelling rate.
4.6 In vitro Degradation Assays
Figure 6 illustrates the in vitro degradation of BC and BC treated with ILs in PBS over various time periods (3, 7, 14, 21, 28 days) at 37℃. Weight loss percentages were determined according to the differences between dry weights of the treated BC. At all-time points, weight loss of BC (BMIM- HSO4) was significantly higher than BC (Py-HSO4). Higher hydrophilicity of BC (BMIM-HSO4) as compared to BC (Py-HSO4) may be the cause of the greater weight loss. After 28 days, BC (BMIM-HSO4) showed a weight reduction of 56%, while BC (Py-HSO4) had a weight loss of 36%.
PBS can cause BC micro-fibrils to swell many folds after some time. The C-O bonds in the BC molecular chains weaken and eventually break under the influence of ions and molecules of water from the area with weak bonding force. Similar mechanism of BC degradation in PBS was also explained in literature [39].The degradation rate of BC continuously increased up to 14 days and then became constant after a weight reduction of approximately 14.3%. This BC breakdown in PBS is primarily caused by the significantly high swelling of BC fibers [39]. The treatment of bacterial cellulose membranes by Ionic liquids BMIM HSO4 and PY-HSO4 resulted in a significantly faster degradation over time (Fig. 6). The degradation of BC (Py-HSO4) was 9%, 18%, 21.6%, 27%, and 36% after 3, 7, 14, 21 and 28 days respectively. However, there was a significantly higher degradation in the case of BC (BMIM-HSO4) compared to the BC (Py-HSO4). After 3 days the degradation was 12.25%, after 7 days it was 21%, after 14 days it was 35%, after 21 days it was 49.1% and after 28 days it was 56.1%. These values were 20.1% higher than the BC (Py-HSO4) and were 41.8% higher than Control.
4.7 Drug Release Profile
The UV-VIS absorbance values for CAP and MNZ were recorded at specific wavelengths of 280 nm and 320 nm respectively. These absorbance values (y) of CAP and MNZ were used to draw standard curve using the equation (y = mx + c) to find the value of unknown concentrations. Quantitative UV-VIS spectrophotometry was performed to study the drug release profile of CAP and MNZ. From the standard straight-line curve, the unknown concentration of drug released was determined.
Figure 7 MNZ release profile of BC and ILs-BC(A), CAP release profile of BC and ILs-BC (B)
The time-dependent drug release from BC membranes treated with Py-HSO4 and BMIM-HSO4 was investigated using PBS and UV-VIS spectroscopy in the 200–700 nm region. CAP and MNZ had lambda max of 320 nm and 278 nm, respectively. As illustrated in Fig. 7, the % cumulative drug release was used to study the release pattern over a three-day period. When compared to BC, membranes treated with ILs that were loaded with CAP and MNZ demonstrated sustained release. The chosen time period was 0.25, 0.5, 0.75, 1, 2, 3, 4, 24, 48, and 72 hrs in order to monitor the release profile. In the case of BC (Py-HSO4) loaded with MNZ, the treated membranes first demonstrated burst release of 31% within first 4 hrs, and then sustained release of 48% for the next 72 hrs. The BC (BMIM-HSO4) treated membranes showed 20% release after 4 hrs and after this time interval and sustained release of 37% after 72 hrs. Whereas, metronidazole loaded BC membranes showed 71% release within 72 hours (Fig. 7). CAP loaded BC (Py-HSO4) had a cumulative drug release of 51.09% after 3 hrs and 79% after 72 hrs. In the case of BC (BMIM-HSO4) treated membranes that had been loaded with CAP, the cumulative drug release was 37% after 3 hrs, and 72% after 70 hrs. On the contrary the BC (Control) loaded with CAP displayed burst release of 99.8% within 70 hrs (Fig. 7). Since, degradable membranes showed sustained release which is supportive of wound healing process.
4.8 Anti-Bacterial Studies
The effectiveness of CAP-loaded BC-ILs membranes on S. aureus and E. coli was examined. The inhibitory zones difference between pure ionic liquids treated BC membranes and membranes containing CAP was measured (Fig. 8). The CAP-containing BC membranes treated with BMIM-HSO4 and Py-HSO4 both shown antibacterial activity against the two model bacteria with inhibitory zones of 35 mm. Similarly, MNZ loaded Py-HSO4 and BMIM-HSO4 treated BC showed inhibitory zones of 40 mm on E. coli as well as S. aureus. The positive controls that are CAP and MNZ showed inhibitory zones of 22 mm on E. coli and S. aureus.
It can be concluded that the antimicrobial activity seen in disc diffusion experiments is due to CAP and MNZ loaded into BC-ILs sheets. The drugs have a known effect on both pathogens and here it is indicative of the loading efficiency and sustained release behavior of BC-ILs sheets. It can thus be envisaged that these IL treated BC sheets can be used in wound healing applications using any drug.
4.9 In Vitro Biocompatibility of BC-ILs membranes
In vitro cytotoxicity studies were performed using fibroblast NIH3T3 cells to determine whether the BC-ILs membranes and drug loaded BC-ILs membranes are biocompatible. The results of cytotoxicity studies of BC (control) and BC-ILs sheets are shown in Fig. 9. Cytocompatibility was measured after direct contact with the materials for 1, 3, and 7 days. BC is known for its biocompatibility, and the values as high as 95% from BC-ILs and drug-loaded BC sheets show that these are non-toxic and biocompatible too. All samples had 100% biocompatibility after the first day there was no statistical difference from the control (p > 0.05). BC (Py-HSO4) and BC (BMIM-HSO4) showed almost equal cell viability [40]. Furthermore, MNZ loaded BC (Py-HSO4) and BC (BMIM-HSO4) show higher cell viability as compared to CAP loaded sheets. After 7 days of direct contact with the samples, there wasn't any significant difference between the cytocompatibility of BC (Control), BC-ILs and drug loaded BC-ILs. According to ASTM standards a biocompatibility higher than 70% is considered acceptable for the implant biomaterials.