Isolation and culture of ADSCs
Human subcutaneous adipose tissue samples were obtained from healthy women who had undergone abdominal liposuction. Informed consent was obtained from all study participants. Primary ADSCs were generated from the tissue samples, as described previously (27). The cells were pelleted and then resuspended and cultured in basal medium (Cyagen, Guangzhou, China) supplemented with 10% fetal bovine serum (FBS) (Cyagen). A humidified incubator with 5% CO2 was used for maintaining cell cultures. The medium was changed every 2–3 days after cell attachment to the bottom of the tissue culture flasks.
Identification of ADSCs
After three passages, ADSCs were collected and labeled with anti-human CD90-FITC (Thermo Fisher Scientific, Waltham, MA, USA) and anti-human HLA-DR APC-Cy7 (BioLegend, San Diego, CA, USA) antibodies for 30 min. They were then analyzed using flow cytometry (Beckman, Pasadena, CA, USA). For multidirectional differentiation characterization, ADSCs were cultured with osteogenic (Cyagen) and adipogenic (Cyagen) differentiation media for 2 weeks. Then, the osteogenic and adipogenic differentiation potentials were evaluated using alizarin red S (Cyagen) staining for 5 min and oil red O (Cyagen) staining for 30 min, respectively.
Cell proliferation assay
To elucidate the effect of TNF-α on the proliferation of ADSCs, ADSCs were seeded into 96-well plates at a density of 4000 cells/well. After the cells were cultured for 12 h, the medium was replaced with 100 µL basal medium containing TNF-α (PeproTech, Cranbury, Nj, USA) (0, 5, or 100 ng/ml). Cell growth was analyzed 24, 48, 72, or 96 h after treatment. 10 µL CCK-8 (Cell Counting Kit-8) reagent (YiShan Biotech, Shanghai, China) was added to each well at each observation time point. After 2 h of incubation, the OD value was measured at 450 nm using the enzyme-labeled instrument (Tecan, Thermo Fisher Scientific). To determine the distribution of ADSCs across cell cycle phases, the intensity of propidium iodide fluorescence was analyzed using a cell cycle staining kit (Multi Sciences, Ningbo, China).
Immunofluorescence assay
ADSCs were first incubated with TNF-α (0, 5, or 100 ng/ml) on glass coverslips for 48 h. Then, they were collected, fixed, permeabilized, and stained with a primary antibody against Ki-67 (1:500; Abcam, Cambridge, UK). An optical microscope (Olympus, Tokyo, Japan) was used to obtain images of stained sections.
Cell scratch assay
A cell scratch assay was used to examine the effect of TNF-α (0, 5, or 100 ng/ml) on the migration of ADSCs. ADSCs were seeded in 6-well plates at 1 x 10⁶ cells/well and grown to 80–90% confluency. A 20 µL sterile pipette tip was used to create a scratch across the cell monolayer quickly. The unattached cells were removed by washing the monolayer 2–3 times with PBS (Phosphate buffer saline). The scratched area was photographed with a microscope (Olympus) at 0, 12, and 24 h. The ImageJ software (Bethesda, Montgomery County, MD, USA) was used to measure the scratched area. Migration area (%) was defined as 100% × (S0 – St)/S0 and was used to indicate cell migration ability (St represents the residual scratched area at the time point of t h).
Cell apoptosis analysis
ADSCs were incubated for 48 h with TNF-α (0, 5, or 100 ng/ml). They were then detached from the surface of the culture flask for analysis. The Annexin V Apoptosis Detection Kit FITC (Thermo Fisher Scientific) was used to evaluate the proportion of apoptotic cells in the cell suspension.
Preparation of human umbilical vein endothelial cells (HUVECs) and t-ADSCs
HUVECs were cultured in high-glucose Dulbecco’s modified Eagle’s medium (DMEM) (HyClone, Logan, UT, USA) mixed with 10% FBS. The culture medium was changed every 2–3 days.
ADSCs were incubated with 5 ng/ml TNF-α for 24 h in basal medium supplemented with 1% FBS. The t-ADSCs formed were then washed 2–3 times with PBS. Then, they were collected for subsequent experiments.
Tube formation and EdU assays
HUVECs were seeded in 24-well plates and cultured to 70–80% confluency. They were then divided into three groups: HUVEC group, HUVEC + ADSC group, and HUVEC + t-ADSC group. The HUVECs were cultured in high-glucose DMEM in HUVEC group. Transwell polycarbonate membranes (0.4-µM; Sangon Biotech, Shanghai, China) were used for co-culturing ADSCs and t-ADSCs with HUVECs in the HUVEC + ADSC group and HUVEC + t-ADSC group, respectively (Fig. 2A). After the cells were co-cultured for 48 h, the HUVECs were collected for EdU and tube formation assays.
HUVEC proliferation rate was detected using the EdU assay kit (Sangon Biotech, Shanghai, China). Fluorescence staining was performed according to the manufacturer's protocol. The results were photographed using the fluorescence microscope and analyzed using the ImageJ software.
To visually analyze the pro-angiogenic ability of ADSCs, a 300-µL Matrigel matrix (Corning, Corning, NY, USA) was transferred to a 24-well plate. After a 30-min incubation in an incubator set at 37°C, the HUVECs from the above three groups were seeded onto the Matrigel matrix for 48 h. The tube-like structures that formed were photographed using an inverted microscope (Olympus) at 40× magnification. The ImageJ software was used to analyze the total length and the number of segments of HUVEC.
RNA extraction and functional analysis
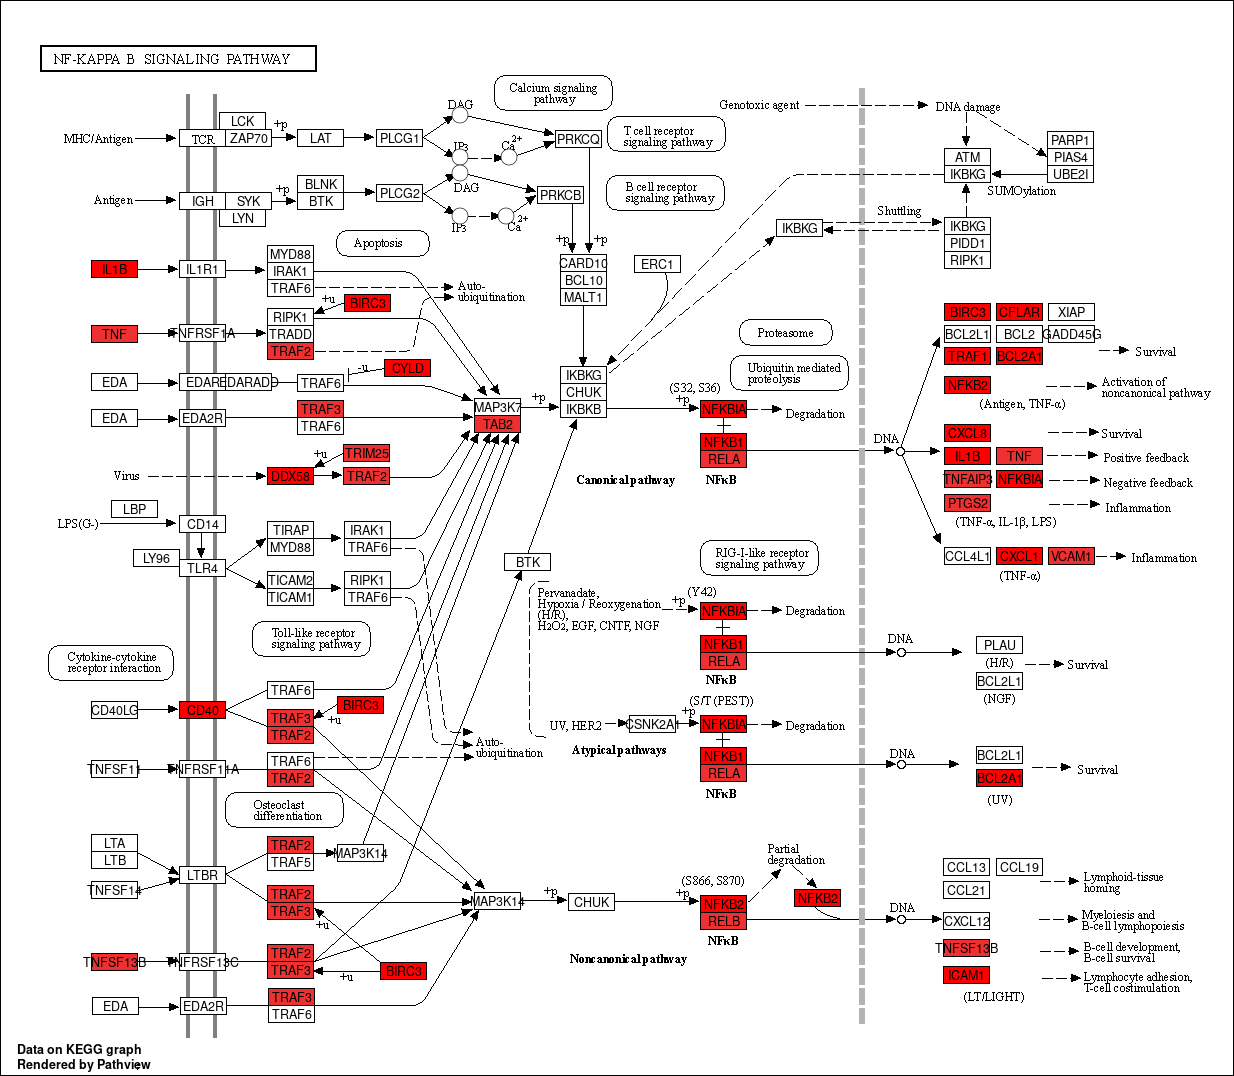
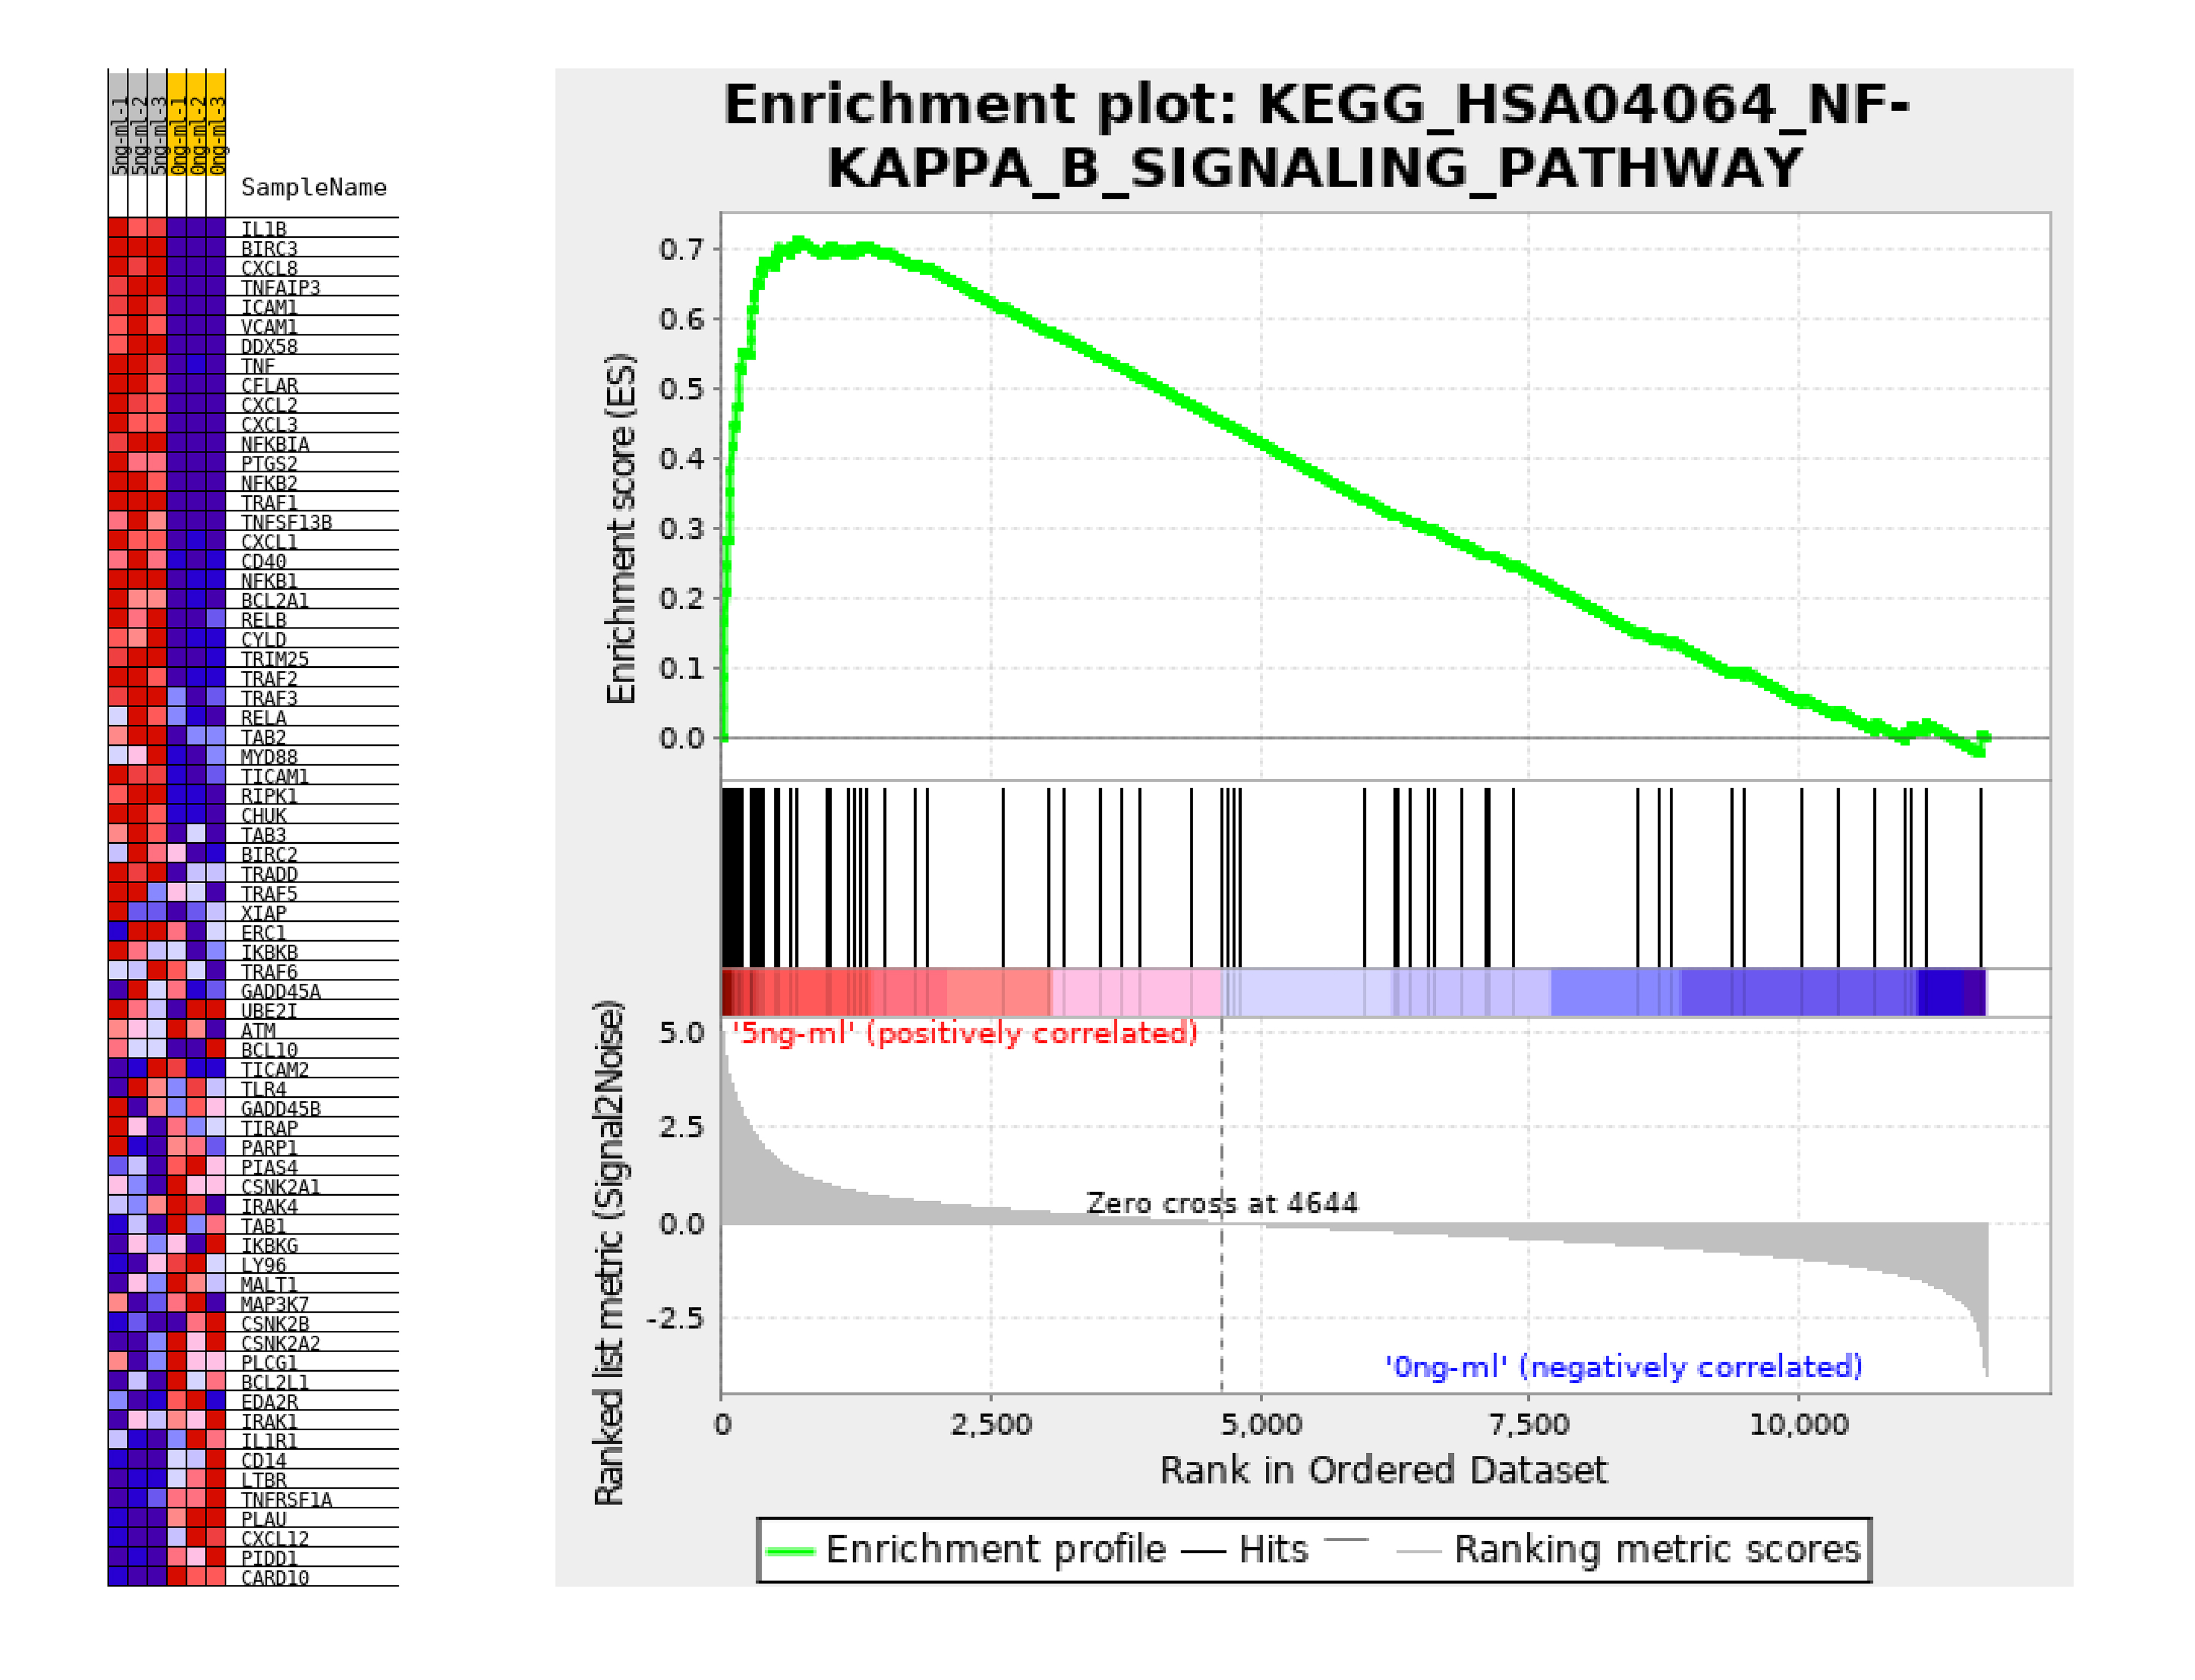
RNA was extracted from the t-ADSCs (TNF-α: 5 ng/ml) and ADSCs (TNF-α: 0 ng/ml) using TRIzol reagent (Invitrogen, Carlsbad, CA, USA). Both groups contained three biological samples. For RNA sequencing, rRNAs were removed and the remaining RNAs were used for constructing sequence libraries. The libraries were generated using the Illumina protocol. Library quality was assessed using the Agilent 2100 platform and sequenced using the Illumina NovaSeq 6000 platform. Next, the reads were aligned to the reference genome. Mapping counts for the known annotated genes, including genes encoding mRNAs, were then generated. The gene expression levels were represented as the total fragments per kilobase of transcript per million mapped reads (FPKM) values. The FPKM ratios of the two groups were represented as fold changes (FCs) in gene expression. Genes with P < 0.05 and |log2 FC| > 0.585 were considered to have significantly differential expression. The differentially expressed genes (DEGs) were then analyzed. Functional analysis, including Gene oncology (GO), Kyoto Encyclopedia of Genes and Genomes (KEGG), protein-protein interaction (PPI) network, and the Gene Set Enrichment Analysis (GSEA) was used to systematically analyze the significantly enriched signaling pathways via the major public pathway database in this study. P < 0.05 was considered to indicate statistically significant results.
ELISA
ELISA was used to explore the effect of TNF-α (0, 5, or 100 ng/ml) on the paracrine angiogenic factors of ADSCs. Changes in the paracrine signaling ability of ADSCs after removal of TNF-α stimulation (24, 48, 72, 96 h) were also assessed. ADSCs were treated with TNF-α (0, 5, or 100 ng/ml) in basal medium supplemented with 1% FBS for 24 h. The cell culture medium was changed every day. The supernatants were collected to evaluate the concentrations of IL-8 and vascular endothelial growth factor (VEGF) using the Human IL-8 and VEGF ELISA Kits (RayBiotech, Atlanta, GA, USA), respectively. The kits were used according to the manufacturer’s instructions.
Next, anacardic acid (AbMole, Houston, TX, USA), an inhibitor of NF-κB, was used to assess the effect of NF-κB on IL-8 and VEGF expression.
Western blotting
ADSCs were first treated with TNF-α (5 ng/ml) in basal medium supplemented with 1% FBS. TNF-α was removed at 30, 60, and 120 min after incubation. The t-ADSCs were digested for western blotting. The proteins from each sample were extracted and transferred to PVDF membranes (Millipore, MA, USA) at 300 mA for 2 h. The Membrane was first incubated in blocking buffer (5% bovine serum albumin) for 2 h at room temperature and then incubated with primary GAPDH antibody (1:20000, Cell Signaling Technology, MA, USA), IκBα antibody (1:1000, Cell Signaling Technology), pp65 antibody (1:1000, Cell Signaling Technology), or p65 antibody (1:1000, Cell Signaling Technology) overnight at 4°C. The membrane was then incubated with the appropriate horseradish peroxidase-conjugated secondary antibody (1:5000; Cell Signaling Technology) for 2 h. Chemiluminescence was employed to visualize protein expression using an Alpha Imager scanner (Tecan).
CM-Dil labeling
ADSCs or t-ADSCs were labeled with the CM-Dil dye (Invitrogen) at passage five for long-term cell tracking in vivo. Cells were detached with 0.25% trypsin EDTA (Thermo Fisher Scientific) and centrifuged at 250 ×g. The supernatant was discharged. The cell pellet was resuspended with PBS to a final concentration of 1 × 10⁶ cells/ml. CM-DiI (20 mM) was added and incubated for 5 min at 37°C. Cells were then shaken slowly at 4°C for 15 min and centrifuged at 250 ×g at room temperature. The supernatant was discharged, and the cell pellet was washed 2–3 times with PBS. Next, the cells were resuspended in PBS to a final concentration of 1 × 10⁶ cells/ml for intradermal injection.
Animal model
This study was approved by the Ethics Committee of Naval Medical University. This project was part of the National Natural Science Foundation of China and the approval number was 32071186. Sprague-Dawley rats (female, weighing 180–200 g) were obtained from the animal center of Naval Medical University. The animals were maintained in a 12-h light/dark cycle and housed individually to avoid scratching each other's skin. All experiments were conducted along the guidelines set by the Ethics Committee of Naval Medical University.
A total of 14 rats in the experiments were divided into two parts and they were anesthetized with inhaled gas anesthesia (O2, 2 L/min; isoflurane, 2%) prior to surgery. The first part involved the detection of the angiogenesis changes in the donor skin after seven days of pretreatment (PBS, ADSCs or t-ADSCs). The second part involved the detection of the survival rate and quality changes using the pretreated skin for FTSGs transplantation.
In the first part, black ink was used to tattoo 2 × 2 cm2 areas of donor skin at equal distances of 1 cm on the right and left sides of the spinal region of rats (Fig. 5B, above, left). A total of 12 donor skin (six rats, each rat with two donor skin) were randomly divided into four groups and were injected with different solutions intradermally: control (no injection) group, PBS group, ADSC group, and t-ADSC group. A 1 ml cell resuspension solution (1 × 10⁶ ADSCs or t-ADSCs) or 1 ml PBS was injected intradermally into the marked area using multiple parallel injections (Fig. 5B, above, middle). Strong injection resistance, transient pallor of the skin, and raised wheals were considered as the clinical manifestations of successful intradermal injection (Fig. 5B, above, right). Seven days after cell injection, the rats were sacrificed and the donor skin areas were harvested.
In the second part, a total of 15 donor skin (eight rats, each rat with two donor skin) were randomly divided into five groups according to the different treatments: control (no injection) group, pre-PBS group, pre-ADSC group, pre-t-ADSC group, and post-ADSC group. After seven days of pretreatment (same as in part one), the donor skin was excised (Fig. 5B, below, left), and the panniculus carnosus was removed to obtain FTSGs for grafting. The FTSGs were then reattached to the underlying muscle fascial layer with 3–0 sutures. Gauze (Fig. 5B, below, middle) and elastic bandages (Fig. 5B, below, right) were used for partial pack compression wrap. In the post-ADSC group, 1 × 10⁶ ADSC in 1 ml of PBS was injected under the skin graft directly. The skin graft areas were recorded using photographs on days 2, 3, 5, 7, 14, 21, and 28 post grafting. The grafts were then harvested on post grafting day 28.
Anastomosis detection
The anastomosis level at 48 h after grafting between grafts and bed vessels was detected using the speed of skin graft temperature recovery. Blood perfusion was assessed using a smartphone-compatible thermal imaging camera (HIKMICRO, Hangzhou, China). Skin grafts were wiped using alcohol-soaked cotton balls for 10 s to cool the graft surface to a low temperature. The smartphone-based thermal imaging system was fixed 25 cm above the grafting region. A six-photograph sequence with 15-s intervals was taken over the course of 2 min for each sample.
Histological examination
Slide sections were prepared from paraffin-embedded skin tissue of grafts from the samples from the first and second experimental parts. Samples from the first part were stained with hematoxylin and eosin (HE) and immunofluorescence staining. An anti-rat CD31+ monoclonal antibody (Servicebio, Wuhan, China) was used at a dilution of 1:150 for overnight incubation with the samples at 4°C. Samples from the second part were stained with HE and Masson’s trichrome stain. Manufacturers’ instructions were followed (27).
Statistical analysis
Mean ± SD was used to represent all values. We used the GraphPad Prism 9 (GraphPad, CA) software to perform One-way ANOVA followed by Bonferroni’s multiple comparison tests, two-way ANOVA, or unpaired Student’s t test in order to determine the statistical significance.