Materials
Curcumin (Cur) and sodium tripolyphosphate (TPP) were purchased from Aladdin Co. LTD (Beijing, China). Sodium hyaluronate (HA, MW=170 kDa) was provided by Dongyuan Biochem. Co. Ltd. (Jiangsu, China). Chitosan hydrochloride (CS, MW=110 kDa) was provided from Zhejiang Aoxing Biochem Co. Ltd. Cell counting kit-8 was purchased from Dojindo Laboratories (Tokyo, Japan). Ethylenediamine, 1-ethyl-3(3-dimethylaminopropyl) carbodiimide (EDC), N-hydroxysuccinimide (NHS), penicillin and streptomycin, dialysis membrane (cutoff 3000 Da) were provided by Sigma-Aldrich (St. Louis, MO, USA). Cyanine-5.5 amine (Cy-5.5-NH2) was purchased from Xi’an Ruixi Biological Technology Co., LTD. Antago3 with or without Cyanine-3 (Cy-3) labeling (antago3, 5’-CGGTCTGGGCCGCCGA-3’) and the PCR primers were synthesized and supplied by Sangon Biotech Co. LTD (Shanghai, China). DNase I was purchased from Beyotime Biotech Co. LTD (Shanghai, China). Dulbecco’s modified Eagle’s medium (DMEM), penicillin, streptomycin, and fetal bovine serum (FBS) were purchased from Gibco BRL (Grand Island, NY, USA). Antibodies were purchased from Abcam, Inc. All the other agents were analytical-grade and used as received unless otherwise specified. Triple distilled water was used throughout the experiments and was supplied by a Milli-Q purification system (Millipore Co., Billerica, MA, USA).
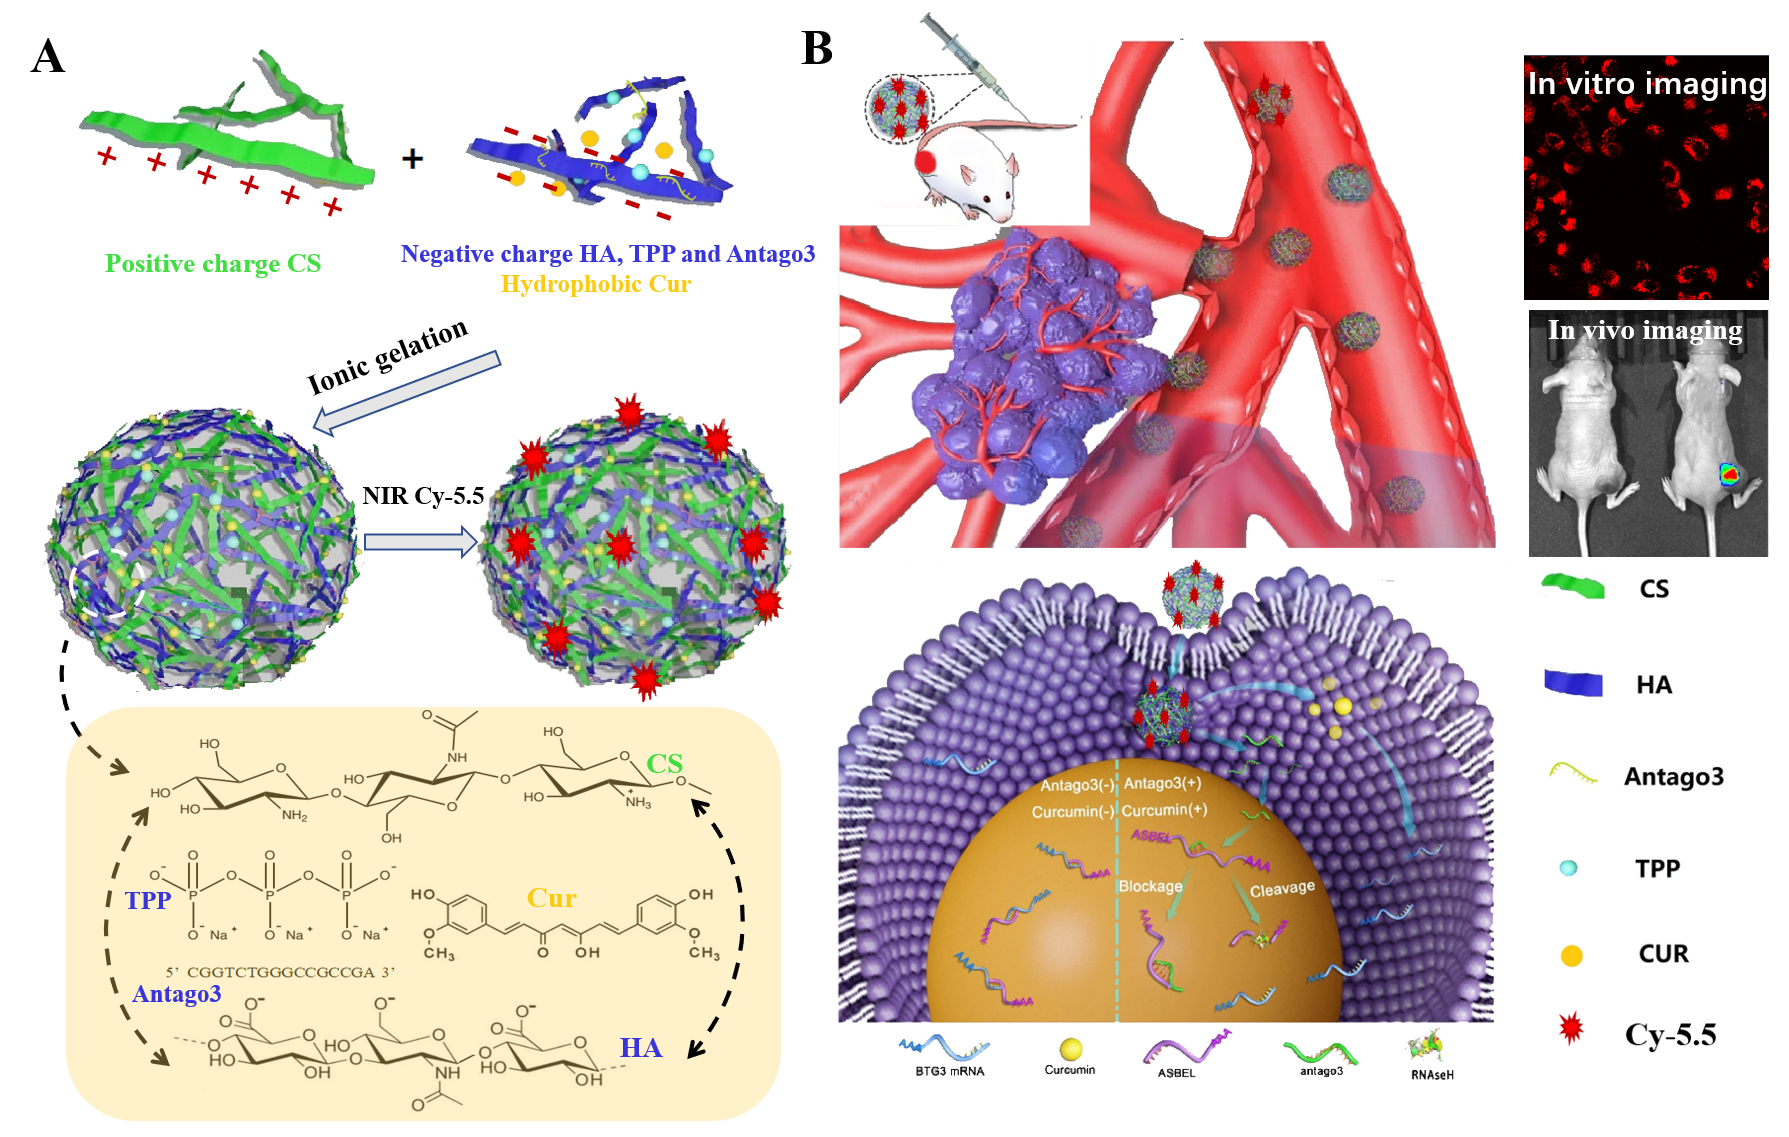
Preparation of BNPs, CNPs, CANPs and FCANPs
According to the protocols described in our previous study related to the preparation of HA-CS-based SPEC NPs [53], in this study, we prepared blank NPs (BNPs), Cur-loaded NPs (CNPs), antago3-loaded NPs (ANPs) and Cur-antago3-loaded NPs (CANPs) with slight modifications, respectively. Briefly, fresh stock solutions of HA (1.25 mg/ml), CS (0.6125 mg/ml) and TPP (0.5 mg/ml) were prepared in Dnase-free water followed by sonication for 10 min. All the solutions were filtered through a 0.22 µm pore size filter to remove any macroscopic material and bacteria possibly present. 100 µl of TPP solution was firstly mixed with 2 ml of HA solution. 2 ml of CS solution was dropwise added to the HA-TPP mixed solution. After the addition, the complexation was carried at room temperature and under magnetic stirring for a duration of 10 min. The solution was then centrifuged for 10 min with the speed of 3000 g in a glycerol bed. The resulting precipitate was then washed twice and dispersed in Dnase-free water as BNPs solution for further analysis and use.
The same procedure was followed as described for the preparation of CNPs, ANPs and CANPs. For the preparation of CNPs, various amounts of Cur dissolved in methanol was firstly added to 2.0 ml of HA-TPP solution phase. For the preparation of ANPs, various amounts of antago3 dissolved in 100 µl Dnase-free water were first added to TPP-HA solution phase. For the preparation of CANPs, various amounts of Cur dissolved in methanol and antago3 dissolved in Dnase-free water were simultaneously added to the TPP-HA solution. All the three kinds of NPs were then prepared by the same methods for preparing BNPs as described above. For preparation of NIR fluorescent CANPs (FCANPs), CANPs were therefore surface decorated with NIR dye Cy-5.5. In brief, CANPs were chemically modified with NH2-modified Cy-5.5 (Cy-5.5-HN2) in the presence of EDC and NHS for 2 h reaction. The mass ratio of CANPs to Cy-5.5-NH2 was fixed at 20:1. To remove unconjugated free Cy-5.5-NH2, the FCANPs solution was centrifuged using the ultrafiltration (Molecule cut-off, 3000 Da MWCO) for 30 min with the speed of 3000 g in a glycerol bed. After purification, the FCANPs were redispersed and used for further experiments.
Characterization
Dynamic light scattering (DLS) was used to determine the hydrodynamic size and zeta potential with a Malvern ZetaSizer Nano-ZS (Malvern Instruments Ltd., Malvern, UK) at 25 °C. The morphologies of BNPs, CNPs, ANPs and CANPs were observed by transmission electron microscopy (TEM) (Tecnai G2 20 S-TWIN, FEI Company, Philips, Netherlands). The samples on carbon-coated copper grid were negatively stained with 0.3% w/v of uranyl acetate. Fluorescence spectra was recorded on a LS-55 fluorescence spectrometer (PerkinElmer, Fremont, CA). Fluorescence spectra of Cy-5.5 were obtained using an excitation wavelength of 675 nm. NIR Fluorescence images were obtained using the CRI Maestro Imaging System (Cambridge Research and Instrumentation Inc., USA). The encapsulation efficiency (EE%) and loading content (LC%) of Cy-3-antago3 and Cur were detected by quantifying the fluorescence intensity of Cur and Cy-3 in the supernatant after preparation of CANPs.
Agarose gel electrophoresis
We used the gel retardation assay to evaluate the Dnase I stability of naked antago3 and antago3 loaded in CANPs. The stability of anago3 in CANPs was measured using the sodium dodecyl sulfonate (SDS) displacement assay. Both naked antago3 and CANPs solutions were incubated with 0.5 U Dnase I at 37 °C for different time points. At predetermined time point, 10 µl of the mixtures were taken out. 5 µl of 2% SDS and 5 µl of 10% glycerine were added to the above mixed solutions. Then, the samples were loaded onto 2% agarose gel in tris-acetate-ethylenediaminetetraacetic acid (EDTA) buffer containing 0.5 μg/ml of GelRED TM (Biotium, USA). Electrophoresis was performed at 110 V for 10 min and the gel was visualized by with the Bio-Rad imaging system.
In vitro Cur release profiles
The in vitro release profile for Cur from FCANPs was investigated in different pH sink conditions using the dialysis diffusion method. A 2 ml dispersion of CANPs was added to a dialysis bag (Cutoff 3000 Da) and then dialyzed against 30 ml of different PBS solutions (pH 7.4 and 5.5) containing 1% Tween-80 under constant horizontal shaking (100 rpm). At different time intervals, 1ml of the solution was collected and equal volume of PBS was complemented again. The amount of released Cur was evaluated by high-performance liquid chromatography (HPLC) method. The release experiments were repeated in triplicate.
Cellular uptake study
Human triple-negative breast cancer cells (MDA-MB-231) were cultured in DMEM medium replenished with 10% FBS, 1% penicillin and 1% streptomycin at 37 °C in a humidified atmosphere containing 5% CO2. MDA-MB-231 cells were seeded in the glass-bottom dish at the density of 1 × 10⁵ cells per dish and incubated overnight. Then, FBNPs and FCANPs were added into the dishes and incubated for 4 h. For HA block studies, the cells were pre-incubated with medium containing 10 mg/ml of HA for 1 h. Then, the medium was replaced by fresh medium containing FBNPs or FCANPs and incubated for another 4 h. Finally, the cells were washed three times with PBS and then observed using confocal microscopy (CLSM, CarlZeiss, Boston, MA). In the experiment of FBNPs-treated cells, the nuclei were stained with DAPI for 15 min. The intracellular localization of Cur was observed by excitation wavelength at 488 nm laser and the emission wavelength was 530 nm. The excitation and emission wavelength of Cy-3 were 550 nm and 570 nm, respectively. The Cy-5.5 fluorescence was detected under 675 nm laser excitation and the emission was collected under 694 nm.
In vitro cytotoxicity analysis
The cytotoxicity of BNPs in MDA-MB-231 cancer cells and human umbilical vein endothelial cells (HUVEC) were tested by the CCK-8 assays. Briefly, the cells were seeded in 96-well plates with a density of 5 × 10³ cells per well for 24 h. Then, the medium was replaced with fresh medium containing different concentrations of BNPs (0, 10, 20, 50, 100, 200, 400 and 800 µg/ml) and incubated for additional 24 h. Subsequently, the cells were incubated with free serum-free medium with 10% CCK-8 kit for 30 min at 37 °C. Finally, the absorbance was detected by microplate reader (Bio-Rad 550, USA) under 450 nm.
Cell viability and apoptosis analysis
MDA-MB-231 were seeded in a 96-well plate at a density of 5 × 10³ per well in DMEM containing 10% FBS in a humidified atmosphere of 5% CO2. After being incubated for 24 h at 37 °C, the cells were treated with different formulations (saline, free Cur, CNPs, ANPs and FCANPs). After 24 h incubation, the cell viabilities were measured by CCK-8 assay as described above. The IC 50 was determined by nonlinear regression analysis using the equation for a sigmoid plot. To detect cell apoptosis, MDA-MB-231 cells were collected at 24 h after different formulations treatment and apoptosis assay was measured by using an Alexa Fluor 488 annexin V/Dead Cell Apoptosis Kit (Invitrogen) with a FACSCalibur FCM (BD).
Scratch wound healing and transwell migration assays
For the scratch wound healing assay, MDA-MB-231 cells (1× 10⁴) were seeded on 24-well plates for 24 h. A single straight scratch was made in the monolayer with a 100 µl of pipet tip. After washing the detached cells with PBS, the cells were treated with different formulations and monitored for up to 48 h (Cur dose: 2 μg/ml; antago3 dose: 100 nM). The distance of migration from the monolayer to the wounded area during this time period was measured. Cell migration was measured using cell transwell assay with a pore size of 8 µm. After different formulations treatments for 24 h, the MDA-MB-231 cells were plated on transwell inserts (VWR, Radnor, PA) coated with 0.28 mg/mL CorningTM MatrigelTM Membrane Matrix (Corning, NY). 10% of formalin was used to fix the migrated cells for 10 min. After washing with PBS three times, the migrated cells were stained with 0.05% crystal violet. The inserts were washed under running water to remove excess stain and set to dry overnight. Then, the invaded cells were viewed by the microscope. The migration ratios were counted using the ImageJ software.
Quantitative real-time PCR and western-blot analysis
The quantitative real-time PCR (qRT-PCR) experiments were carried out to detect the expression level of lncRNA ASBEL and mRNA expression levels of BTG3, c-Met and Bcl-2 as previously described [25]. All RNAs were normalized to the expression level of GAPDH. Western-blot assay was also used to detect the protein expressions of BTG3, c-Met and Bcl-2. Total proteins including cells and tumor tissues were extracted as previously described [25]. Protein extracts were separated by SDS-PAGE, transferred onto PVDF membranes and immunoblotted with primary antibodies overnight. After three washes, the membranes were incubated with secondary antibodies at room temperature. After being washed with TBST, the protein signals were detected using the ChemiDocTM XRS+ Imaging System (BioRad), which was supplemented with 200 µl chemiluminescence ECL kit (Beyotime Biotechnology, Beijing, China) and visualized using.
Animal model
All animal studies were performed in accordance with the Guidelines for Care and Use of Laboratory Animals of National Center for Nanoscience and Technology and approved by the Institutional Animal Care and Use Committee (IACUC) in compliance with Chinese law for experimental animals. Female BALB/c-nude mice (Beijing Weitong Lihua Experimental Animal Technical Co., Ltd.) were housed in an environmentally controlled animal facility with a regular 12/12 light/dark cycle.
In vivo imaging, biodistribution and pharmacokinetics studies
For in vivo fluorescence imaging, the back MDA-MB-231 tumor-bearing mice were administrated with saline and FCANPs through intravenous injection, respectively. Imaging was performed at predetermined time points (1 h, 3 h, 6 h, 12 h, 24 h and 48 h), the mice were anesthetized and scanned by the multispectral fluorescence imaging system (Cri-M2, CRI USA). After imaging, mice were sacrificed for the harvest of major organs (liver, lung, spleen, kidneys, and heart) for analyzing the ex vivo fluorescence distribution. The tumors were also frozen and cut into 10 µm thickness using a Leica cryostat, and imaged by fluorescence microscope.
For pharmacokinetics study, back MDA-MB-231 tumor-bearing mice were intravenously injected with FCANPs (10 mg/kg of Cur) and blood was collected at predetermined intervals. The blood was centrifuged at 10000 rpm for 10 min to obtain plasma. 2 mL of methyl alcohol was added to 100 μl of plasma and vortexed for 3 min to extract Cur. The resulting solution was then centrifuged for 10 min, the supernatant was injected for HLPC analysis and the Cur concentration was measured. At 48 h post-injection, the intensity of the ex vivo fluorescence signal of the tumor site was semi-quantified with the multispectral fluorescence imaging system and the Cur concentration in the tumor tissue was also measured as described above.
Hydrophobic IR780 was loaded as IANPs and PA imaging was used to determine the biodistribution of IANPs. The tumor-bearing mice were intravenously injected with 100 μL of solution containing IANPs and free IR780. In vivo PA imaging at different time points after systemic injection was obtained with the multispectral optoacoustic tomography scanner (MSOT, iThera Medical).
In vivo antitumor efficacy in different MDA-MB-231 tumor-bearing models
To establish back MDA-MB-231 tumor-bearing nude mice models, a total of 5 × 10⁶ MDA-MB-231 cells suspended in PBS were subcutaneously injected into the right flank back of the mice. When the volume of subcutaneous tumors reached around 100 mm3, the mice were separated into five groups at random for various treatments (n=5 per group). The mice were intravenously injected with saline, free Cur (Cur dose: 10 mg/kg), CNPs (Cur dose: 10 mg/kg), ANPs (antago3 dose: 1mg/kg) and CANPs (Cur dose: 10 mg/kg; antago3 dose: 1mg/kg) every other day for a total of five doses. Mice were weighed and the tumor dimensions were recorded once every three days during the treatment period. The volumes of tumor were calculated according to the following equation: (length × width2)/2. These mice were sacrificed at 24 days post-injection, the tumors and major organs (liver, heart, lung, spleen, and kidney) were excised for hematoxylin-eosin (H&E) staining and terminal deoxynucleotidyl transferase dUTP nick end labeling (TUNEL) staining. The morphology of each section was observed by a fluorescence microscope (Olympus, Japan). For analysis of lncRNA ASBEL and BTG3 level in tumors, qRT-PCR measurements were performed. For analysis of mice survival rates, tumor-bearing mice were subjected to the corresponding treatment as above and the dates of mortality were recorded.
To establish the orthotopic TNBC mice model, a total of 5 × 10⁶ MDA-MB-231 cells mixed with an equal volume of Matrigel were subcutaneously injected into the right side of the fourth fat pad of nude mice. When the volume of subcutaneous tumors reached around 100 mm3, the mice were separated into five groups (n=5 per group) and treated with different formulations as above. The body weights of mice and the volumes of tumor were calculated every three days. For analysis of mice survival rates, tumor-bearing mice were subjected to the corresponding treatment as above and the dates of mortality were recorded. To investigate the anti-metastasis abilities, we built pulmonary metastasis model of MDA-MB-231 cancer through intravenous injection of 1× 10⁶ MDA-MB-231 cells suspended in 0.1 ml of PBS. On day 7, the mice were separated into five groups (n=5 per group) and treated with different formulations as above. After treatments, tumor metastases in lungs were observed by H&E analysis.
Biochemistry index and histology analysis
Mice were sacrificed under anesthesia at the end of therapeutic period. Major organs (heart, liver, spleen, lung, and kidney) were collected and then fixed in paraformaldehyde, and embedded in paraffin and stained with H&E. The images of the tissues were observed by the fluorescence microscope. After that, mice blood samples were collected and the blood biochemistry analysis was measured by auto hematology analyzer.
Statistical analysis
All the values were expressed as mean ± SD (stand deviation). A One-way ANOVA test was used to determine significance among different groups. *p < 0.05, **p<0.01, ***p<0.001 were considered statistically significant.