DFU Datasets
DFUC2020
The goal of the Diabetic Foot Ulcer Competition 2020 (DFUC 2020) dataset was to improve the accuracy of DFU detection in real-world settings21. The dataset consisted of foot images with DFUs collected from Lancashire Teaching Hospitals. The images were captured using three digital cameras (Kodak DX4530, Nikon D3300 and Nikon COOLPIX P100), and close-ups of the foot were taken without zoom or macro functions. The dataset comprised of 4,000 images, with 2,000 used for training and 2000 for testing. The images were acquired during regular patient appointments, resulting in variability in factors such as distance, angle, lighting, and the presence of background objects. The dataset included cases with multiple DFUs, different stages of healing, partial foot visibility, and foot deformities. The dataset also featured cases with time stamps, rulers, and partial blurring or obfuscation of wounds. The images were annotated by healthcare professionals, indicating the ulcer location using bounding boxes.
DFUC 2021
The goal of the Diabetic Foot Ulcer Competition 2021 (DFUC 2021) dataset is to has been aimed to improve the accuracy of DFU classification in real-world settings enhance the DFU classification accuracy in clinical environment22. The images in the dataset were captured from patients during their clinical visits at Lancashire Teaching Hospitals using three different camera models. Close-up photographs of the full foot were taken at a distance of 30–40 cm, ensuring a parallel orientation to the ulcer plane and using adequate room lighting for consistent colors. The dataset includes annotations by a podiatrist and a consultant physician for ulcer location, ischemia, and infection status. Data curation involved cropping DFU regions and applying natural data augmentation. The DFUC2021 dataset contained a total of 15,683 images.
Wound image preprocessing
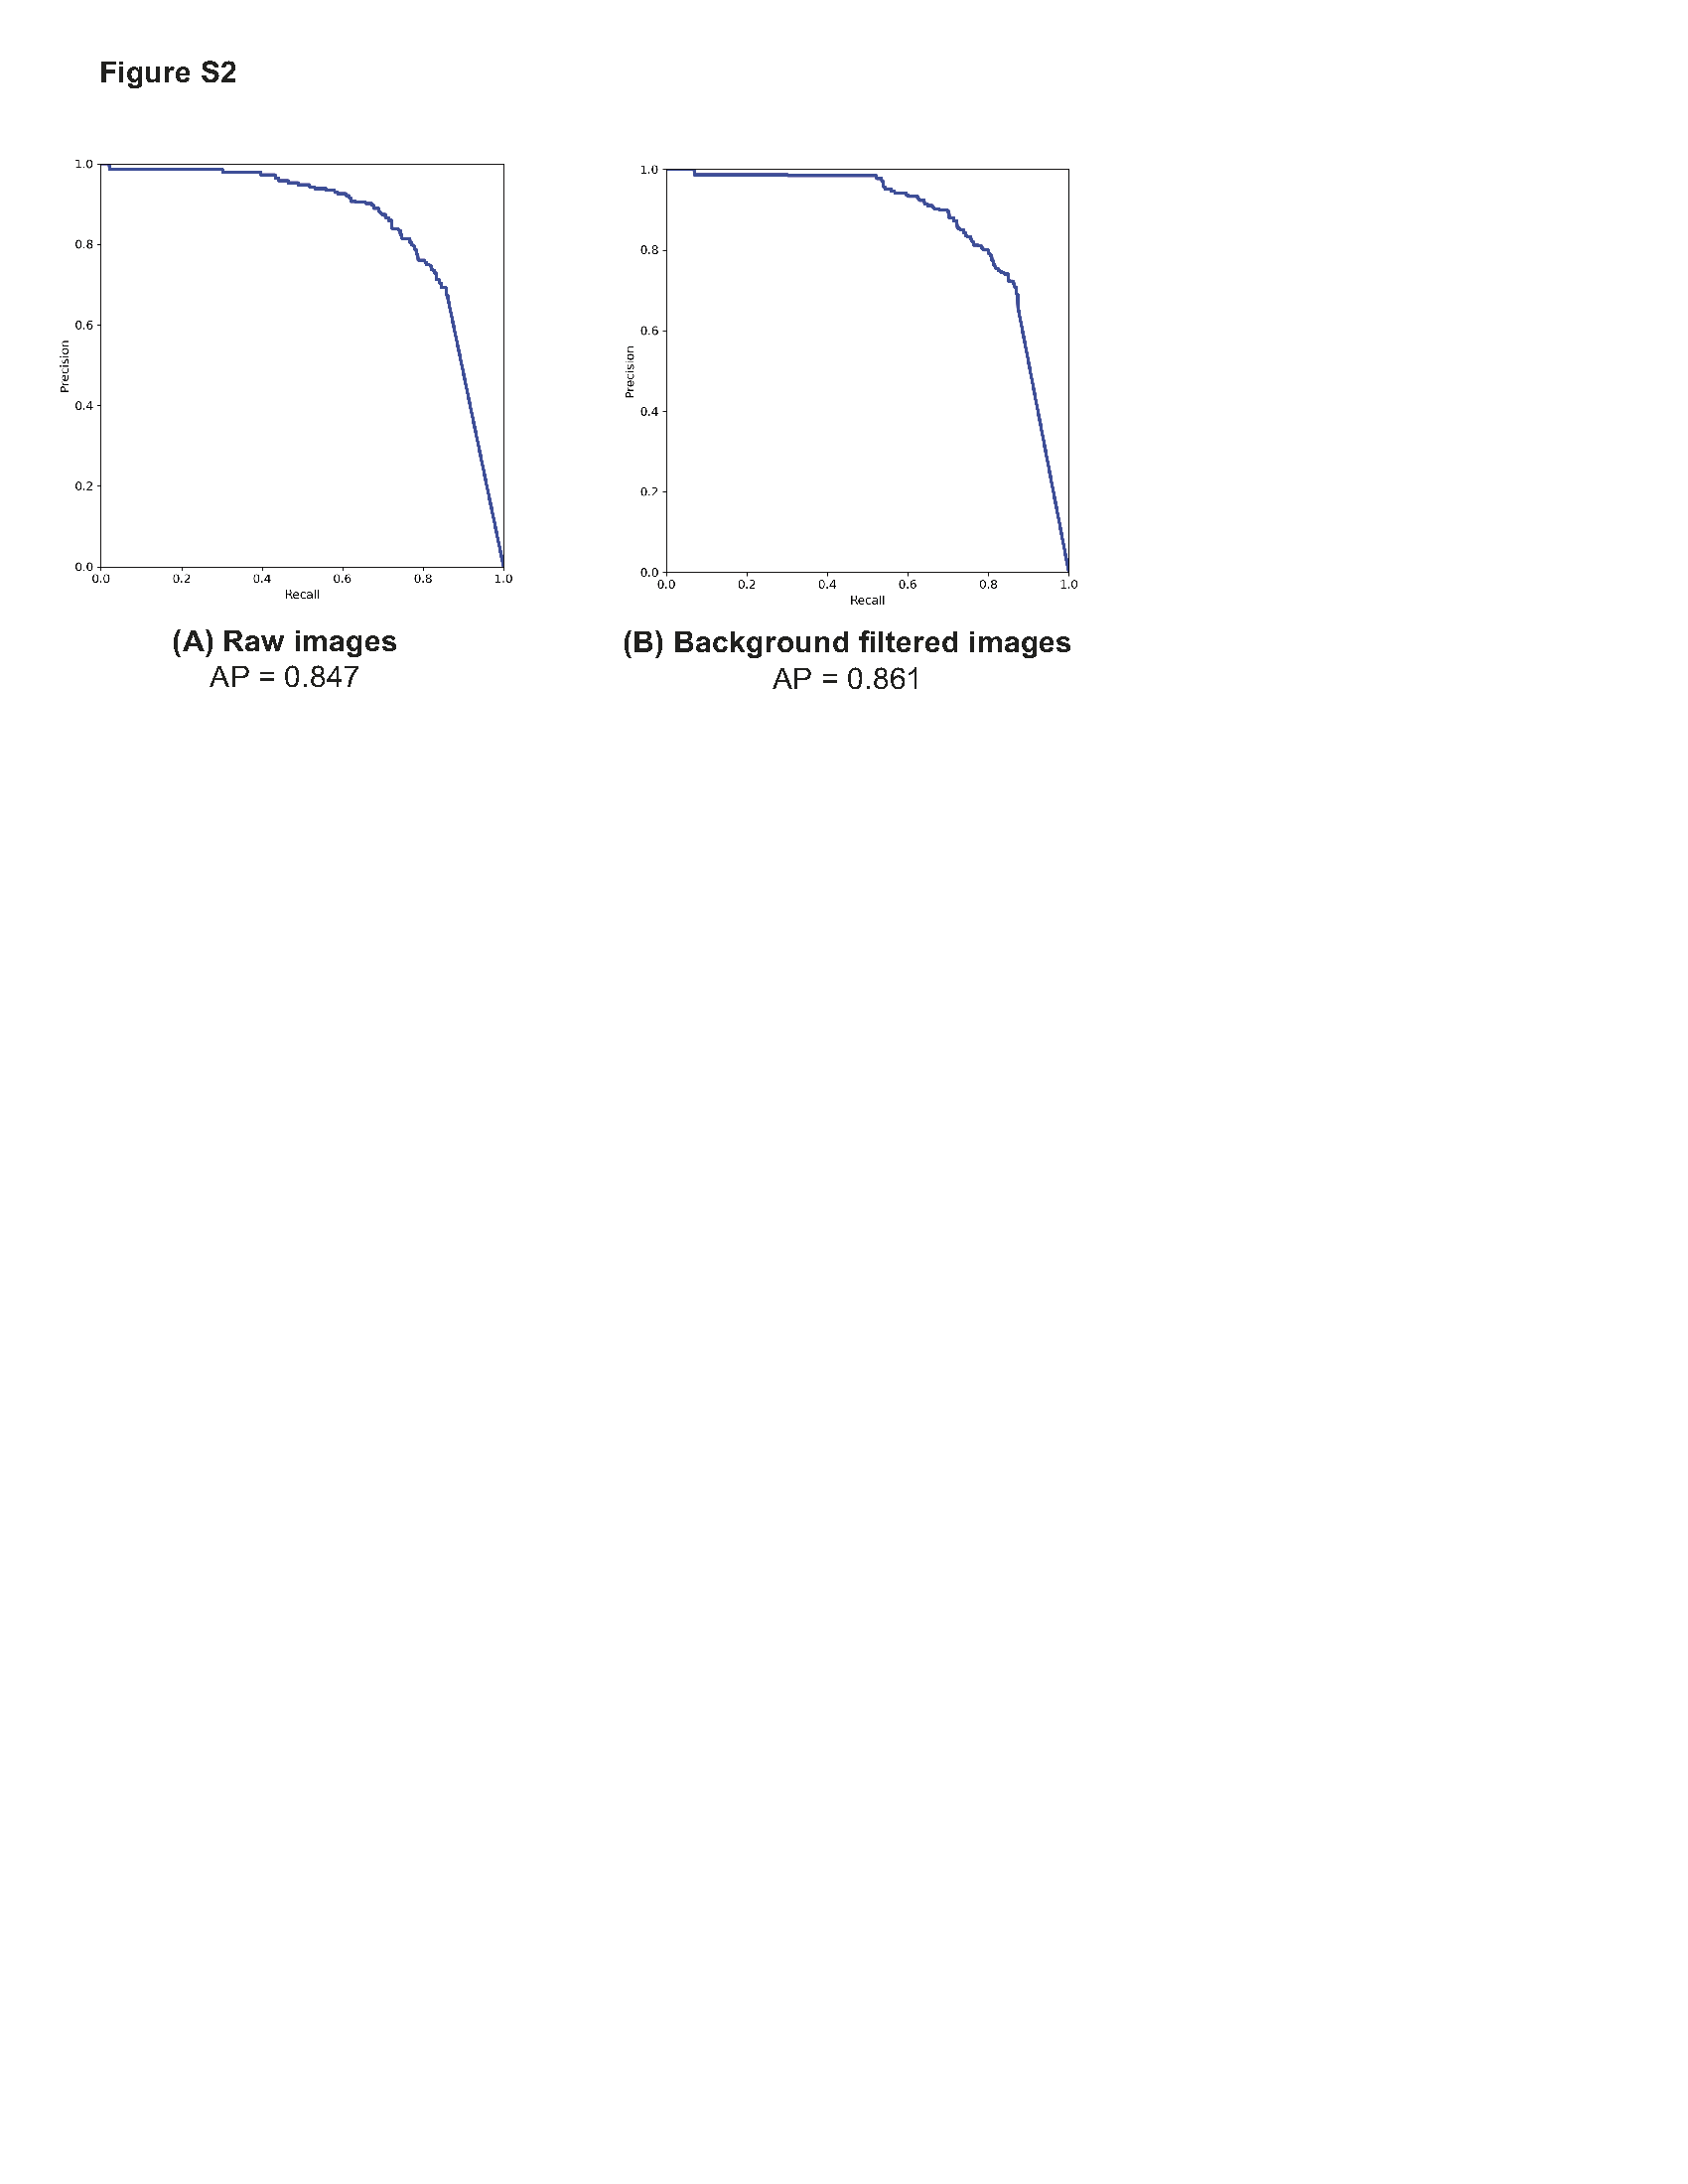
To optimize the performance of wound detection model, a comprehensive image preprocessing pipeline with the primary objective of removing background regions, in the wound images was applied (Fig. 3A). Before background removal, min-max image normalization was applied to ensure the comparability of wound images across different samples. This technique rescaled the pixel intensities of each image to a specific range, between 0 and 1. By normalizing the pixel intensities through subtracting the minimum value and dividing by the range of pixel values, consistent intensity levels across all samples were achieved, accounting for variations in camera resolution and lighting conditions.
To accurately distinguish between the skin and background regions in the wound images, we implemented a colorspace thresholding approach. Extensive research has demonstrated the effectiveness of the Cr channel in the YCRCB colorspace, as well as the a* channel in the CIELAB colorspace, for precise skin-to-background segmentation23. Leveraging this knowledge, we generated a binary mask by applying Otsu's thresholding technique to the Cr channel in the CIELAB colorspace and the CR channel in the YCbCr colorspace. This binary mask was applied on the original wound image to separate the foreground from the backround skin. In addition, median filtering was incorporated to refine the binary mask obtained from the thresholding process and minimize background region inconsistencies (Fig. 3B). This technique replaced each pixel with the median value of its neighboring pixels, resulting in the removal of isolated background region pixels while preserving the overall structure of the mask. By incorporating this multi-step approach, our platform achieved a significant reduction in background region in the wound images.
Wound detection and localization
DL-based object localization models, such as the YOLO series, have consistently demonstrated exceptional speed and accuracy in detecting objects. In particular, YOLOv5 exhibits improved learning capabilities compared to its predecessors and utilizes the BottleneckSCP technique to extract hierarchical features with reduced computational complexity 24.
For our study, we employed the YOLOv5s model, pretrained on the COCO dataset, and fine-tuned it on the DFUC 2020 dataset to enhance model convergence. The DFUC 2020 dataset was divided into a training set (n = 1800) and a test set (n = 200), and a 10-fold cross-validation technique was applied, training each fold for 30 epochs.
To address the limited number of wound images in the dataset, we employed data augmentation techniques. These included adjusting the hue, saturation, and value (HSV) of the images, as well as utilizing translation, scaling, flipping, and mosaic techniques. This augmented dataset improved model performance and generalization.
Additionally, the YOLOv5s model employs a stochastic gradient descent (SGD) optimizer with an initial learning rate of 0.0125. The chosen learning rate ensures a balance between convergence speed and accuracy, allowing the model to effectively optimize its performance in detecting wounds.
To improve the localization accuracy of the model and reduce generalization error, the weights were tuned to achieve the highest mAP and Intersection over Union (IoU) scores within the range of 0.5 to 0.95. A 10-fold cross-validation process was performed and the weights that achieved the best mAP and IoU scores were aggregated. This ensures that the selected weights yield improved localization performance on the DFUs even for unseen wound images beyond the training set.
Automated classification of infection and ischemia in wound images
To classify the detected wound images into four categories: i) infection, ii) ischemia, iii) both infection and ischemia, and iv) neither infection nor ischemia, both a classical machine learning pipeline trained on hand-crafted image features and a DL pipeline were developed. The inclusion of the classical machine learning approach facilitates the extraction of interpretable wound features, ensuring transparency and practicality in medical application. The DL-based approach automatically learns complex patterns and hierarchical representations from wound images, capturing subtle features and nuances not easily discernible through traditional hand-crafted feature extraction, increasing the model performance.
Deep learning-based classification of DFU
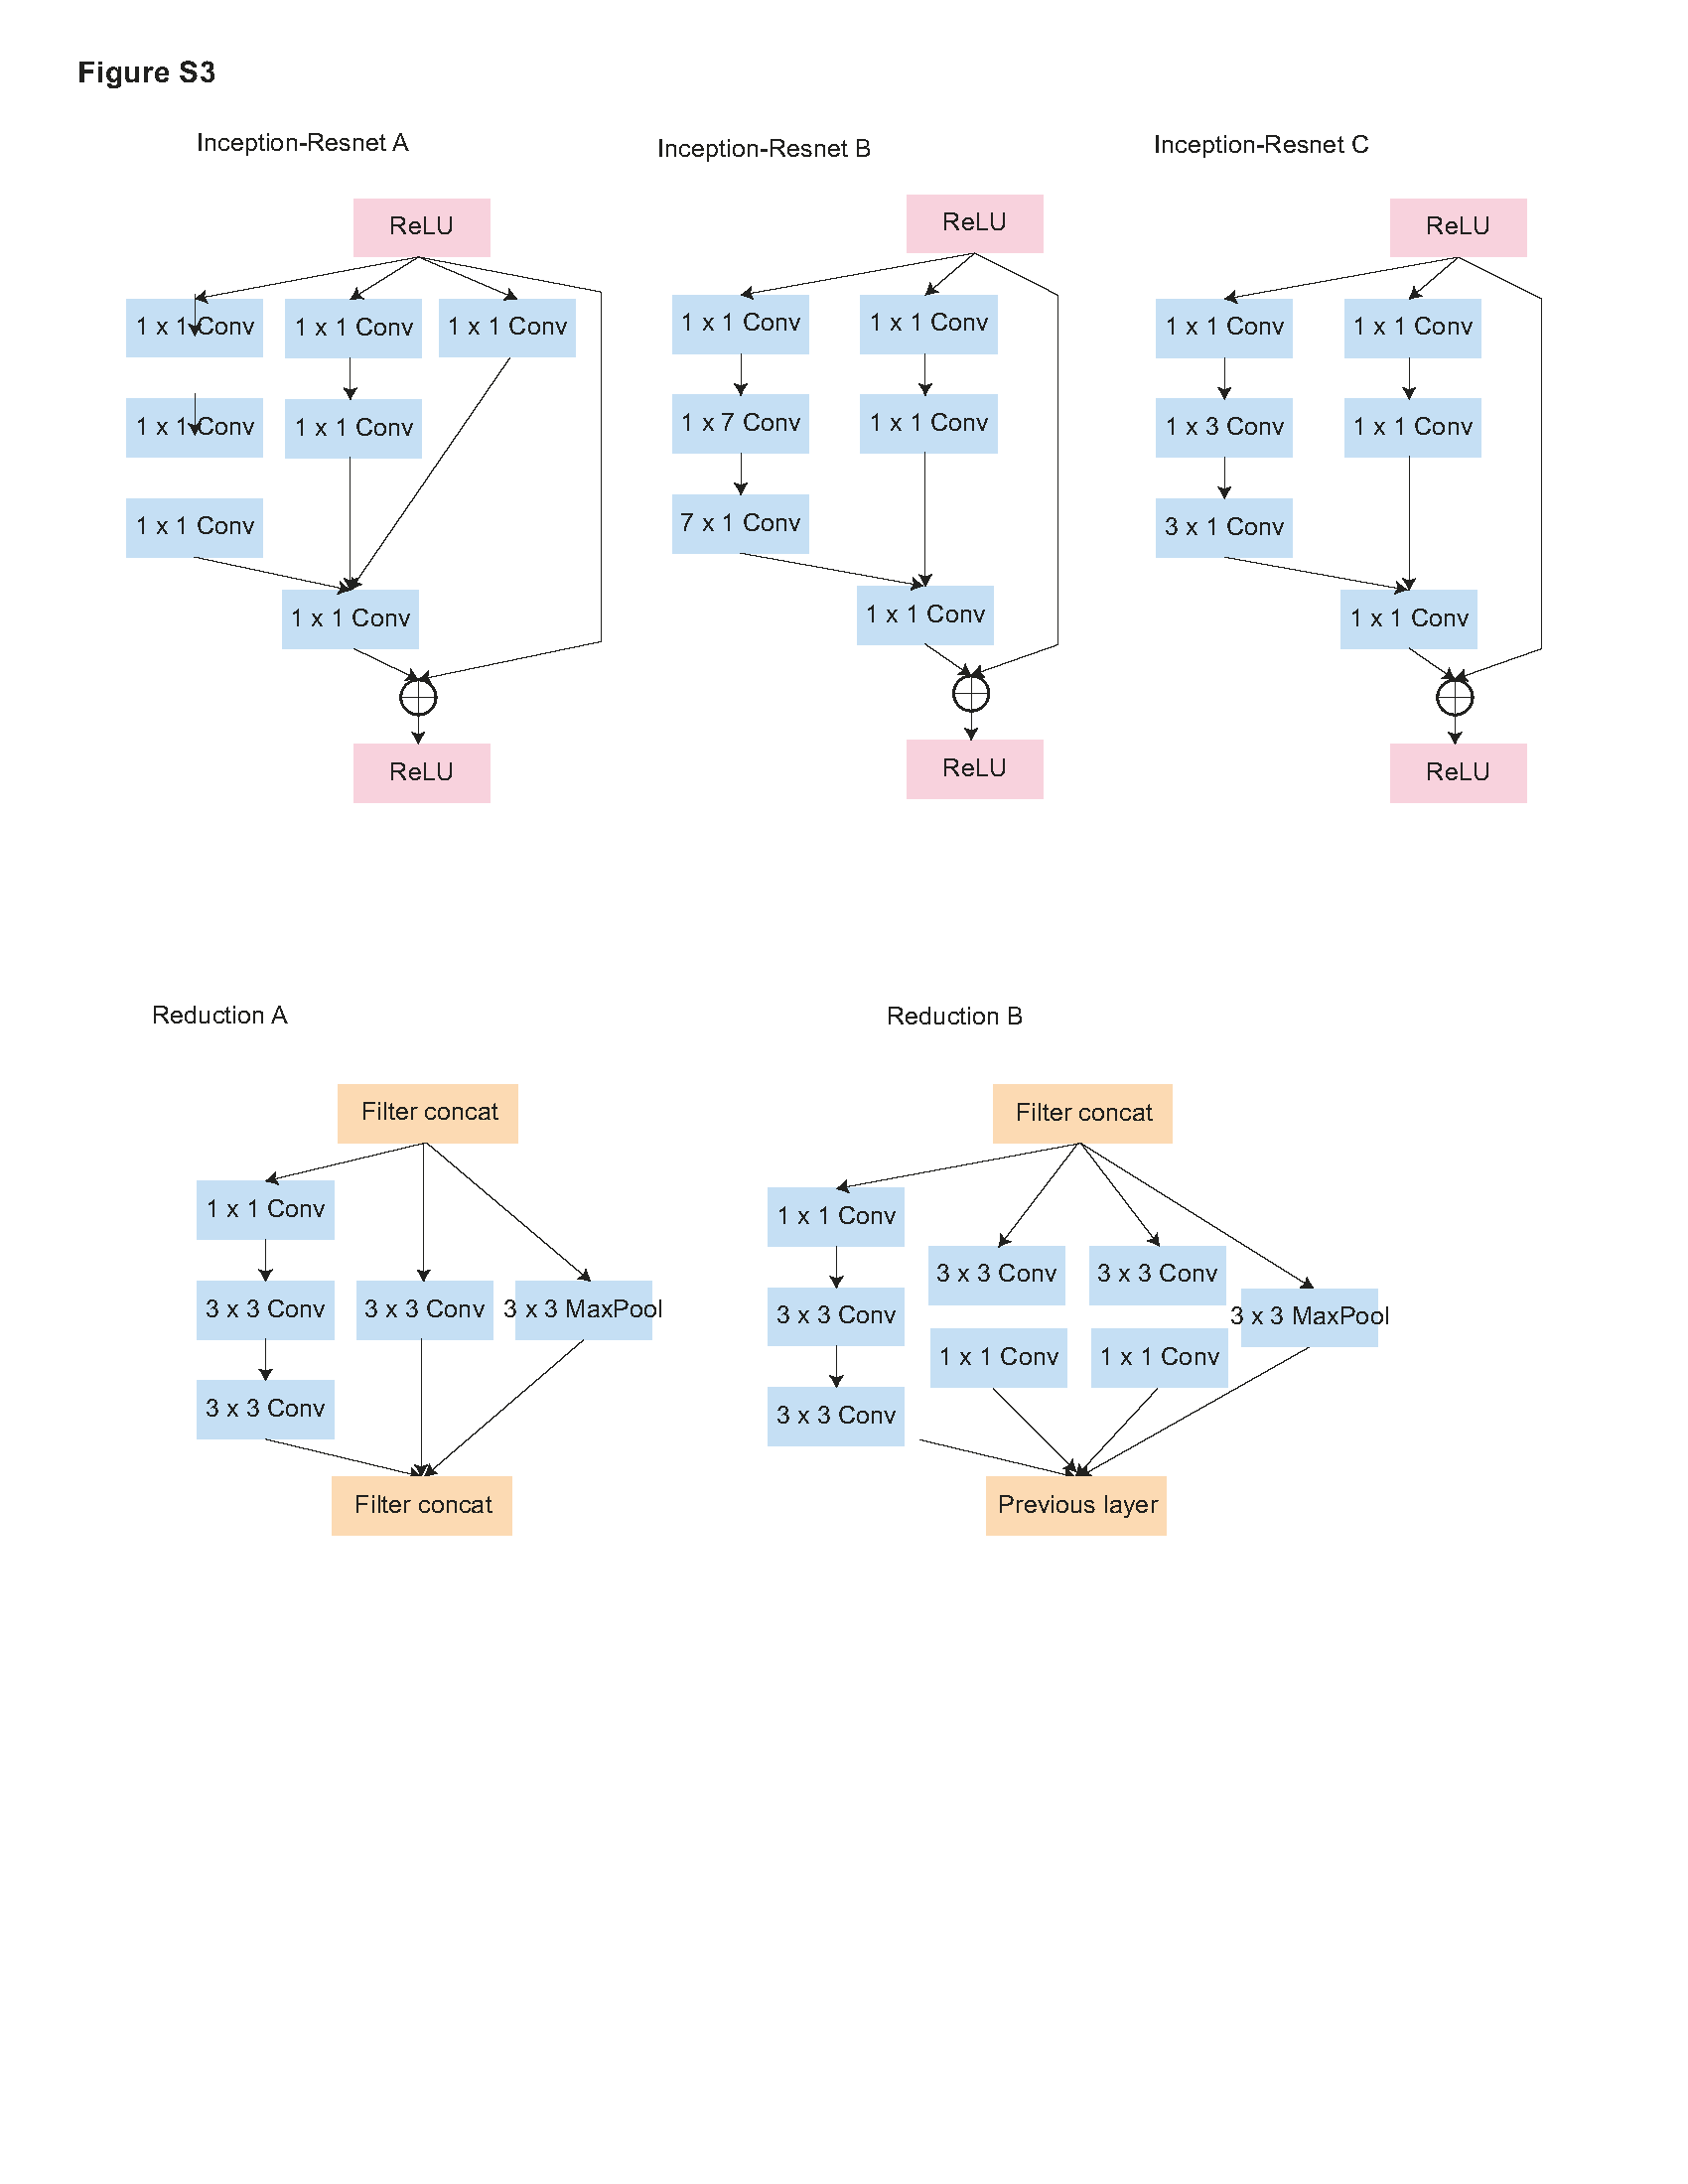
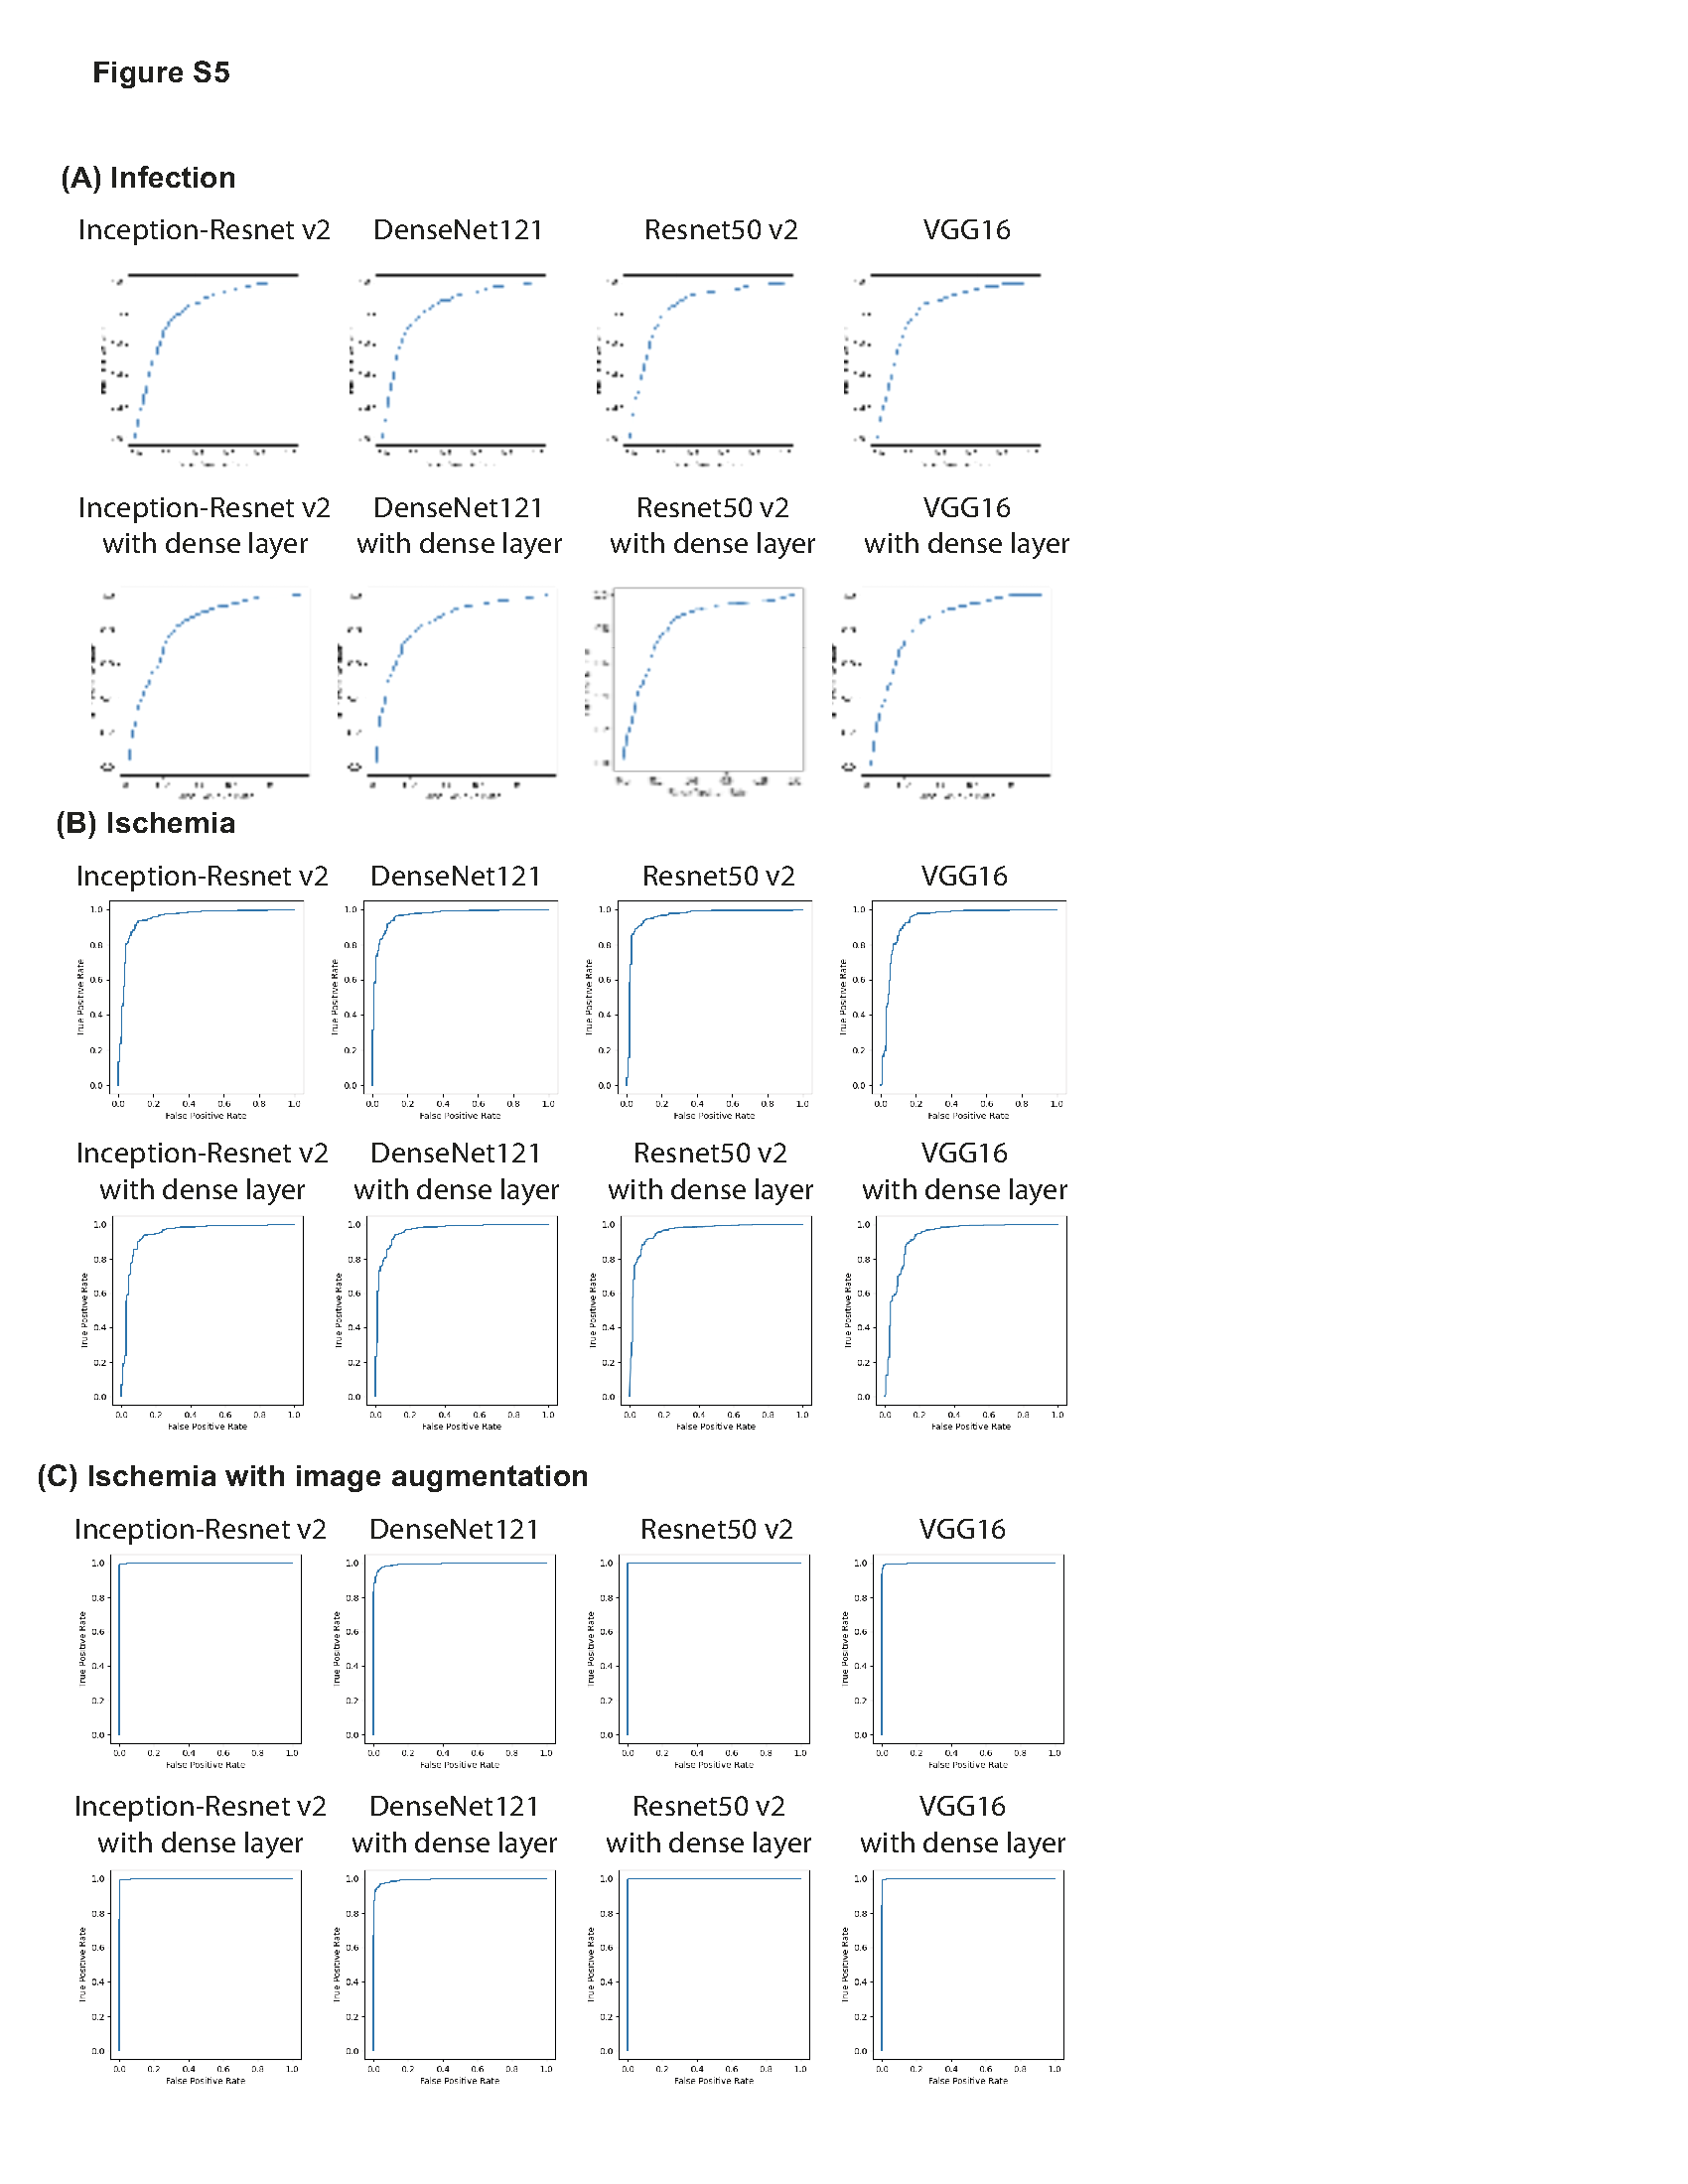
To determine the CNN architecture that achieved the highest DFU classification reliability, we chose four most popular pre-trained ImageNet models (Resnet50v2, VGG16, InceptionResNetV2, and DenseNet121) and trained into three phases of 20 epochs each26–29. For each model architecture, variants were trained with and without the addition of an additional dense layer between the last convolutional layer output, and the output node. Approximately 20% of images from the training dataset were held out for validation (1,156 images). To prevent overfitting and improve the performance of the DL models, image augmentation techniques including random rotations, flips, and shifts in brightness to each image in each epoch. Additionally, binary cross-entropy was used as a loss function to update the weights in each iteration. We evaluated the performance of the algorithms using multiple metrics, including binary accuracy, area under the curve (AUC), precision, and recall. All four models as-is with single output node and the same four models with a trainable dense layer after the last convolutional layer were trained on the binary classification tasks for either the presence of infection or ischemia. An output node following the last convolutional layer with a sigmoid activation function was used to give the binary classification result. Models were trained by three phases of 20 epochs each: 1) All weights for convolution layers were frozen and optimized by Adam with learning rate of 3e-4. 2) 4/5ths of the convolutional layers were frozen and RMSprop with learning rate of 1e-5 was used for optimization. 3) 2/3rds of the layers remained frozen and optimized with decayed learning rate of 1e-6 on binary cross entropy loss in Tensorflow2 (Fig. 4) 30.
Due to imbalances in the number of ischemia images present (179 of the 4,799 images), ischemic models were trained both on the dataset as-is, and with ischemia-only and ischemic and infected images upsampled by a factor of six with random augmentations. This duplication brings the number of positive ischemic cases (662) in line with the number of negative ischemic cases (4,137). No modifications were made to the validation dataset.
The binary classification results were converted to a four-way classification result through the following formulas:
$$P\left(none\right)=\left(1-P\left(Inf\right)\right)*\left(1-P\left(Isch\right)\right)$$
1)
$$P\left(In{f}_{Only}\right)=P\left(Inf\right)*\left(1-P\left(Isch\right)\right)$$
2)
$$P\left(Isc{h}_{Only}\right)=\left(1-P\left(Inf\right)\right)*P\left(Isch\right)$$
3)
$$P\left(Both\right)=P\left(Inf\right)*P\left(Isch\right)$$
4)
Where \(P\left(Inf\right)\) is the output of the binary infection model, and \(P\left(Isch\right)\) is the prediction of the binary ischemia model. Four classification accuracy, F1-Score, and AUC were assessed on the training, validation, and test dataset by combining each network architecture’s best infection or ischemia models.
Handcrafted features extraction and classical machine learning-based DFU classification
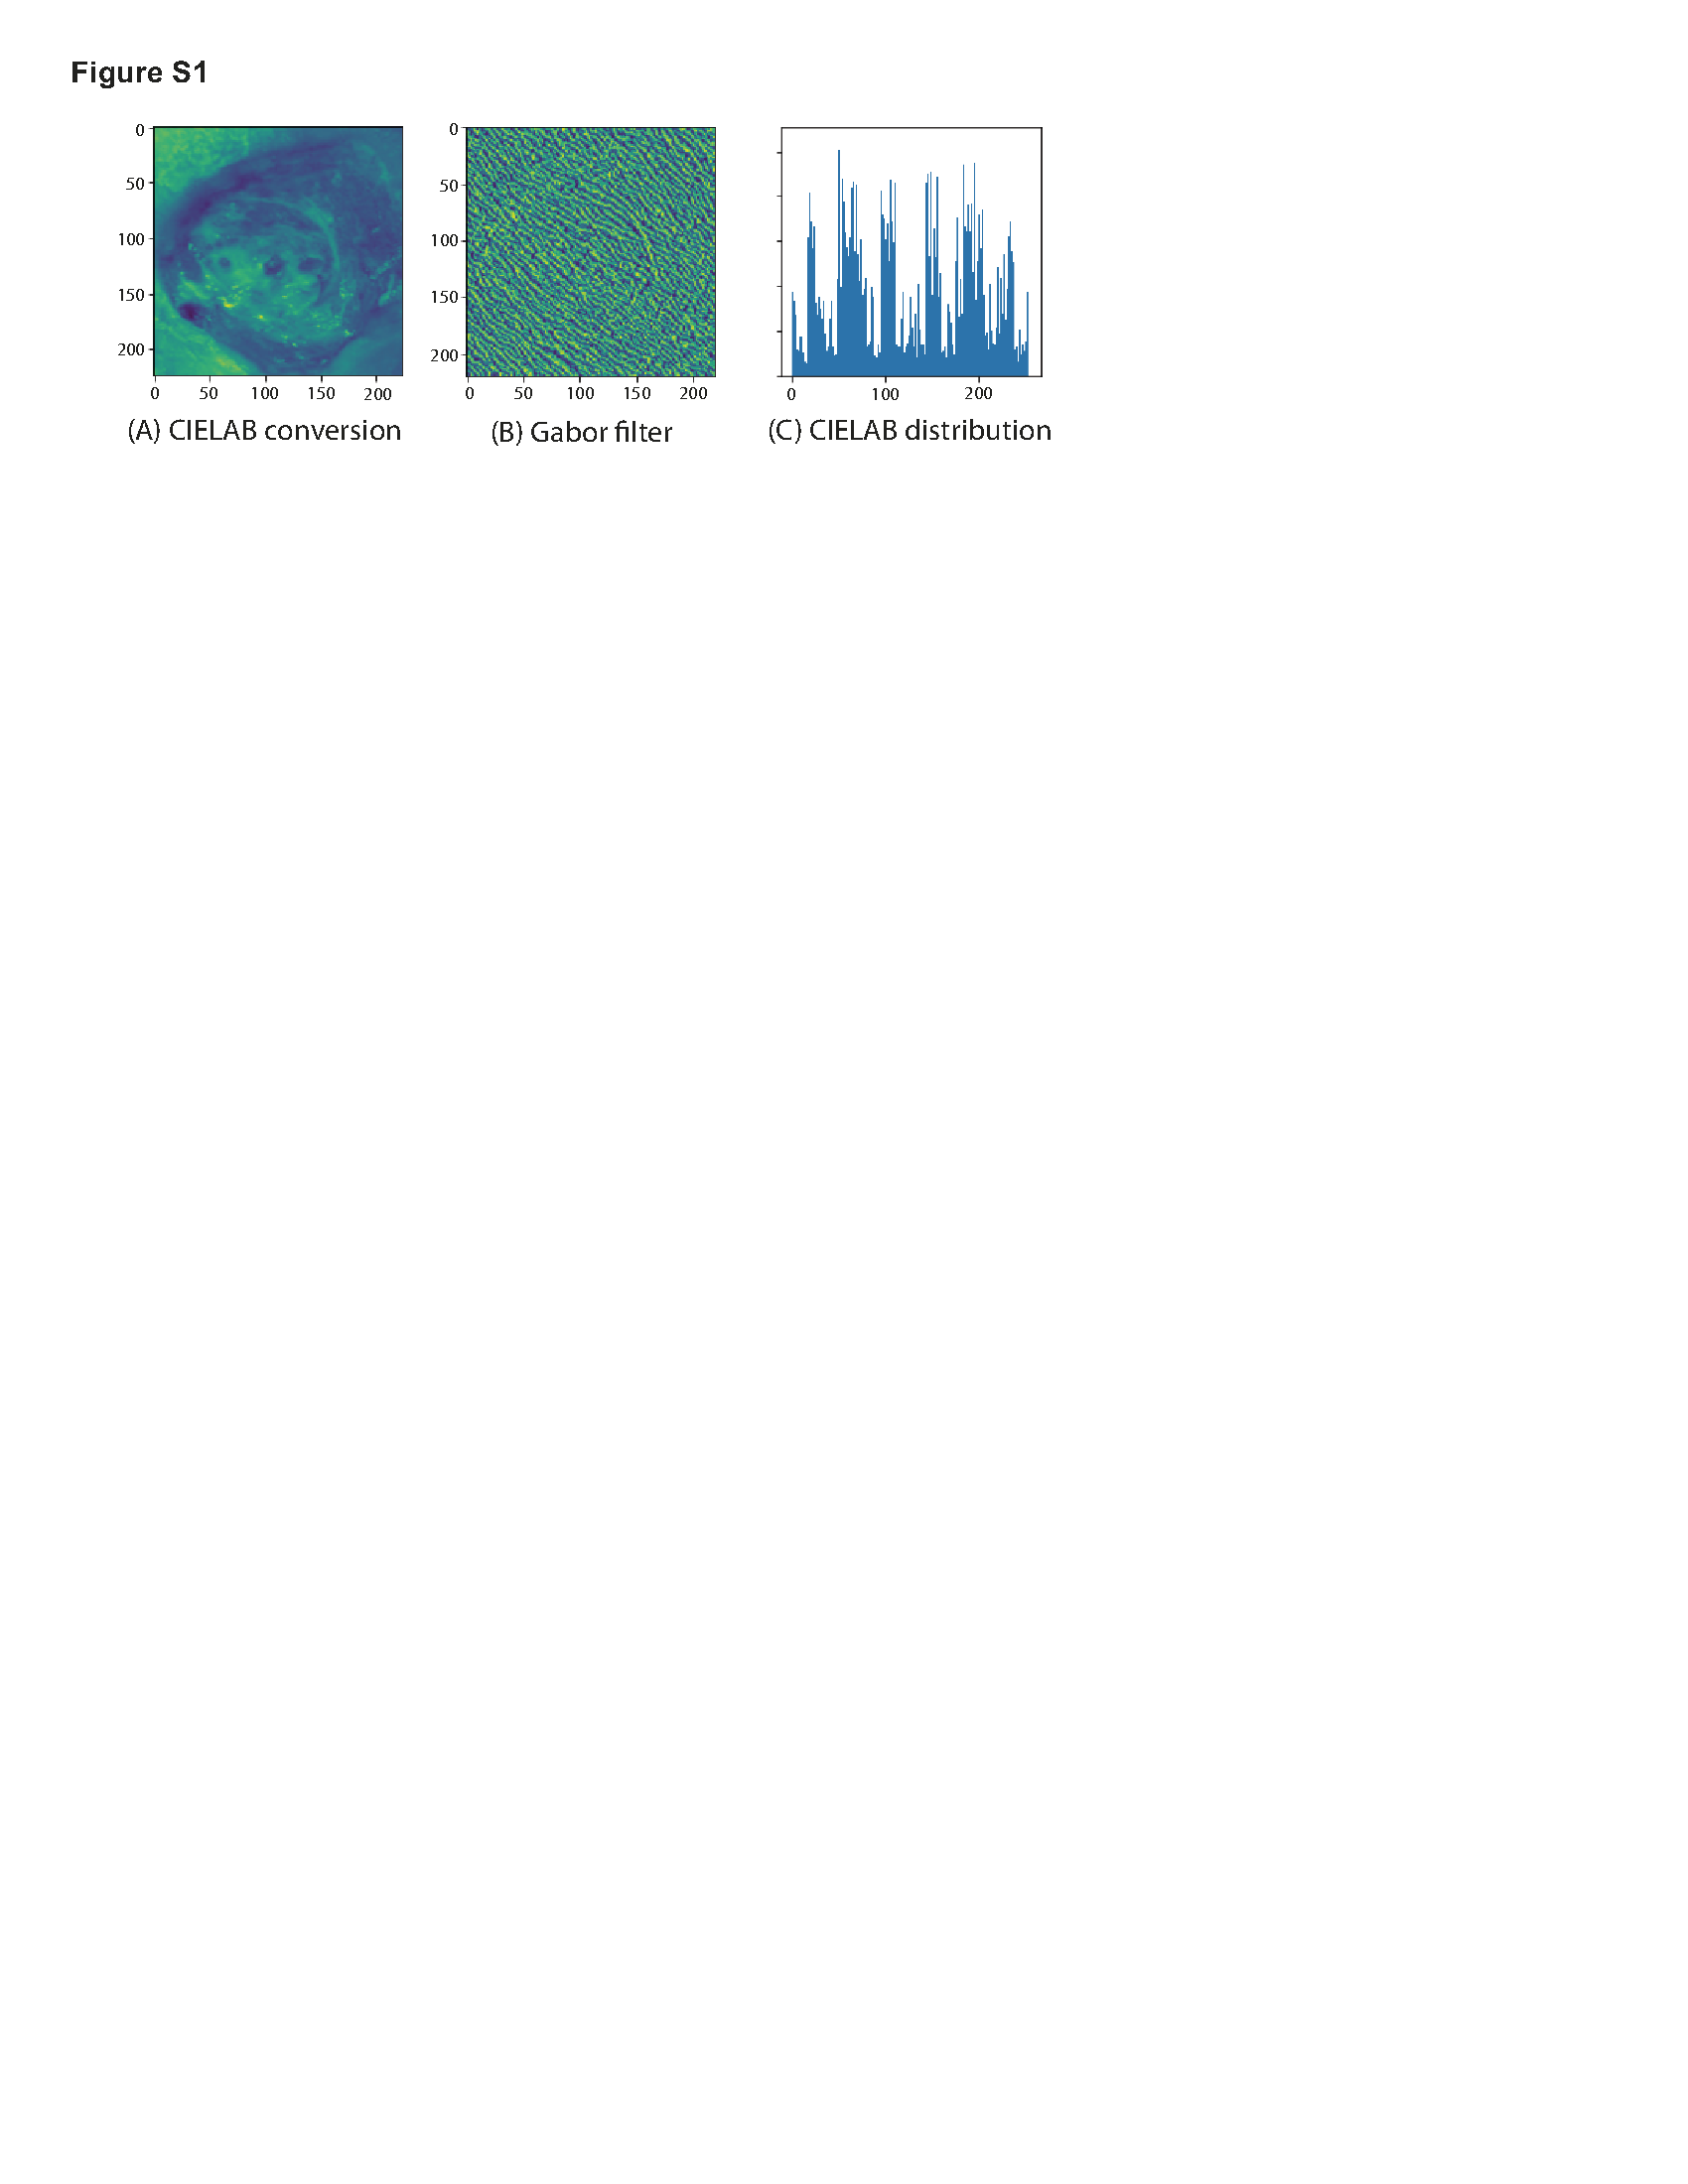
The classical machine learning algorithm for wound classification was a comprehensive approach that incorporates six visual analysis methods to extract features from wound images31. The algorithm computed the distribution of CIELAB color space channels, the Gray Level Co-occurrence Matrix (GLCM) for the full image, distribution of GLCM metrics for 64x64 pixel patches across an image, Local Binary Patterns (LBP), Local Phase Quantification (LPQ), and Gabor filter to extract a mixture of color and textural features (Figure S4). These handcrafted features are used to train classical models including a non-linear SVM model using a Radial Basis Function (RBF) kernel, Gradboost (100 tress with depth of 3 either on raw features or after applying Principal Component Analysis (PCA)), XGBoost (100 tress with depth of 3, raw features or after PCA), and multilayer perceptron (MLP) with three layers to classify infected vs non-infected or ischemic vs non-ischemic DFUs32–34. The algorithm was trained on a dataset of 4799 images using 5-fold cross-validation to select the optimal number of PC to use, and additionally tested on the held-out validation set (1,156 images). Two binary classifiers identifying infection and ischemia respectively and multi-classifier with four categories were developed and evaluated using F1-score, precision, recall, and accuracy.
Wound characterization and analysis
Wound size measurement
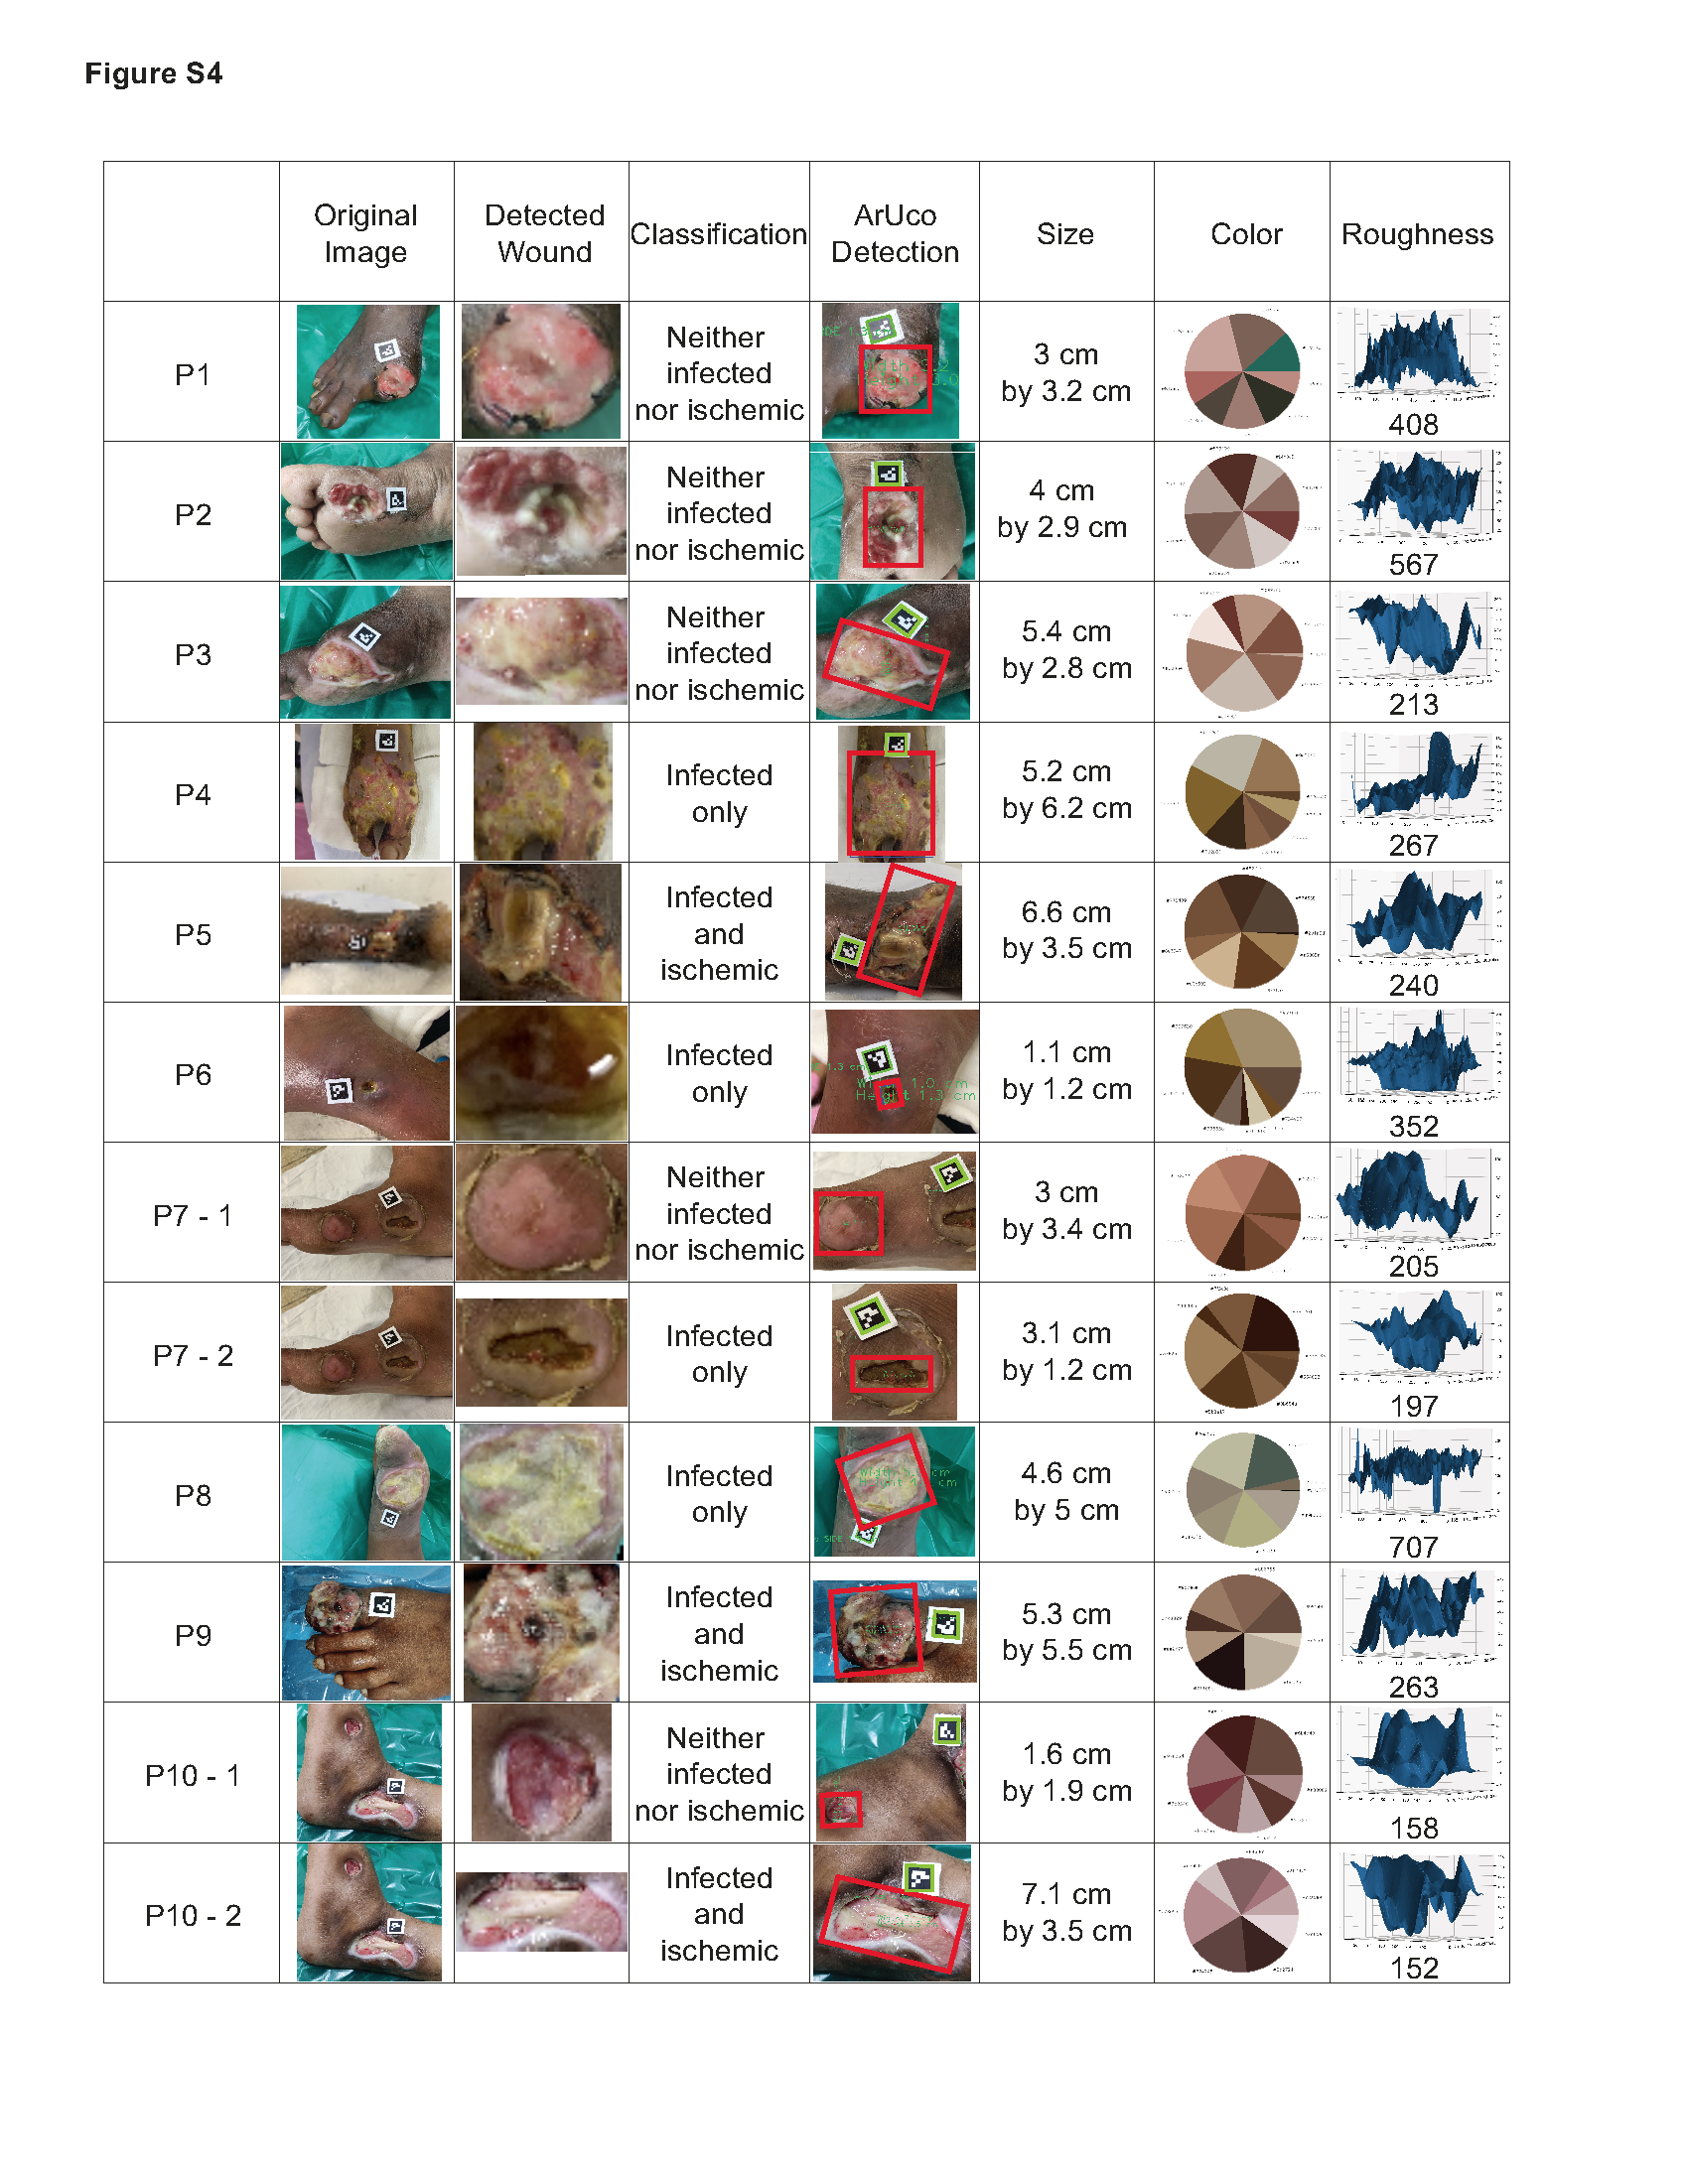
To determine the surface area of the wound with a camera, DFUCare utilized a 1.3 cm by 1.3 cm ArUco marker placed near the wound along with the Open-cv library to calculate a "pixel to metric" ratio based on the predefined size of the marker. This allows for the conversion of pixel size to a numerical measurement in centimeters (Fig. 5). This provided the width and height of the wound region using the size of the bounding box from the wound localization.
Color analysis of the wounds
The coloration of DFUs is a significant factor in their classification and assessment. Studies have demonstrated that ulcers with a red or yellow hue are more likely to be infected, while those displaying a pale or darker tones are more likely to be caused by ischemia31,35,36. DFUCare employed unsupervised K-means clustering to analyze and determine the relative percentage of the seven major colors present in the localized DFU images, providing valuable insights to clinician for tissue analysis (Fig. 5). This is achieved by Scikit-learn library. The DFUCare color analysis tool enables physicians to conduct a proper analysis of the coloration of diabetic foot ulcers by determining the relative percentages of each color present in the wound.
Texture analysis of the wounds
The progression of wound healing can be observed through changes in the wound surface's texture. A smooth surface is indicative of proper healing as new tissue forms and the wound contracts. Conversely, the presence of roughness may suggest the potential for infection or a delay in tissue regeneration. Furthermore, the accumulation of necrotic tissue, also known as eschar, can contribute to roughness and impede healing. To obtain the roughness values, a two-dimensional grayscale image of the wound surface is transformed into a three-dimensional representation with a height map projection using the Numpy and Scipy libraries. After applying a Gaussian filter to minimize image noise, the roughness can be calculated by analyzing the "bumps" or variations of the surface of the three-dimensional projection. This allowed a graphical representation of the roughness as well as a numerical measurement.
Pilot study for determining the performance of DFUCare algorithm
To test the performance of the DFUCare algorithm, we performed a pilot study in collaboration with the PGIMER in Chandigarh, India. Wound images were obtained as part of a routine visit to the foot care lab of the endocrinology clinic at PGIMER. All the image patch and data collection have been performed using methods/procedures in accordance with the relevant guidelines and regulations approved by the “Institute Ethics Committee PGIMER Chandigarh, India”. The infection and ischemia status of wounds were determined by a physician at the foot care lab of PGIMER with the help of standard culture and wound characteristics. The wound images with the ArUco marker placed adjacent to the wound were acquired using an iPhone X camera. In addition to wound images, de-identified patient demographic, infection status, ischemia status, and manual wound size (rounded to the nearest whole number) were also collected.
Ethical compliance
All wound patch images were collected from the Diabetes clinic at the Postgraduate Institute of Medical Education and Research (PGIMER), Chandigarh India according to the procedure approved by the “Institute Ethics Committee, PGIMER, Chandigarh, India”. Informed consent was obtained from study participants at PGIMER.