A lactate self-powered biosensor was assembled for the detection of lactate in sweat based on flexible textile matrix enzymatic electrodes. A porous three-dimensional electrode with high flexibility and electrical conductivity was obtained by decorating composites of reduced graphene oxide and carboxylate multi-walled carbon nanotubes onto a cellulose fabric substrate. The excellent enzyme embedding method using gel electrolyte showed a Michaelis-Menten constant of 1.46 mM, which implies that lactate dehydrogenase had a high enzymatic activity. The assembled self-powered lactate biosensor showed a sensitivity of 3.16 µW mM− 1 cm− 2 in the 0–10 mM linear range and a detection limit of 9.49 µM (S/N = 3). Meanwhile, the biosensor has good tensile flexural stability, selectivity, and long-term stability. The lactate self-powered biosensor recovered 99.66–108.43% of lactate from real sweat with a relative standard deviation of less than 4.65% when integrated into clothing. The biosensor is promising for sensing lactate in real sweat.
Research Article
Wearable cellulose textile matrix self-powered biosensor sensing lactate in human sweat
https://doi.org/10.21203/rs.3.rs-3229604/v1
This work is licensed under a CC BY 4.0 License
Journal Publication
published 20 Nov, 2023
Read the published version in Journal of Applied Electrochemistry →
You are reading this latest preprint version
Textile matrix
Self-powered
Lactate
Biosensor
Sweat
Wearable self-powered biosensors were a new type of electrochemical sensing device [1]. It was different from conventional electrochemical sensors in terms of energy supply[2, 3]. The self-powered biosensor can be directly worn on the body surface and provides energy for the detection process through spontaneous electrochemical reactions while detecting the substrate, thus eliminating the need for any external power source[4, 5]. This contributed to a simplified structure and improved stability, while reducing costs[6]. As a result, Self-powered biosensors had attracted extensive attention in various fields including bio-integrated devices, wearable medical devices, electronic devices, etc. [7, 8].
Lactate was an important metabolite of anaerobic respiration[9]. It can be used to detect diseases, such as heart rate failure and lactate[10]. In the aspect of physical exercise, the level of lactate can be estimated as the level of health after exercise[11]. To ensure the selectivity of the biosensor, enzymes were often used as electrocatalysts[12]. Lactate dehydrogenase (LDH) and laccase (Lac) were usually used in the process of catalyzing lactate[13]. LDH had highly stable and promotes the transition of lactate to pyruvate and nicotinamide adenine dinucleotide (NAD+), it was widely used in lactate biosensors[12, 14, 15].
Although self-powered lactate biosensors (SPLBs) had potential applications in detection, the conductivity and mechanical flexibility of the sensor electrodes remain major challenges [16, 17]. To address the problem of poor flexibility. Junlin Ma proposed a textile-based wearable glucose biosensor with excellent flexibility, which can continuously obtain relatively stable signals after bending 180° any 5000 times [18]. Ren Wang wove a lactate-sensing electrode from gold fibers into a textile. The textile lactate biosensor showed a detection limit of 19.13 µA mM− 1 cm− 2 [19]. Therefore, textile-based self-powered biosensors were a good way to improve flexibility.
However, most flexible fabrics and textile substrates were non-conductive; therefore, they could not be used directly in electrodes. In contrast, carbon nanotubes (CNT) and redox graphene (RGO) were proven as highly conductive biocompatible materials that can be efficiently used in electrochemical systems[20]. Danfeng Jiang improved the electron transfer from the active center of the biosensor enzyme to the electrode by uniformly covering the electrode surface with RGO. The biosensor had a high sensitivity of 40.6 µA mM− 1 cm− 2[21]. Yang, Yang reported a lactate biosensor, after modification by multi-walled carbon nanotubes (CNT). The lactate biosensor power-density of 62.2 ± 2.4 µW mM− 1 cm− 2 under bending/torsion conditions[22].
Additionally, according to our previous studies, polyethylene glycol diglyceryl ether (PEGDGE) was a good polymer to immobilize the enzyme on the bioelectrode and without affecting the enzyme activity[23]. Since polyvinyl acetate (PVA) gel has good mechanical strength and stability, which enables PVA gel electrolytes to maintain stable performance in various applications, PVA gel electrolytes were used in this experiment[24, 25] .
In this work, we decorated composites of reduced graphene oxide (RGO) and carbon nanotubes (CNT) onto a flexible cellulose fabric matrix (TMC). Immobilizing LDH and Lac onto the electrodes by PEGDGE to obtain bioanode and biocathode, respectively. Then morphological and electrochemical properties of the electrodes were investigated. Finally, the obtained bioelectrodes were assembled into SPLBs to study the sensing performance, mechanical stability, interference resistance and long-term storage stability. The recoveries of the lactate biosensor were evaluated by examining the collected real sweat sample. The SPLBs based on flexible textile matrix enzymatic electrodes had potential practical application in the field of health monitoring.
2.1 Chemicals, apparatus, and electrochemical measurements
Chemicals
Lactate (Lact), laccase (Lac, from Trametes Versicolor, 22.3 U mg− 1), NADH (Nicotinamide adenine dinucleotide), poly(ethylene glycol diglycidyl ether) (PEGDGE), polyvinyl acetate (PVA-124,from Aladdin Shanghai), Poly(ethylene glycol), lactate dehydrogenase (LDH from rabbit muscle, ≥ 250 U mg− 1), agarose and other common reagents were used in respective experiments as supplied by Aladdin-reagent corporation without any further purification. Reduced graphene oxide (RGO) and carboxylated multi-walled carbon nanotubes (CNT, length > 50nm) were supplied by Chengdu Organic Chemicals Co. Ltd. (Chengdu, China). Textile matrix based on cellulose fibers (TMC) was purchased from Suzhou Taili Material Technology Co. Ltd. (Suzhou, China). And all ultrapure water (18.2 MΩ cm) used in all the experiments was purified with the Millipore system.
Apparatus
Electrochemical experiments were performed with a IGS4030 Electrochemical Workstation (Guangzhou Ingsens Sensor Technology Co., Ltd., China).
Scanning electron microscopy (SEM) images were obtained using a SU8010 Field Emission Scanning Electron Microscope (Hitachi Co., Ltd., Japan) operating at 5.0 KV with the magnification of 500x, 5000x and 10,000x.
Raman spectrum (RS) was obtained using a HORIBA lab RAM HR Evolution Raman Spectrometer (HORIBA Scientific Co., Ltd., France) The test wavelength was 785 nm and the test range was between 100 cm− 1 and 3200 cm− 1.
Surface infrared spectroscopy (IR) was obtained using a Nicolet iN10 Infrared Spectroscopy (Thermofisher Scientific Co., Ltd., the United States) operating at a scanning step of 4 cm− 1, scanning number of 64 times from 600 to 4000 cm− 1.
X-ray photoelectron spectroscopy (XPS) measurements were recorded on an Thermo ESCALAB 250Xi (Thermofisher Scientific Co., Ltd., the United States) equipped with a 180o hemispherical energy analyzer operated at 0–5,000 eV and a monochromatic Al Kα source (hν = 1486.6 eV) operated at 150 W. The binding energy was calibrated based on C1s at 284.8 eV.
Electrochemical measurements
Electrochemical impedance spectroscopy (EIS) was performed in a 0.1 M KCl solution containing 0.001 M K3Fe(CN)6 and 0.001 M K4Fe(CN)6. EIS was applied at an initialization potential of 0.0 V, at an amplitude of 0.005 V, and within a frequency range of 10− 1 to 105 Hz.
Chronocoulometry was carried out in 0.1 M KCl solution containing 0.001 M K3Fe(CN)6 and 0.001 M K4Fe(CN)6 using 1 step within a potential range of 0.05 to 0.65 V and a pulse width of 0.25 s.
2.2 Fabrication of RGO-CNT/TMC electrode
Cut TMC to 3 × 30 mm, then immersed in 1 M HCl, absolute ethanol and ultrapure water for ultrasonic degreasing for 3 minutes gradually, rinsed with a large amount of ultrapure water, and finally dried in about 25°C, before preparing the RGO-CNT/TMC electrode. The RGO-CNT suspensions containing CNT (4.0 mg ml− 1) and RGO (1.0 mg ml− 1) were prepared by ultrasonic wave at 900 W. Then the RGO-CNT/TMC electrode were coated with suspensions and dried for 72 hours at about 25℃.
2.3 Preparation of the enzymatic anodes and cathodes
First, 10 wt% PEGDGE was mixed with 10 mg ml− 1 LDH in a volume ratio of 1:1 and stirred by eddy current for 1 minute to prepare the anode coating solution. For the preparation of LDH/RGO-CNT/TMC anodes, the dried RGO-CNT/TMC electrode was coated with 0.5 ml anode coating solution, and then the electrode was dried at 4 ℃ for at least 24 hours.
10 mg ml− 1 Lac and 10 wt % PEGDGE were mixed in a volume ratio of 1:1 and stirred by eddy current for 1 minute to obtain the cathode coating solution. In order to prepare Lac/RGO-CNT/TMC biocathode, 0.5 ml cathode coating solution was coated on the surface of the dried RGO-CNT/TMC electrode, and then the electrode was dried in air at 4 ℃ for at least 24 hours.
When the enzyme anode and cathode were completely dried, the surface of the electrodes were washed with water to remove enzymes that had not been stably immobilized in the polymer composite.
2.4 Preparation of PVA gel
Firstly, 0.25 g of polyethylene glycol was dissolved into 10ml of ultrapure water, then 1 g of PVA was added, and PVA was dissolved by heating and stirring, and 3 ml of PBS buffer solution with PH of 7 was added after cooling to room temperature, with continuous stirring during the process to make it fully mixed. Add 0.5 mol boric acid dropwise to make the gel form [26] .
2.5 Assembly and performances measurement of self-powered biosensors
The LDH/RGO-CNT/TMC bioanode was put onto the Lac/RGO-CNT/TMC biocathode with PVA gel electrolyte in between. Then sandwich the two bio-electrodes between two pieces of raw TMC as shown in Fig. 7d. Then, the raw textiles were sewed with thread to prevent bioelectrodes and electrolytes from leaking. It is worth noticing that the leading-out terminals should reach out to the raw TMC and be far from each other for preventing short circuits (Fig. 7d). the bioanode as the working electrode and biocathode as the counter electrode and reference electrode are connected through IGS4030 electrochemical workstation. Measure the polarization curve of the biosensors by linear sweep voltammetry (LSV) at low scan rate (0.01 V s− 1). Calculate the detection limit, sensitivity and recoveries of the self-powered biosensors based on the geometric area (4.5 cm2).
In order to prepare the materials of electrodes, the RGO-CNT complexes were uniformly covered on the textile matrix based on cellulose fibers (TMC) substrate by drop coating method. After that, LDH and Lac were applied dropwise to the RGO-CNT/TMC, thereby preparing the LDH/RGO-CNT/TMC and Lac/RGO-CNT/TMC. The whole preparation process and the pictures of the raw TMC and the RGO-CNT/TMC were showed in Fig. 1. It was obvious from the figure that the electrode color was darker after the addition of RGO-CNT complex, mainly due to the attachment of RGO-CNT.
3.1 Morphology of RGO-CNT/TMC
TMC showed a smooth fibrous porous structure under SEM images, after RGO-CNT complexes decoration didn't change the fibrous porous structure of the original TMC, but it made the fabric surface rougher. SEM analysis only reflects the surface structure of the material used for electrodes; it was also essential to explore the chemical structure on the surface of the materials;( additional data are given in Online Resource 1)
3.2 Chemical structure of RGO-CNT/TMC
To study the RGO-CNT/TMC furtherly, the chemical structure was investigated by surface infrared spectroscopy (IR), X-ray photoelectron spectroscopy (XPS), and Raman spectroscopy (RS), compared with raw TMC.
First, the IR spectra of the raw TMC and RGO-CNT/TMC were investigated. hydroxyl, alkyl, aldehyde, ether and C = C bonds were present on the surface of the TMC. Figure 3g showed the possible chemical structure of the original TMC, and the main chemical groups on RGO-CNT/TMC were hydrophilic hydroxyl and carboxyl groups. The functional groups of RGO-CNT/TMC were then investigated by XPS, and the results showed the presence of hydroxyl and carboxyl groups on the RGO-CNT complexes, which was consistent with the results of IR spectroscopy. Finally, the Raman spectra of pristine TMC and RGO-CNT/TMC were characterized, and the presence of D, G and 2D peaks also implied that the modification of TMC substrate by RGO-CNT complexes was successful. The results of their Raman spectra were consistent with those of IR and XPS;( additional data are given in Online Resource 2)
3.3 Electron transfer resistance of the electrodes
To explore the electrochemical properties of the electrodes, electrochemical impedance spectroscopy (EIS) was used to analyze the electron transfer resistance (Rct) by measuring the diameter of the semicircle in higher frequency portion of EIS curves[27]. Figure 4a showed representative EIS curves of raw TMC, RGO-CNT/TMC, LDH/RGO-CNT/TMC, and Lac/RGO-CNT/TMC electrodes.
The results show that the Rct of RGO-CNT/TMC electrode (Fig. 4a curve b, 0.49 kΩ) were much smaller than that of raw TMC electrode (Fig. 4a curve a, 1.92 kΩ). Because that the high conductive RGO-CNT complexes were decorated on TMC substrate. The RGO-CNT complexes were outstanding materials to decrease the Rct of non-conductive substrate materials. The small Rct value of the RGO-CNT/TMC electrodes meant great electron transfer capability. Therefore, the RGO-CNT/TMC electrodes was a good indicator for fabricating high-performance enzymatic electrodes.
The Rct of LDH/RGO-CNT/TMC and Lac/RGO-CNT/TMC electrodes (Fig. 4a curve c and d) were increased to 0.72 kΩ and 0.66 kΩ, respectively, after decorated with enzymes and PEGDGE on RGO-CNT/TMC electrode (Fig. 4a curve b, 0.49 kΩ), suggesting that the non-conductive protein shell of Lac and LDH and the space steric hindrance of PEGDGE hindering the electron transfer. The increase of the Rct showed the success of the coating method and the inevitable resistance to electron transfer caused by enzymes and polymers.
In sum, the high conductive RGO-CNT complexes were outstanding materials to decrease the Rct of non-conductive substrate materials. However, with the process of coating enzymes and polymers, the Rct increase unavoidably.
3.4 Electroactive surface area of the electrodes
In order to investigate the electrochemical effects of RGO-CNT complexes to TMC, electroactive surface area of raw TMC and RGO-CNT/TMC electrodes were measured by chronocoulometry, respectively. This experiment was based on the following Eq. (1)[28]:
$$Q=(2nFA{{D}_{o}}^{\frac{1}{2}}\bullet {\pi }^{-\frac{1}{2}}\bullet {C}_{o})\bullet {t}^{1/2}$$
1
In the equation, Q was the absolute value of the charge passed; n was the number of electrons in the reaction; F was the Faraday constant; Do was the diffusion coefficient of potassium ferrocyanide; Co was the initial molar concentration of the electroactive species in solution; A was the electroactive surface area of the electrode[28]. According to the above equation, Q was linearly related to t1/2, because the other parameters in the equation remained almost constant under the same electrochemical measurement conditions[29]. The Q-t1/2 relationship for different electrodes could be plotted to study the electroactive surface area of different electrodes.
Figure 4b showed the relationship between the Q and t1/2. The electroactive surface area of RGO-CNT/TMC electrodes (Fig. 4b curve b) was significantly increased compared with that of raw TMC (Fig. 4b curve a), indicating that the RGO-CNT complexes expanded the electroactive surface area of raw TMC. The nano structure of the RGO-CNT complexes could enlarge the area of the TMC, and laid a solid foundation to greater enzymatic loading density, which had strong relationship with electrocatalytic efficiency of the bioelectrodes. In short, the nano structure of RGO-CNT complexes significantly enhanced the electroactive surface area of the electrodes.
3.5 Performances of LDH/RGO-CNT/TMC bioanode
In order to study the electrochemical characteristics of the LDH/RGO-CNT/TMC bioanode, cyclic voltammetry (CV) was carried out in the air-saturated 0.1 M phosphate buffer pH 7.0 PBS containing 2 mM NADH and 50 mM lactate (Fig. 5a). The CVs of the raw TMC (Fig. 5a curve a) and RGO-CNT/TMC (Fig. 5a curve b) didn’t had any peaks, suggesting that they didn’t had reaction with NADH and lactate. Moreover, the double-layer charging and discharging current of RGO-CNT/TMC was stronger than the raw TMC, due to the growth of surface area of RGO-CNT/TMC.
In compared with the non-enzymatic electrode, the LDH/RGO-CNT/TMC electrode showed larger current caused by oxidation and reduction reaction with NADH and lactate (Fig. 5a curve c). Nicotinamide adenine dinucleotide (NADH) was the cofactor of LDH. LDH converted lactate to pyruvate, while NAD+ was reduced to NADH, which was then oxidized by the modified electrode to regenerate NAD+. The reaction equation was as follows (2) and (3)[30] :
$$Lactate+LDH\left({NAD}^{+}\right)\to LDH\left(NADH\right)+Pyruvate+{H}^{+}$$
2
$$LDH\left(NADH\right)\to LDH\left({NAD}^{+}\right)+2{e}^{-}+{H}^{+}$$
3
The enzymatic loading density (Γ ) on the electrodes surface was a key factor in determining the performances of bio-electrodes. Therefore, the G value of the LDH/RGO-CNT/TMC bioanode were calculated according to the following Eq. (4)[28]:
Γ = Q/nFA (4)
where Q was the charge obtained by integrating the anode peak (Fig. 5A curve c) at a low scan rate (0.01 mV s− 1); n was the number of electrons transferred in the reaction; F was the Faraday constant, and A was the geometric area of the electrode (4.5 cm2). The value of Γ was calculated to be 3.59×10− 8 mol cm− 2. RGO-CNT/TMC had a higher enzyme loading capacity compared with previous reports[31, 32]. The high loading capacity of the bioanode was attributed to the porous structure of the RGO-CNT complexes and the large electroactive surface area due to the three-dimensional structure of the TMC substrate.
To investigated the electrocatalytic performance of the LDH/RGO-CNT/TMC electrode for lactate oxidation, the electrochemical response of the LDH/RGO-CNT/TMC electrode was measured at lactate concentrations from 0 mM to 100 mM (Fig. 5b). With increasing lactate concentration, the number of electrons consumed by oxygen during the enzymatic reaction increases leaded to an increase in the oxidation and reduction current [33].When the lactate concentration exceeded 80 mM (inset of Fig. 5b), indicating that the lactate reached saturation. Increased lactate concentration would improve the rate of the reaction in Eqs. (2) and (3), which enlarge the electrocatalytic current, thus indirectly enabling the quantitative determination of lactate.
When the concentration of lactate was high, the slope of the straight line increases first and then tends to be flat, which conforms to the characteristics of Michaelis Menten kinetics[34]. Michaelis–Menten constant (\({K}_{m}^{app}\)) was an important parameter to reveal the kinetics of enzyme substrate reaction[35].This parameter was calculated by Lineweaver Burk Eq. (5)[36] .

Where Iss was the current at steady state, C was the concentration at steady state, and Imax was the maximum current measured under saturated conditions. The enzyme activity value of LDH/RGO-CNT/TMC electrode for lactate was calculated as 1.46 mM. Compared with previous works, the \({K}_{m}^{app}\) in this work was lower [37]. The lower constant verified that LDH loaded on RGO-CNT/TMC electrode had high enzymatic activity, which was due to the excellent enzyme embedding method and good biocompatibility of PEGDGE.
In conclusion, the LDH/RGO-CNT/TMC biocathode had a large enzyme loading density, high electrocatalytic efficiency, and high enzymatic activity. Therefore, it was a good choice for the preparation of lactate self-powered biosensors.
Figure 5 (a) CV responses of (a) raw TMC, (b) RGO-CNT/TMC, and (c) LDH/RGO-CNT/TMC in air-saturated 0.1 M PBS (pH 7.0) containing 2 mM NADH and 50 mM lactate at scan rate of 0.01 V s− 1. (b) Recording CV curves of LDH/RGO-CNT/TMC bioanode in air-saturated PBS (pH 7.0) containing 2 mM NADH at a scan rate of 0.01 V s− 1 during successive addition of lactate from 0 mM to 100 mM; inset: The peak current for lactate oxidation vs the concentration of lactate.
3.6 Performances of Lac/RGO-CNT/TMC biocathode
To investigate the electrocatalysis performance of the Lac/RGO-CNT/TMC biocathode, the CV responses of the biocathode with different concentration of oxygen was compared, and the results were showed in Fig. 6. When oxygen was saturated in the electrolyte (Fig. 6 curve b), the reduction current of the Lac/RGO-CNT/TMC electrode became larger and the oxidation current decreased, compared with the response of the same electrode in the air-saturated electrolyte. The whole CV curve moved downward, indicating that the biocathode with Lac as the electro-catalyst could catalyze oxygen reduction reaction effectively. The high electrocatalytic efficiency of the biocathode resulted from the increased electron transfer resistance caused by decoration of RGO-CNT complexes.
According to our previous research, without oxygen in electrolyte, the direct redox of multicopper active sites in Lac would dominte on the surface of the biocathode[38]. The relative reaction was showed in Eq. 6 [36, 38]:
Lac(Ox) + 4e−+4H+↔Lac(Red) (6)
Without oxygen, the reduction of Lac (Red) and oxidation of Lac (Ox) reaction rates (Eq. 6) was equal and balanced[36]. In comparison, after increasing the concentration of oxygen in the electrolyte, the reaction between oxygen and Lac (Red) (Eq. 7) accelerates the generation of Lac (Ox). More Lac (Ox) means faster electrons transfer from biocathode to active sites in Lac (Eq. 8), leading to a larger absolute value of reduction current. On the other hand, oxygen limits the quantity of Lac (Red), resulting in the reverse reaction rates of Eq. 6 decrease. Thus, the decline of the oxidation current of Lac occurs in the presence of oxygen. The relative reaction was showed in Eqs. 6 and 7 [39]:
O2 + Lac(Red)→Lac(Ox) + 2H2O (7)
Lac(Ox) + 4e−+4H+→Lac(Red) (8)
In short, the Lac/RGO-CNT/TMC biocathode had a high electrocatalytic efficiency for oxygen reduction reaction.
3.7 Performances of the self-powered biosensors
Due to the excellent electrochemical activity of the bioelectrode, the LDH/RGO-CNT/TMC bioanode and Lac/RGO-CNT/TMC biocathode were assembled into a stretchable and bendable lactate self-powered biosensor (Fig. 7d). The bioelectrode performance was tested in the state of stretching 43.3% and bending 180° with the help of external forces, as showed in Fig. 7, where the biosensor operated in air-saturated 0.1 M PBS (pH 7.0) containing 2 mM NADH and various concentrations of lactate.
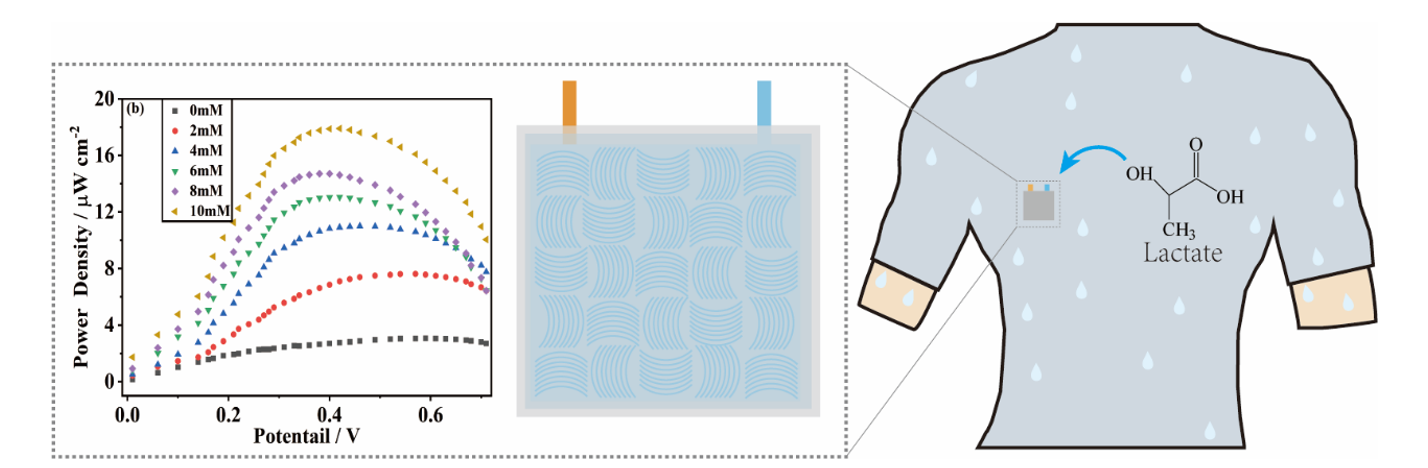
Figure 8a showed the polarization curves of LSV in 0–10 mM lactate solution. In order to investigate the performance of the lactate sensor, the power density profile of the biosensor was measured at variations of lactate concentration from 0 mM to 10 mM (Fig. 8b), and when 10 mM lactate was added, the maximum output power was 18.46 µW cm− 2, which can be used as a biosensor fuel. Power-based sensing in sensing lactate was investigated by recording the current voltage when lactate was gradually added. The showed the (Fig. 8b) showed the power density profiles of the biosensor measured under different conditions with lactate concentrations ranging from 0 mM to 10 mM. The functioning of the biosensor was investigated by recording the highest power output density after the progressive addition of lactate. The calibration curve (Fig. 8c) showed a linear response (R2 = 0.994) of the lactate sensor in the range of 0 ~ 10 mM lactate with a sensitivity of 3.16 µW mM− 1 cm− 2. The limit of detection (LOD) calculated from the calibration curve was 9.49 µM (S/N = 3). The linear range, detection limit and sensitivity were compared with the self-powered lactate biosensor reported in Table 1, and the biosensor was found to be promising for lactate detection
In addition, bendability and stretchability of the flexible textile matrix enzymatic bioelectrodes was characterized. Figure 7b and 7c showed the mechanical flexibility of the bioelectrodes in bending and stretching [2]. Figure 8d showed the mechanical stability of the bioelectrodes by measuring their current density in 0.1 M PBS (pH 7.0) with 2 mM lactate and 2 mM NADH after repetitively bending and stretching. The bioelectrodes were bent to 180° and stretched to 43.3%. The original current density could still maintain more than 95% after 300 cycles. The high mechanical flexibility of the bioelectrodes was made possible by the flexible TMC. This property demonstrated the potential good flexibility of the biosensors prepared by these flexible TMC electrodes.
|
The main feature of the biosensors |
Output signal |
Linear range (mM) |
LOD(µM) |
Reference |
|---|---|---|---|---|
|
Lactate biosensors using sensing membranes |
Current |
0.1–0.8 |
60 |
[40] |
|
New quasi-direct electron transfer type sensors |
- |
0–1 |
9.9 |
[41] |
|
Electrochemical biosensors for lactate detection |
Current |
0–2 |
- |
[42] |
|
Smartphone-based electrochemical lactate biosensor. |
0.05-10 |
9.1 |
[43] |
|
|
Electronic skin stretchable self-powered biosensor |
Voltage |
0–10 |
- |
[2] |
|
Nanocomposites for detection of lactate in human serum and urine |
Current |
100–5000 |
11.6 |
[44] |
|
Self-powered lactate biosensors based on flexible textile matrix enzymatic electrodes |
Power |
1–10 |
9.49 |
This work |
To test the anti-interference of the lactate self-powered biosensor, the effects of interfering substances in sweat, such as NaCl, KCl and urea, were studied by cyclic voltammetry. As showed in Fig. 8E, after the addition of 10 mM NaCl, 20 mM KCl and 0.05 mM [19]Urea to the lactate solution. The effect of interfering substances to the current responses were kept within 8.0%, implying the excellent anti-interference ability due to the selectivity of the LDH in lactate biosensor. Thus, the obtained biosensor was promising for the detection of lactate.
Figure 8 (a) Polarization curves at 0–10 mM lactate solution by LSV at low scan rate of 0.01 V s− 1 (b) Power density curves of self-powered biosensors at lactate concentrations; (c) Plot of power density versus lactate concentration (R2 = 0.994) calibration curve; (d) Stability of the bioelectrodes under tensile and bending conditions; (e) Anti-interference of the biosensor to 2 mM lactate in 0.1 M PBS (pH 7.0) containing 2 mM NADH, 10 mM NaCl, 20 mM KCl and 0.05 mM Urea; (f) Long-term storage stability of 30 days in 4°C
To investigate the stability of the biosensor in long-term storage, the performance was obtained by measuring the biosensor current signal every 6 days for 30 consecutive days, as showed in Fig. 8F. The performance of the biosensor can still be maintained at 83% during 30 consecutive tests, which showed that the device was stable. The biosensor relies mainly on lactate dehydrogenase to measure lactate. During storage, the activity of the enzyme decreases, which led to a decrease in electron transfer efficiency and a decrease in sensing performance.
3.8 Determination of lactate in real sweat sample
In order to test the actual performance of the lactate biosensor for use in real sweat, we integrated the sensor into clothing, as shown in Fig. 7e. We performed experiments with lactate recovery in the clothing. As shown in Table 2, the lactate recovery ranged from 99.66–108.43% with a relative standard deviation (RSD) of less than 4.65%. Therefore, the lactate self-powered biosensor has good application prospects for detecting lactate content in real sweat.
|
Samples |
Theory (mM) |
Detected (mM) |
Recovery (%) |
RSD (%) |
|---|---|---|---|---|
|
1 |
0.1 |
0.1508 |
105.31 |
4.64 |
|
0.1 |
0.238 |
108.43 |
||
|
0.1 |
0.1537 |
106.45 |
||
|
2 |
1 |
0.9900 |
99.7 |
3.02 |
|
1 |
1.04859 |
100.28 |
||
|
1 |
1.1198 |
102.61 |
||
|
3 |
2 |
2.08 |
100.41 |
1.48 |
|
2 |
1.936 |
99.66 |
||
|
2 |
2.085 |
101.60 |
The RGO-CNT complex on the surface of the electrode has good electrical conductivity. The large surface area and porous structure of the RGO-CNT complex and TMC give the bioelectrode good enzyme loading density and catalytic efficiency. A Michaelis-Menten constant of 1.46 mM was obtained using the enzyme encapsulation method with PVA gel electrolyte, confirming the high enzymatic activity of LDH. The self-powered lactate biosensor showed a sensitivity of 3.16 µW mM− 1 cm− 2 and a detection limit of 9.49 µM (S/N = 3) in the 0–10 mM linear range. The biosensor had great potential for flexibility, immunity to interference, and long-term stability. The lactate biosensor recoveries ranged between 99.66% and 108.43% for lactate detection in real sweat when the assembled sensor was attached to clothing. The biosensor showed good potential for lactate detection.
Acknowledgments
This work was supported by the Ph.D. Research Initiation Fund of Xi’an Polytechnic University (No: 310/107020509 and No: 310/107020555); Natural Science Basic Research Program of Shaanxi (Program No. 2021JQ-663, 2023-JC-QN-0565 and No. 2021JQ-671); The Scientific Research Program Funded by Shaanxi Provincial Education Department (Program No. 21JK0662). National Natural Science Foundation of China (NO. 22208256). The authors declare that they had no conflict of interest.
- Cheng Y, Wang K, Xu H, Li T, Jin Q, Cui D (Oct 2021) Recent developments in sensors for wearable device applications. Anal Bioanal Chem 413:6037–6057. 10.1007/s00216-021-03602-2
- Huang X et al (Jan 2022) Epidermal self-powered sweat sensors for glucose and lactate monitoring. Bio-Design and Manufacturing 5(1):201–209. 10.1007/s42242-021-00156-1
- Wang F, Cai R, Tan W (2023) "Self-Powered Biosensor for a Highly Efficient and Ultrasensitive Dual-Biomarker Assay," Analytical Chemistry, Article vol. 95, no. 14, pp. 6046–6052, Apr 11 doi: 10.1021/acs.analchem.3c00097
- Bollella P, Boeva Z, Latonen R-M, Kano K, Gorton L, Bobacka J (2021) "Highly sensitive and stable fructose self-powered biosensor based on a self-charging biosupercapacitor," Biosensors & Bioelectronics, vol. 176, Mar 15 Art no. 112909, doi: 10.1016/j.bios.2020.112909
- Han O, Jiang D, Fan Y, Wang ZL, Li Z "Self-powered technology for next-generation biosensor," Sci Bull, vol. 66, no. 17, pp. 1709–1712, Sep 15 2021, doi: 10.1016/j.scib.2021.04.035
- Tong C, Liu H, Mo Y, Li J, Liu X, Pang L (2023) "In-situ growth of enzyme/copper phosphate hybrids on carbon cloth surface as self-powered electrochemical glucose biosensor," Biochemical Engineering Journal, Article vol. 193, Apr Art no. 108860, doi: 10.1016/j.bej.2023.108860
- Yi J, Xianyu Y (2022) "Gold Nanomaterials-Implemented Wearable Sensors for Healthcare Applications," Advanced Functional Materials, vol. 32, no. 19, May Art no. 2113012, doi: 10.1002/adfm.202113012
- Promphet N, Ummartyotin S, Ngeontae W, Puthongkham P, Rodthongkum N (2021) "Non-invasive wearable chemical sensors in real-life applications," Analytica Chimica Acta, vol. 1179, Sep 22 Art no. 338643, doi: 10.1016/j.aca.2021.338643
- Jiang Y et al "Hemocytes in blue mussel Mytilus edulis adopt different energy supply modes to cope with different BDE-47 exposures," Sci Total Environ Article vol. 885, Aug 10 2023, Art no. 163766, doi: 10.1016/j.scitotenv.2023.163766
- Schuck A, Kim HE, Moreira JK, Lora PS, Kim Y-S (2021) "A Graphene-Based Enzymatic Biosensor Using a Common-Gate Field-Effect Transistor for L-Lactic Acid Detection in Blood Plasma Samples," Sensors, vol. 21, no. 5, Mar Art no. 1852, doi: 10.3390/s21051852
- A BG, C CC, G LR, D OA, D. J. J, and, A AJ (2022) 2022 "Tracing the lactate shuttle to the mitochondrial reticulum," Experimental and Molecular Medicine, vol. 54, pp. 1–16, doi: 10.1038/s12276-022-00802-3
- Zhukova GV, Sutormin OS, Sukovataya IE, Maznyak NV, Kratasyuk VA (2023) "Bioluminescent-Triple-Enzyme-Based Biosensor with Lactate Dehydrogenase for Non-Invasive Training Load Monitoring," Sensors, Article vol. 23, no. 5, Mar Art no. 2865, doi: 10.3390/s23052865
- Golveia JCS, Bara MTF, Santiago MF, Campos LC, Schimidt F "Cocoa Agro-Industrial Residue (Theobroma cacao) as Inducer of the Production of Fungal Laccase and Kojic Acid for Application in the Biodegradation of 17-α-Ethinylestradiol," J Braz Chem Soc, vol. 31, no. 10, pp. 2023–2029, 2020-10 2020, doi: 10.21577/0103-5053.20200102
- Higashi M, Toyodome T, Kano K, Amao Y "Photoelectrochemical lactate production from pyruvate via in situ NADH regeneration over a hybrid system of CdS photoanode and lactate dehydrogenase," Electrochim Acta Article vol. 460, Aug 20 2023, Art no. 142590, doi: 10.1016/j.electacta.2023.142590
- Shortall K et al (Jun 6 2023) Coupled immobilized bi-enzymatic flow reactor employing cofactor regeneration of NAD(+) using a thermophilic aldehyde dehydrogenase and lactate dehydrogenase. Green Chem Article vol 25(11):4553–4564. 10.1039/d3gc01536j
- Zhang J et al (2021) "Self-Healing Mechanism and Conductivity of the Hydrogel Flexible Sensors: A Review," Gels, vol. 7, no. 4, Dec Art no. 216, doi: 10.3390/gels7040216
- Song Z et al (2023) "Flexible and Wearable Biosensors for Monitoring Health Conditions," Biosensors-Basel, Review vol. 13, no. 6, Jun Art no. 630, doi: 10.3390/bios13060630
- Ma J et al "Oil-water self-assembly engineering of Prussian blue/quantum dots decorated graphene film for wearable textile biosensors and photoelectronic unit," Chemical Engineering Journal, vol. 427, Jan 1 2022, Art no. 131824, doi: 10.1016/j.cej.2021.131824
- Wang R, Zhai Q, An T, Gong S, Cheng W (2021) "Stretchable gold fiber-based wearable textile electrochemical biosensor for lactate monitoring in sweat," Talanta, vol. 222, Jan 15 Art no. 121484, doi: 10.1016/j.talanta.2020.121484
- Qin H, Wang Z, Yu Q, Xu Q, Hu X-Y "Flexible dibutyl phthalate aptasensor based on self-powered CNTs-rGO enzymatic biofuel cells," Sens Actuators B-Chemical Article vol. 371, Nov 15 2022, Art no. 132468, doi: 10.1016/j.snb.2022.132468
- Jiang D et al "In-situ preparation of lactate-sensing membrane for the noninvasive and wearable analysis of sweat," Biosens Bioelectron, vol. 210, Aug 15 2022, Art no. 114303, doi: 10.1016/j.bios.2022.114303
- Yang Y, Su Y, Zhu X, Ye D, Chen R, Liao Q "Flexible enzymatic biofuel cell based on 1, 4-naphthoquinone/MWCNT-Modified bio-anode and polyvinyl alcohol hydrogel electrolyte," Biosens Bioelectron, Article vol. 198, Feb 15 2022, Art no. 113833, doi: 10.1016/j.bios.2021.113833
- Wijayanti SD, Schachinger F, Ludwig R, Haltrich D (2023) "Electrochemical and biosensing properties of an FAD-dependent glucose dehydrogenase from Trichoderma virens," Bioelectrochemistry, Article vol. 153, Oct Art no. 108480, doi: 10.1016/j.bioelechem.2023.108480
- Paik JJ, Jang B, Nam S, Guo LJ (2023) "A Transparent Poly(vinyl alcohol) Ion-Conducting Organohydrogel for Skin-Based Strain-Sensing Applications," Advanced Healthcare Materials, Article; Early Access doi: 10.1002/adhm.202300076
- Zhang J et al "High-Energy-Density Zinc-Air Microbatteries with Lean PVA-KOH-K2CO3 Gel Electrolytes," Acs Appl Mater Interfaces Article vol. 15, no. 5, pp. 6807–6816, Feb 8 2023, doi: 10.1021/acsami.2c19970
- Rahmani S, Olad A, Rahmani Z (Apr 2023) Preparation of self-healable nanocomposite hydrogel based on Gum Arabic/gelatin and graphene oxide: study of drug delivery behavior. Polym Bull Article vol 80(4):4117–4138. 10.1007/s00289-022-04247-6
- Kim Y et al "Caco-2 cell-derived biomimetic electrochemical biosensor for cholera toxin detection," Biosens Bioelectron, Article vol. 226, Apr 15 2023, Art no. 115105, doi: 10.1016/j.bios.2023.115105
- Fan S et al (Nov 2022) Stretchable and bendable textile matrix based on cellulose fibers for wearable self-powered glucose biosensors. Cellulose Article vol 29(16):8919–8935. 10.1007/s10570-022-04820-2
- Zafar MN, Aslam I, Ludwig R, Xu G, Gorton L "An efficient and versatile membraneless bioanode for biofuel cells based on Corynascus thermophilus cellobiose dehydrogenase," Electrochim Acta, vol. 295, pp. 316–324, Feb 1 2019, doi: 10.1016/j.electacta.2018.10.047
- Sun H et al (2023) Live-cell imaging reveals redox metabolic reprogramming during zygotic genome activation. J Cell Physiol Article; Early Access. 10.1002/jcp.31054
- Shen F et al (Jul 1 2019) Two-dimensional graphene paper supported flexible enzymatic fuel cells. Nanoscale Adv 1(7):2562–2570. 10.1039/c9na00178f
- Wang L-L, Shao H-H, Wang W-J, Zhang J-R, Zhu J-J (Feb 2018) Nitrogen-doped hollow carbon nanospheres for high-energy-density biofuel cells and self-powered sensing of microRNA-21 and microRNA-141. Nano Energy 44:95–102. 10.1016/j.nanoen.2017.11.055
- Chelliah M, Nesakumar N, Thandavan K, Sethuraman S, Krishnan UM, Rayappan JBB (Mar 2014) An Electrochemical Biosensor with Nano-Interface for Lactate Detection Based on Lactate Dehydrogenase Immobilized on Iron Oxide Nanoparticles. Nanosci Nanatechnol Lett Article vol 6(3):242–249. 10.1166/nnl.2014.1744
- Iacovino LG et al (Aug 2022) Allosteric transitions of rabbit skeletal muscle lactate dehydrogenase induced by pH-dependent dissociation of the tetrameric enzyme. Biochimie Article vol 199:23–35. 10.1016/j.biochi.2022.03.008
- Jeyabarathi P, Rajendran L, Lyons MEG (2022) "Reaction-diffusion in a packed-bed reactors: Enzymatic isomerization with Michaelis-Menten Kinetics," Journal of Electroanalytical Chemistry, Article vol. 910, Apr 1 Art no. 116184, doi: 10.1016/j.jelechem.2022.116184
- Hui Y, Wang H, Zuo W, Ma X "Spider nest shaped multi-scale three-dimensional enzymatic electrodes for glucose/oxygen biofuel cells," Int J Hydrogen Energy Article vol. 47, no. 9, pp. 6187–6199, Jan 29 2022, doi: 10.1016/j.ijhydene.2021.11.2100360-3199
- Hu T et al "A pH-responsive ultrathin Cu-based nanoplatform for specific photothermal and chemodynamic synergistic therapy," Chem Sci, vol. 12, no. 7, pp. 2594–2603, Feb 21 2021, doi: 10.1039/d0sc06742c
- Hui Y, Ma X, Qu F (Jan 2019) Flexible glucose/oxygen enzymatic biofuel cells based on three-dimensional gold-coated nickel foam. J Solid State Electrochem Article vol 23(1):169–178. 10.1007/s10008-018-4099-4
- Wan J, Mi L, Tian Z, Li Q, Liu S "A single-liquid miniature biofuel cell with boosting power density via gas diffusion bioelectrodes," J Mater Chem B, vol. 8, no. 16, pp. 3550–3556, Apr 28 2020, doi: 10.1039/c9tb02100k
- Duong HD, Rhee JI (2021) "Ratiometric Fluorescent Biosensors for Glucose and Lactate Using an Oxygen-Sensing Membrane," Biosensors-Basel, Article vol. 11, no. 7, Jul Art no. 208, doi: 10.3390/bios11070208
- Fitriana M, Hiraka K, Ikebukuro K, Sode K, Tsugawa W (2022) 2022 "A Thiol-reactive Phenazine Ethosulfate - A Novel Redox Mediator for Quasi-direct Electron-transfer-type Sensors," Sensors and Materials, Article vol. 34, no. 6, pp. 2105–2124, doi: 10.18494/sam3898
- Liu M, Yang M, Wang M, Wang H, Cheng J (2022) "A Flexible Dual-Analyte Electrochemical Biosensor for Salivary Glucose and Lactate Detection," Biosensors-Basel, Article vol. 12, no. 4, Apr Art no. 210, doi: 10.3390/bios12040210
- Payne ME, Zamarayeva A, Pister VI, Yamamoto NAD, Arias AC "Printed, Flexible Lactate Sensors: Design Considerations Before Performing On-Body Measurements," Scientific Reports, Article vol. 9, Sep 23 2019, Art no. 13720, doi: 10.1038/s41598-019-49689-7
- Maduraiveeran G, Chen A "Design of an enzyme-mimicking NiO@Au nanocomposite for the sensitive electrochemical detection of lactic acid in human serum and urine," Electrochimica Acta, Article vol. 368, Feb 1 2021, Art no. 137612, doi: 10.1016/j.electacta.2020.137612
No competing interests reported.
- SupplementaryMaterial.docx
- AbstractFigure.png
Abstract figures, sensors integrated into clothing, and test charts.