Establishment of quantitative determination model
Raman spectral quantitative determination of photosynthetic pigments in tea leaf
As shown in Table 2, different pretreatment methods produced different results referring to the values of R2 and RMSE, indicating that pretreatment has a great influence on the performance of the model. In regard of the Car, model 5 based on the WT preprocessing method is obviously better than model 1 based the original data. In detail, the R2p of the model 1 increased from 0.614 to 0.713 of the model 5, and RMSEp of the model 1 decreased from 0.140 to 0.108 of the model 5. For Chl-a and Chl-b, model 10 and model 16 respectively obtained the best results based on the optimal pretreatment method of RCF. Comparing with the model 7 based on the original data, the R2p of model 10 increased from 0.597 to 0.800, and RMSEp of model 10 decreased from 0.900 to 0.599. While, the R2p and RMSEp of model 16 were respectively 0.734 and 0.330, which were obviously better than the relevant parameters (0.718 and 0.342) of model 13. Furthermore, the difference among calibration, validation and prediction of the model 5, 10 and 16 was also relatively small, which indicates that the stability of these models is improved through pretreatment.
In the present study, WT and RCF pretreatment methods have improved spectral data with higher R2P value and lower RMSEP when compared to other methods (Table 2). The analysis of Raman spectra is usually involved with background problems caused by fluorescence effects.
Raman spectroscopy is a weak scattering signal, which intensity is about 1/10 million of that of Rayleigh scattering, that often accompanies it. And it is particularly easily interfered by the background fluorescence of plant tissue, which makes it difficult to directly use the spectrum for reliable quantitative and positional analysis [39]. The background should be deleted because there is no chemical information in it. RCF is an easy-to-use and intuitive filter to eliminate background effects [40]. According to the results reported by [41–43], the background with minimum changes in the parameters of the Raman spectra is effectively subtracted by the RCF method. Due to its advantages, this method was widely used and previous research results in the field of Raman spectroscopy proved that RCF is superior to other methods, which is consistent with the results obtained in this work.
WT is also a very powerful tool in compressing analytical signals [44, 45]. It transforms the raw data into the wavelet domain, so the information included in raw data can be compressed and explained by a small number of wavelet coefficients. WT was successfully applied and multivariate analytical problems were significantly simplified by this method [46, 47].
Selecting of characteristic bands for quantitative determination
Raman spectroscopy provides a wide range of spectral information. In this research, there are 1005 and 1044 spectral variables from the master and the slave instruments respectively. And, there are still remaining 448 spectral variables after intercepting the common wavenumbers and removing the two ends of the spectrum seriously disturbed by noise. The Raman spectra contain not only biological, physiological and structural information related to detection objects, but also redundant information [33]. In order to explore the mechanism of the detection of photosynthetic pigment in tea leaves by Raman spectroscopy, a large number of redundant and interference information were excluded. Furthermore, selecting a small number of effective band can shorten the modeling time and improve the accuracy of the model. The CARS was adopted to extract the effective band for spectral measurement of the photosynthetic pigments based on the spectral data pretreated by the WT and RCF pretreatment, and the models based on the characteristic bands were established, and the modeling results were shown in Table 3. It can be found that the RCF was better than the WT pretreatment for all the three pigments, and the models based on these characteristic bands were better compared with the full-band models (as shown in Table 2).
The spectral profiles before and after the RCF pretreatment were shown in Fig. 1, it can be found that the RCF method eliminated the fluorescence background and increased the signal-to-noise ratio of spectra, this may be the reason why the RCF pretreatment can improve the performance of the spectral determination models. Oh et al. [48] used RCF pretreatment in real-time estimation of glucose concentration in algae by Raman spectroscopy, and the result was also improved.
Scatter diagram of prediction values and real values of the models (model 19, 21 and 23) for training and test samples were shown in Fig. 2. It can be found that the models based on the characteristic wavenumbers had achieved better result than the model based on the full-band model (as shown in Table 2). In addition, low dimensional input variables of characteristic wavenumbers greatly reduce the complexity of the model and improve the calculation speed of the model. Zhao et al. [11] used hyperspectral imaging technique to build the models to estimate the chlorophyll content in tea and obtained RMSEC, R2C, RMSEP and R2P of Chl-b model with the values of 9.918, 0.711, 8.601, and 0.693, respectively, which is obviously worse than the result of our research. Therefore, the obtained results showed that it is feasible to predict the concentration of photosynthetic pigments based on Raman spectroscopy.
As the Raman spectroscopy can reflect the fingerprints information of the composition and structure of substances, an assignment of these characteristic wavenumbers was implemented to further explore the substance basis of quantitative determination of pigment by Raman spectroscopy. The Raman spectral characteristic bands for pigments detection were selected by the CARS algorithm and the selected wavenumbers were shown in Fig 3 and Table s1. There were three distinct peaks in the figure, including the rocking vibration in the CH3 plane at 1008 cm-1, the C-C stretching vibration at 1159 cm-1, and C=C stretching vibration at 1528 cm-1 which are the characteristic peaks of photosynthetic pigment [49, 50]. The assignment of these characteristic wavenumbers was shown in Table 4, and the wavenumbers were connected to the composition and structure of substances based on the references. It can be seen that most of the wavenumbers were related to photosynthetic pigment, which explains the reason why models based on characteristic wavenumbers obtained good results.
In addition, several characteristic wavenumbers extracted in this study were also related to protein (1651 cm-1) and nucleic acid (1665 cm-1) [56], etc., this may be due to that the concentration of photosynthetic pigments is the percentage of the amount of pigment to the mass of dry matter in tea leaves, in other words, the quantity of other dry matter in tea will also affect the percentage of pigment, so the characteristic peaks of other dry matter in the tea will also be selected. Furthermore,
the wavelength selection algorithm based on data mining may also select some bands without specific component assignment as a benchmark for data processing.
Calibration model transfer
Direct standardization of spectral data from the master and slave instruments
The direct standardization (DS) method was adopted to standardize the Raman spectral responses from the slave instrument. It can be seen from the Fig. 1(a) and Fig. 4(a) that the spectral data measured by the two instruments all had distinct fluorescent background, and the trend of the fluorescent background was different due to the different instruments. The spectra after removing the fluorescent background by using RCF was respectively shown in Fig. 1(b) and Fig. 4(b), it can be found that the RCF pretreatment greatly improves the signal to noise ratio of the spectra, which is conducive to the subsequent analysis. Slave spectral after DS was shown in Fig. 4(c). Comparing with Fig. 1(b), it can be found that the spectra of slave instrument (as shown in Fig. 4(c)) after DS was similar to that of the master instrument, indicating that the spectral variation between the master and slave Raman spectrometer can be effectively eliminated.
Imaging photosynthetic pigment in tea leaf based on model transfer
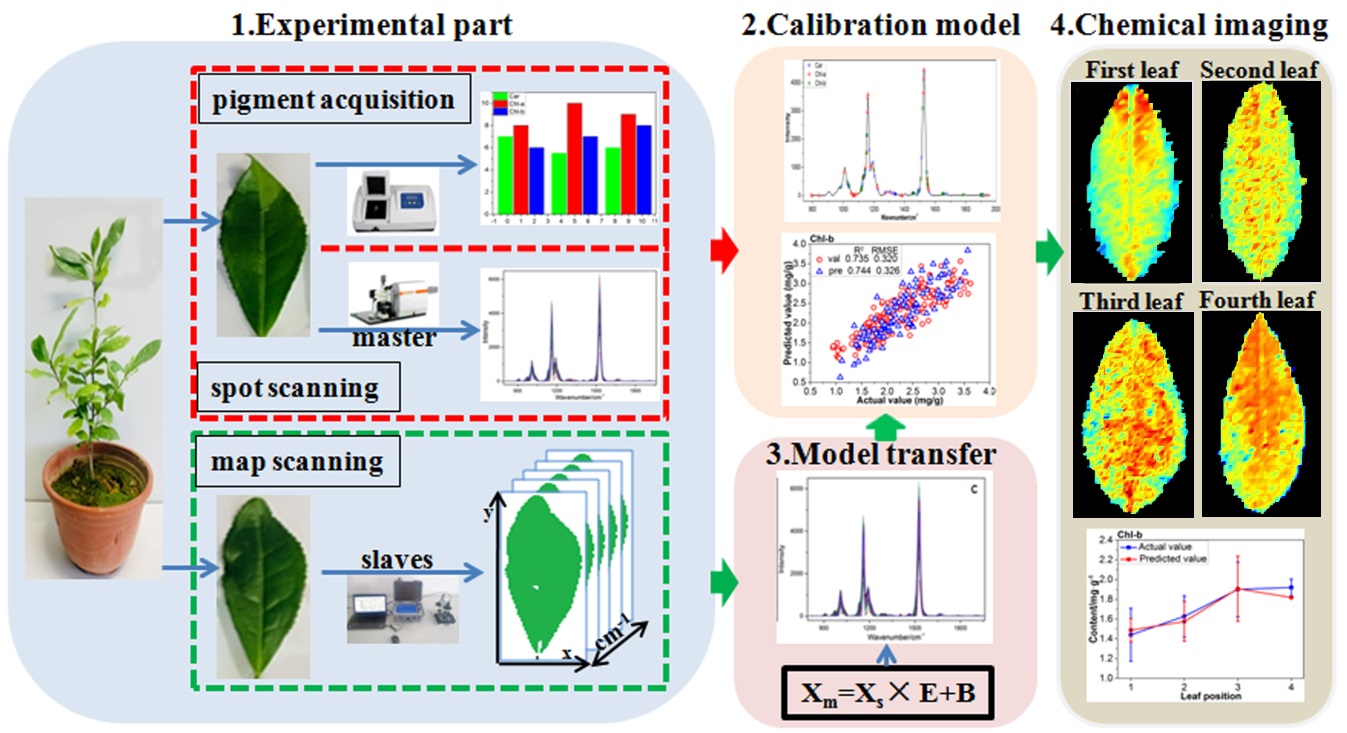
Through the above analysis, the quantitative relationship between photosynthetic pigment concentration in fresh leaves and there’re master Raman spectroscopy had been verified, and the quantitative determination models of chlorophyll and carotenoid concentration based on characteristic wavenumbers had been established. In order to realize the in situ and non-destructive imaging of chlorophyll and carotenoid concentration in fresh leaves of tea, the slave Raman spectra of material 2 after DS were transported into the established model 19, 21, 23, respectively in pixel-wise order, so the photosynthetic pigment concentration of each pixel in tea leaf was predicted. The predicted photosynthetic pigment concentration was imaged, and the image was subjected to filter filtering to obtain distribution maps of photosynthetic pigments as shown in Fig. 5.
By imaging the photosynthetic pigments concentration, it can be found that the pigments concentration in the central vein and margin of the leaf is significantly lower than that in other region, which is related to the maximum efficiency of photosynthesis. These findings are consistent with the results found by [57].
Evaluation of performance of the calibration model transfer
After the map scanning spectra of the slave spectrometer were corrected, the spectrum at each pixel was brought into the quantitative determination model to predict the photosynthetic pigment concentration at that pixel. Then the photosynthetic pigment concentration of the foliar pixels was averaged to represent the pigment concentration of the leaf. Furthermore the predicted average value of pigment concentration was compared with the actual value to evaluate the performance of this calibration model transfer, in detail, the R2 and RMSE were shown in Fig. s2. It can be found that the predicted value of the model for the foliar map scanning spectra is highly correlated with the actual value, which indicates that the pigment determination model based on the master instrument can predict the spectrum of the slave instrument after calibration model transfer. The imaging of foliar pigments results and the correlation analysis proved that the model transfer of the two spectrometers had achieved good results, and this method is feasible. Furthermore, the spectral calibration model constructed in the laboratory (master Raman spectrometer) can be used to measure the distribution of foliar pigment with portable instruments (slave) in the field through model transfer.
It is worth noting that the values obtained for the master instrument correspond to point scanning, and only three spectra are taken from each leaf. Although the spatial resolution of the slave instrument is less than that of the master instrument, the slave spectra are obtained by surface scanning, with hundreds or thousands of spectral lines per leaf, so it more closely corresponds to the chlorophyll in the leaf. In addition, slave spectra become very similar to master spectra through data processing methods such as model transfer.
As for the DS spectral correction method, a subset of samples that represented the entire experimental dataset well was required to measure the difference in the response of spectra measured under different instruments. Also, too few or too many samples in the transfer set can lead to under or over fitting, this implies that the predictive power of the model has not improved in terms of precision. So, further investigation with more samples in the calibration set or exploring another way to optimize the parameters is necessary for reliable use of the proposed method. The better performance of the slave instrument compared to the master instrument in some of the models transferred is consistent with the previous literature [20, 25, 58].
The mean and variance of the actual and predicted value of photosynthetic pigment in four leaves of the same leaf location were calculated, as shown in Fig. 6. As can be seen from the Fig. 6, the trend of the actual value of photosynthetic pigment increase firstly and then decrease, this is consistent with the finding of Vicente et al. [59]. The concentration of pigments at the first leaf position is low due to poor photosynthesis. The level of photosynthetic pigments increases with an increase in leaf position (age) and growing leaves. The photosynthesis rate reaches the highest value when the leaves are mature (third leaf position), and then decreases substantially during senescence due to weakening in the ability of photosynthetic enzyme expression [9]. The result show that the model established in this paper also has a prospect in the study of the leaf position and leaf age.

