This work describes Fe3O4@SiO2 core-shell nanoparticles functionalized with polyvinyl alcohol and its application for the removal of Cu(П) and Cd(П) ions by analytical methods under diverse experimental parameters. Surface chemistry and morphology during functionalization of Fe3O4@SiO2 NPs were monitored using Fourier transform infrared (FT-IR) spectroscopy, X-ray diffraction (XRD), energy dispersive X-ray analysis (EDX), vibration sample magnetometer (VSM), transmission electron microscope (TEM), field emission scanning electron microscope (FE-SEM), dynamic light scattering (DLS). The performance of the polyvinyl alcohol modified magnetic nanoparticles for metal ions removal was evaluated by changing five process variables: contact time of adsorbent, temperature, pH, adsorbent dosage and the selective removal. The adsorption isotherm studies of the novel adsorbent in removing heavy metals from wastewater showed that the maximum absorption amounts of Cu(П) and Cd(П) were 1.57 and 0.99 mmol/g at 35 oC. According to the results, the prepared composites possess excellent adsorption efficiency to be applied for the preconcentration of heavy metal ions in the field of water treatment. The Fe3O4@SiO2-TCT-PVA adsorbent is completely separated from the aqueous solution under external magnetic field for five consecutive cycles without significant loss of activity.
Research Article
Synthesis of magnetic Fe3O4@SiO2 nanoparticles decorated with polyvinyl alcohol for heavy metal ion removal from aqueous solution
https://doi.org/10.21203/rs.3.rs-3236672/v1
This work is licensed under a CC BY 4.0 License
Journal Publication
published 26 Feb, 2024
You are reading this latest preprint version
Fe3O4@SiO2 nanoparticles
polyvinyl alcohol
Removal of heavy metal ions
Adsorption isotherms
Adsorption Kinetics
Magnetic separation
The term ‘‘heavy metal” is a metallic biochemical element that possesses toxicity with a density of more than 5 g/cm3 (Mangalam et al. 2019, Sharma &Agrawal 2005). Generally, the contaminated water with heavy metals threatens ecological system and human health as a result of its non-biodegradability and high level of toxicity (Mahima et al. 2018, Mashhadizadeh &Karami 2011, Nassar 2010, Sharma et al. 2019, Soleimani et al. 2011). The presence of insignificant concentration of metal ions in wastewater and its discharge to groundwater, rivers, etc. leads to the accumulation of metal ions on organisms through the food chain mechanism (Afshar et al. 2015, Aliabadi et al. 2013, Soleimani et al. 2013, Zhong et al. 2007).
Cadmium (Cd) has detrimental effects on teratogenic and carcinogenic by impacting lungs, liver, kidneys and skeletal malformation in living organisms (Ahmedzeki 2013, Comba et al. 2012, Soleimani &Afshar 2014, 2015, Yuan et al. 2015). Moreover, copper cause plant cell death and may damage cell membranes (Fu et al. 2015, Mahmoud et al. 2016, Soleimani &Afshar 2013). Therefore, there is a great interest in the development of novel technique for removal of heavy metal ions from water samples.
Currently, the applied techniques for removing toxic metallic ions from the wastewaters include electrocoagulation membrane filtration, ion exchange, photocatalysts, chemical precipitation, flotation, adsorption, biosorption and etc (Joo et al. 2012, Mohapatra et al. 2019). Among all these methods, adsorption is known as the most efficient process for the elimination of heavy metal ions in terms of high performance and facile approach, simplicity of design, low consumption of reagents and minimal sludge generation which provides a potentially cost-effective technique for removal of toxic heavy metals from water and wastewaters (Duran et al. 2008, Mittal et al. 2015). Recently, various adsorbents have been proposed by applying a carbon materials, chitosan, resins, zeolites, clay minerals and oxides for heavy metal removal from aqueous solution (Tripathi et al. 2014, Xiong et al. 2015). However, most of the conventional adsorbents are found difficult to be separated and recycled from the treated wastewater. This issue limits the practical application of conventional adsorbents in wastewater treatment (Cao et al. 2014). As a result, there is a great impact to find an effective strategy to solve this problem. Application of oxide nanoparticles provide an appropriate tool for magnetic separation techniques of their unique magnetic response (Dindarloo Inaloo et al. 2020a, Rodriguez-Arco et al. 2016).
Among all nanoparticle oxide, Fe3O4 magnetic nanoparticles have been used extensively because of their promising applications in diverse fields. Their unique physical properties such as low toxicity, higher surface area, small size, simple preparation process, high magnetic saturation and the absence of internal diffusion resistance provides more efficient kinetics for metal ion adsorption (Esmaeilpour et al. 2018b, Jeon et al. 2013, Venkateswarlu et al. 2013). However, it should be noticed that magnetic nanoparticles are prone to aggregates due to the high surface energy and strong magnetic dipole–dipole attractions between particles (Zahmatkesh et al. 2016). Furthermore, magnetic nanoparticles are highly susceptible to leach under acidic conditions and susceptible to oxidize under exposed to the atmosphere (Esmaeilpour et al. 2018a, Vayssieres et al. 1998). Therefore, in order to tackle these issues, it is found crucial to combine Fe3O4 nanoparticles with some substances to make them biocompatible, non-toxic, stable in physiological medium (Inaloo et al. 2020, Lu et al. 2007, Zhang et al. 2008).
According to the literatures and previously published paper, silica nanoparticles have been known as one of the most efficient coating layers because of their excellent mechanical stability, no swelling, transparency, dispersion stability, chemical inertness, biocompatibility, potential for surface modification, excellent thermal and non-toxicity (Filpponen et al. 2012, Kazemnejadi et al. 2019, Somaratne et al. 2014).
According to mentioned information, we decided to synthesis Fe3O4@SiO2 nanoparticles decorated with polyvinyl alcohol MNPs as active agent for removing Cu(П) and Cd(П) (Scheme 1). It was eventually investigated the influence of factors affecting the adsorption of Cu(II) and Cd(II) ions such as temperature, contact time, concentration, pH, regeneration and material stability.
2.1. Chemicals and instruments
Chemical materials were provided from Fluka and Merck in analytical grade. IR spectra were performed on a Shimadzu FT-IR 8300 spectrophotometer using KBr pellets and were plotted in cm− 1. X-ray diffraction (XRD) was carried out on a Bruker AXS D8-advance X-ray diffractometer (Cu-Kα radiation, λ = 1.5418 nm) over the range 2θ = 10–100°. The morphological properties of the samples were investigated using a transmission electron microscopy (TEM) with an accelerating voltage of 100 kV (Philips EM208 transmission electron microscope). Field emission scanning electron microscopy (FE-SEM) images were performed using HITACHI S-4160. Dynamic light scattering (DLS) was recorded on a HORIBA-LB550. The elements in the samples were probed by energy-dispersive X-ray (EDX) spectroscopy accessory to the Philips scanning electron microscopy (SEM). Thermogravimetric analysis (TGA) was performed using a Perkin Elmer instrument with a heating rate of 10°C min− 1 under nitrogen atmosphere from room temperature to 800°C. The magnetization curve was recorded on a BHV-55 vibrating sample magnetometer (VSM). Metal Cu(II) and Cd(II) and solutions were prepared by dissolving the metal salt compounds in distilled water. The metal ion concentrations in the solution were analyzed by ICP-OES ((Perkin Elmer) before and after extraction step.
2.2. Synthesis of Fe3O4@SiO2 nanoparticles decorated with polyvinyl alcohol
2.2.1. Preparation of the magnetic Fe3O4 MNPs
Fe3O4 NPs were synthesized according to the previous published literature by chemical coprecipitation of Fe3+ and Fe2+ ions (Esmaeilpour et al. 2018c). Typically, FeCl3·6H2O (1.3 g, 4.8 mmol), FeCl2·4H2O (0.9 g, 4.5 mmol) and polyvinyl alcohol (PVA 15000) (1 g), as a surfactant were dissolved in 30 mL deionized water under N2 atmosphere and vigorous mechanical stirring for 0.5 h at 80 ◦C. Afterwards, hexamethylenetetramine (HMTA) (1.0 mol/L) was slowly added to the solution keeping pH at 10. In the next step, the reaction was heated at 60 oC for 2 h and then allowed to cool to room temperature. Finally, the black precipitate (93% yield) was aggregated by placing an external magnet on the edge of the flask. The obtained precipitated was rinsed with water and ethanol and dried at 80 ◦C for 10 h.
2.2.2. Synthesis of Fe3O4@SiO2 MNPs
The Fe3O4 coated SiO2 NPs were prepared by a similar procedure developed by Sardarian (Esmaeilpour &Javidi 2015). For this purpose, Fe3O4 NPs and tetraethoxysilane (TEOS) (0.20 mL) were added into a flask charged with ethanol (50 mL) and deionized water (5 mL) under violently mechanical stirring. After 10 min, 5.0 mL of NaOH (10 wt%) was added in dropwise. The mixture was kept at room temperature for 30 min under continuous mechanical stirring. Afterwards, the Fe3O4@SiO2 NPs (89% yield) were isolated by an external magnet and washed with ethanol and deionized water three times in ordercto remove unreacted chemicals and finally, the obtained NPs was dried at 80 ◦C for 10 h.
2.2.3. Preparation of Fe3O4@SiO2-Cl NPs
Chloro-functionalized Fe3O4@SiO2 NPs were synthesized using 3-(3-chloropropyl) trimethoxysilane according to the previously published paper (Sardarian et al. 2019). For this purpose, 10 ml of ethanol, 0.7 ml of (3-chloropropyl) trimethoxysilane (4 mmol) and 1.0 g Fe3O4@SiO2 MNPs were added in a flask. The obtained solution was sonicated for 10 min and afterwards the obtained solution was stirred for 12 h under reflux condition. The product precipitates (81% yield) were separated by an external permanent magnet and sequentially washed with water and ethanol, and let it dried overnight at 60°C.
2.2.4. Preparation of Fe3O4@SiO2-N(OH)2 MNPs
In the first step, 0.4 mL of 3-(3‐Hydroxy‐propylamino)‐propan‐1‐ol (3 mmol) and 0.4 mL of triethylamine (3 mmol) was added into the flask and dissolved in 20 ml of DMF. The obtained solution was stirred for 2 h at room temperature. In the next step, 1 g of Fe3O4@SiO2-Cl was added to the reaction mixture. Afterwards, the resulting dispersion was stirred under mechanically stirred continuously for 12 hours at 100°C. Finally, the product (87% yield) was magnetically separated and washed with water and ethanol for three times in order to remove unreacted species and the final product was dried at 70 oC.
2.2.5. Preparation of Fe3O4@SiO2-TCT MNPs
The Fe3O4@SiO2-TCT was performed by adding 1.0 mL of diisopropylethylamine (DIPEA) (6 mmol) and 1.1 g of cyanuric chloride (6 mmol) to 15 mL of THF containing 1g of Fe3O4@SiO2-N(OH)2 nanoparticles. The obtained mixture was stirred mechanically for 16 h at room temperature. The magnetic nanoparticles product (83% yield) was isolated from the solvent by magnetic decantation and repeatedly washed with the deionized water and ethanol. Finally, the obtained magnetic Fe3O4@SiO2-TCT was dried at 70°C for 24 h.
2.2.6. Preparation of FeO@SiO-TCT-PVA MNPs
To prepare of Fe3O4@SiO2-TCT-PVA MNPs, a suspension of 1.0 g of Fe3O4@SiO2-TCT NPs in 10 mL of DMF was added into a solution of PVA (0.75 g, MW = 15,000) in 10 mL of DMF. In the next step, the obtained mixture was stirred at 80 oC for 6 h. Afterwards, the precipitated product (Fe3O4@SiO2-TCT-PVA) was separated magnetically and washed repeatedly with hot ethanol to remove any unanchored species and finally the obtained product (79% yield) was dried at 60 oC for 5 h.
2.3. Adsorption isotherms and kinetic study
In this work, the effect of pH (4.0–8.0), adsorption isotherms (initial concentration of 0.1–0.6 mmol L− 1 for Cu(II) and 0.1–0.6 mmol L− 1 for Cd(II) ions; temperature, 25–45°C), and kinetics time (0–25 min) were explored.
Adsorption isotherms study was carried out in batch mode at the initial concentration of 0.1–0.6 mmol L− 1 at the pH of 7.0. To perform this experiment, 15 mg of the Fe3O4@SiO2-TCT-PVA was added to the individual solutions which mentioned above. In the next step, the suspensions were incubated at 25, 35 and 45 oC for 15 min to reach the equilibrium. Afterward, Fe3O4@SiO2-TCT-PVA was magnetically isolated from the extraction media and the equilibrium concentrations of Cd(II) and Cu(II). Finally, the Cd(II) and Cu(II) ion concentration were quantified using ICP-OES system. The adsorbed amounts of each ion, qe (mmol/g), was calculated using the following Eq. (1):
$${q}_{e}=\frac{V}{W}\left({\text{C}}_{0}-{\text{C}}_{\text{e}}\right)$$
1
Herein, qe represents the adsorbed amount of Cd(II) and Cu(II) in mmol g− 1 unit, V is the aqueous solution volume (L), W represents the Fe3O4@SiO2-TCT-PVA mass (g), Ce and C0 are the final and initial concentrations of target metal ions (mg L− 1), respectively. In this research, the obtained data was fitted to Langmuir and Freundlich isotherms. Equations (2) and (3) represent the linearized form of Langmuir and Freundlich isotherms, respectively (Asgharinezhad &Ebrahimzadeh 2016, Bagheri et al. 2016, Moradi et al. 2019):

As it mentioned below, qmax is the maximum adsorbed amount of the metal ions per grams of the adsorbent and kL is the Langmuir constant. In Eq. (3), qe is the equilibrium adsorbed amount of the metal ions per grams of the Fe3O4@SiO2-TCT-PVA, Ce is the equilibrium concentration of the metal ions, and KF and 1/n are experimental constant values, which affecting the adsorption (Moradi et al. 2019).
The kinetic study of the adsorption for target metal ions in the Fe3O4@SiO2-TCT-PVA active sites was investigated by fitting the experimental data to the Lagergren pseudo first-order and pseudo second-order models (Moradi et al. 2019). This assay was carried out at various time intervals (0–25 min) and 25 oC by using an initial concentration of 0.2 mmol L− 1 for both Cd(II) and Cu(II) ion. As it was explained, the qt (mmol/g) was calculated using the Eq. (4):
$${q}_{t}=\frac{V}{W}\left({\text{C}}_{0}-{\text{C}}_{\text{t}}\right)$$
4
Where Ct (mmol g− 1) represents the concentration of Cd(II) and Cu(II) at time t.
The linear form of the Lagergren pseudo first-order and pseudo second-order kinetic models are exhibited in equations (5) and (6), respectively:
$${Ln ({q}_{e}-q}_{t})=Ln \left({q}_{e}\right)-{K}_{1}\text{t}$$
5
$$\frac{t}{{q}_{t}}=\frac{1}{{K}_{2}{q}_{e}^{2}}+ \frac{t}{{q}_{e}}$$
6
q t (mmol/g) is the adsorption capacity at time t, and K1 and K2 are the rate constants for rate constant for the pseudo first-order (m− 1) and pseudo second-order (g/mmol min) models, respectively.
2.4. Reusability assay
The reusability study of the fabricated nanomaterial was performed in several consecutive adsorption/desorption tests. The adsorption/desorption cycles were performed at 15 min, using 25 mg of the nano sorbent and at the initial concentration of 0.2 mmol L− 1 for both the metal ions. After that, the nanomaterial was magnetically isolated and the supernatant was subjected to ICP-OES. The regeneration study was performed at various concentrations of HCl (0.01-1.0 mol L− 1).
3.1. Characterization study
Figure 1 shows the FT-IR spectra of Fe3O4 (a), Fe3O4@SiO2 (b), Fe3O4@SiO2-Cl (c), Fe3O4@SiO2(OH)2 (d), Fe3O4@SiO2-TCT (e) and Fe3O4@SiO2-TCT-PVA (f) in the range from 500 to 3700 cm− 1. The presence of vibration band at 570 cm− 1, being due to stretching Fe-O demonstrates the presence of Fe3O4(Fig. 1a) (Dindarloo Inaloo et al. 2020c). In the FT-IR spectrum of MNPs, the absorption bands around 3400 cm− 1 is related to the stretching vibrations of hydroxyl group which absorbed by MNPs. Moreover, there is a peak at 1620 cm− 1 is assigned to the hydroxyl bending group (Fig. 1a) (Sardarian et al. 2018). In the spectrum of Fe3O4@SiO2, there is a characteristic absorption bands at 1100 and 850 cm− 1which are attributed to the asymmetric and symmetric stretching of the Si-O-Si group, respectively (Fig. 1b). According to these data, the SiO2 group has been successfully coated on the surface of Fe3O4 MNPs. The IR spectrum of 3-chloromethoxypropylsilane functionalized Fe3O4@SiO2 indicated absorption peaks at 2954, 1444 and 702 cm− 1 related to the vibration of C-H (stretching), CH2 (bending) and C-Cl (stretching) bonds, respectively (Fig. 1c) (Dindarloo Inaloo et al. 2020b). FTIR spectra of Fe3O4@SiO2(OH)2 indicate a new absorption band at 1354 cm− 1 (elimination of the C-Cl peak) for the C-N band (Fig. 1d). The resulted compound reacted with cyanuric chloride to give TCT functionalized Fe3O4@SiO2(OH)2 MNPs. In the FTIR spectrum of Fe3O4@SiO2-TCT, absorption bands at 1512, 1553, and 1724 cm− 1 are attributed to C = N bond and the peaks observe at 2781–2978 and 1481 cm− 1 correspond to the stretching bond of C–H and bending bond of CH2 (Fig. 1e). The peak at 1100 cm− 1 can be assigned to C-Cl stretching of cyanuric chloride which overlaps with the vibrating band of Si-O-Si (stretching) (Fig. 1e). Figure 1f is related to the FT-IR spectrum of Fe3O4@SiO2-TCT-PVA NPs. As it is indicated in the Fig. 1f., the peaks at 2931–2970, 1471, 1085 and 573 cm− 1 are related to C-H (stretching vibration), CH2 (bending), Si-O-Si (asymmetric stretching) and Fe-O (stretching vibration), respectively. On the other hand, the weak peaks at 1724, 1543 and 1512 cm− 1 are due to the vibration mode of C = N in the cyanuric chloride in the adsorbent structure (Fig. 1f). These bands prove the modification of surface of Fe3O4@SiO2 NPs with organic layers.
The investigation of samples structure is performed by using powder X-ray diffraction (XRD) method. As it is observed from the XRD data, the standard Fe3O4 crystal with spinel structure icludes six diffraction peaks at 2θ = 30.1o, 35.4o, 43.1o, 53.4o, 57o and 62.6o which are assigned to the (220), (311), (400), (422), (511), and (440) planes (Fig. 2a). These peaks are indexed to the inverse cubic spinel structure of Fe3O4 (JCPDS card no. 19-0629) (Sardarian et al. 2021), were also observed for Fe3O4@SiO2 and Fe3O4@SiO2-TCT-PVA nanoparticles (Fig. 2b, c). After being coated with SiO2, the intensity of Fe3O4 phase decreased and the phase composition of MNPs remained intact after surface modification on nanoparticles (Fig. 2b, c). Moreover, the broad peak from 2θ = 10-20o is proved an amorphous silica phase in the shell of the silica-coated Fe3O4 nanoparticles. In the structure of Fe3O4@SiO2-TCT-PVA NPs, the broad peak is shifted to lower angles as a result of the synergetic effect of amorphous silica and polyvinyl alcohol polymer (Fig. 2c).
The investigation of the size, shape and morphology of the nanocomposites are carried out using transmission electron microscopy (TEM) and Field emission scanning electron microscopy (FE-SEM) methods (Fig. 3). As it is indicated in Fig. 3a, the Fe3O4 seeds are nearly spherical in shape and average grain size of < 20 nm. Figure 3b,c indicates the FE-SEM images of the Fe3O4@SiO2 and Fe3O4@SiO2-TCT-PVA NPs. Clearly, the Fe3O4@SiO2 are 15–25 nm and spherical, while the later-obtained Fe3O4@SiO2-TCT-PVA NPs are a larger 35–55 nm. Furthermore, the TEM image discloses the nearly spherical shape of the Fe3O4 MNPs in average size of 12 nm. The size and shape of Fe3O4@SiO2-TCT-PVA NPs are in agreement with the values calculated from XRD analysis (Fig. 3d).
Furthermore, Fig. 3e and f indicates the TEM images of Fe3O4@SiO2 and Fe3O4@SiO2-TCT-PVA. The results prove the spherically shaped of Nps which is proved the formation of uniformly distributed nanosized particles with an average diameter of 20 and 45 nm, respectively. In order to extend the characterization of the adsorbent, DLS analysis of MNPs was performed. Figure 3g-i shows the size distributions of Fe3O4, Fe3O4@SiO2 and Fe3O4@SiO2-TCT-PVA which is in the range of 8–16 nm, 16–24 nm and 38–52 nm, respectively.
The thermal stability of the Fe3O4@SiO2-TCT-PVA nanoparticles are explored via TGA assay (Fig. 4A). As illustrated in Fig. 4A, two weight loss steps is observable in the TGA plot. The first step occurs between the temperatures of 100 and 200 oC and it is related to the evaporation of residual organic solvent, adsorbed water molecules and loss of surface hydroxyl moieties of the nano adsorbent. The second weigh loss appears after 200°C, which is correspond to the elimination of organic part which is supported on the Fe3O4@SiO2 NPs. The TGA curves of the Fe3O4@SiO2, Fe3O4@SiO2-Cl, Fe3O4@SiO2-TCT and Fe3O4@SiO2-TCT-PVA NPs are illustrated in Fig. 4A with the weight losses of 12.1%, 24.3%, and 52.7%, respectively in the range of 150–700 oC.
Energy dispersive X-ray spectroscopy (EDX) prove powerful tool for accomplishing the elemental analysis of various samples. The EDX spectrum of Fe3O4@SiO2-TCT-PVA indicates all predicted elements in the adsorbent structure, such as carbon, nitrogen, oxygen, silicon and iron as indicated in Fig. 4B. The magnetic properties of nanoparticles are evaluated at room temperature using VSM in an external magnetic field within the range of -6 kOe to + 6 kOe. As it is observed from Fig. 4C, the Fe3O4 and Fe3O4@SiO2-TCT-PVA possess magnetization saturation values of 64.8 and 25.9 emu g− 1, respectively (Fig. 4Ca,b). Neither remanence nor coercivity is observed which is proved that these particles are superparamagnetic.The immobilizing of magnetite nanoparticles resulted in the decrease in the magnetic strength of the composite on account of the weight contribution from the nonmagnetic portion (Fig. 4Cb). As it is observed from these datasets, the magnetization saturation value of Fe3O4@SiO2-TCT-PVA in compared with Fe3O4 is lower due to the grafting of organic compounds. However, the Fe3O4@SiO2-TCT-PVA structure still indicates strong magnetization which is provided an easy and efficient route to separate nanoparticles from a suspension system under an external magnetic field. The magnetic separation is quickly fulfilled by supplying an external magnetic field. Moreover, there is a possibility to re-disperse nanoparticles quickly with a slight shake once the magnetic field is removed. (Fig. 4D)
3.2. Selection of materials
The adsorbent type plays a crucial role on the removal efficiency of metal ions. Accordingly, Fe3O4@SiO2 core-shell nanoparticles functionalized with polyvinyl alcohol was utilized for the removal of Cu(П) and Cd(П) to benefit from the excellent magnetic property of magnetite NPs as well as high adsorption capability of polyvinyl alcohol. To protect the Fe3O4 NPs in strong acidic medium, which is need for desorption of target metal ions, the surface of the Fe3O4 NPs was functionalized with the TEOS as silanizing agent. It is worth noting that silica layer (SiO2) is stable in acidic strong media. After that, the surface of Fe3O4@SiO2 core-shell nanoparticles was functionalized with polyvinyl alcohol, which has oxygen donor atoms and can enhance the adsorption capacity of the sorbent towards the target ions, as well as improve the dispersibility of the adsorbent in the aquatic extraction medium.
3.3. Optimization
3.3.1. Effect of nano-adsorbent amount
The adsorbent amount exhibits a profound effect on the metal adsorption (Ebrahimzadeh et al. 2012). In this way, various amounts of the nano-adsorbent (2.5–20 mg) were added to 50 mL of the target metal solutions. As Fig. 5a illustrates, Fe3O4@SiO2-TCT-PVA exhibits a positive effect in the adsorption% of Cu(II) and Cd(II) ions up to 15 mg and at the higher dosages (> 15 mg) more improvement was not observed in the adsorption efficiency. Accordingly, 15 mg of Fe3O4@SiO2-TCT-PVA MNPs in 50 mL sample solution was selected as the optimum nano-adsorbent dose.
3.3.2. Effect of pH
The pH as an important variable affects the adsorption efficiency of metal ions strongly. Accordingly, the pH of sample solution was varied within the range of 4 to 8, and the best adsorption performance was observed at pH 7 (Fig. 5b). At the low pH values, the active sites of Fe3O4@SiO2-TCT-PVA MNPs are protonated mostly as a result, protonated sites are not able to coordinate to Cu(II) and Cd(II) ions owing to the electrostatic repulsion between the positive moieties of the Fe3O4@SiO2-TCT-PVA nano-sorbent and the target ions (Jalilian et al. 2017).
3.3.3. Effect of the initial concentration of metal ions
The effect of initial concentration of Cu(II) and Cd(II) in the range of 0.1–0.6 mmol/L is evaluated on the adsorption percentage. For this purpose, the experiments were carried out by adding 15 mg of the nano-adsorbent to 50 mL solutions at pH 7.0 with a contact time of 25 min. According to the Fig. 5c, the highest removal efficiency was obtained at the concentration of 0.5 mmol/L, and 0.4 mmol/L, for Cu(II) and Cd(II), respectively. The improvement in the efficiency of adsorption are explained by the increase of mass gradient in between the metal solutions and Fe3O4@SiO2-TCT-PVA nano-sorbent as the initial metal concentration increases (Soni et al. 2020).
3.3.4. Effect of adsorption time
Effect of adsorption time was investigated within the range of 5 to 30 min. for this purpose, 15 mg of the nano-adsorbent were added to 50 mL sample solution at pH 7.0 with an initial concentration of 0.5 mmol/L, and 0.4 mmol/L, for Cu(II) and Cd(II), respectively. As it is indicated inn Fig. 5d, the optimum adsorption percentage was observed at the time of 20 and 25 min, for Cd(II), and Cu(II) ions, respectively. As Fig. 5d illustrates, the adsorption efficiency increases with increasing the contact time. The obtained curve exhibits a rapid adsorption rate at the first step due to the unoccupied active sites of the adsorbent and then slows down owing to the occupation of the active site of the nano-adsorbent by the metal ions (Soni et al. 2020).
3.4. Adsorption isotherms
Adsorption isotherms of target ions in the range of 25–45 oC are exhibited in Fig. 6a-b. As shown in the figure, the equilibrium adsorption capacity (qe) increases up to 35 oC. The adsorption data were fitted to the linear form of Langmuir and Freundlich models. Table 1 summarizes the Langmuir and Freundlich adsorption data. The obtained correlation coefficients approve that the adsorption process obey from the Langmuir isotherm rather than the Freundlich isotherm.
The calculated qm at 25 oC is 0.84, and 1.48 mmol/g for Cd(II), and Cu(II), respectively. The maximum adsorbed amount of the target ions increased from 1.48 mmol/g to 1.57 mmol/g, and 0.84 mmol/g to 0.99 mmol/g by increasing the temperature from 25 oC to 35 oC for Cu(II), and Cd(II), respectively. The high temperature result in extend the pore volume and surface area of the nano-adsorbent. This phenomena provides more possibility for metal ions to pass through the external boundary layer which leads to penetrate it more easily (Esmaeilpour et al. 2022). Moreover, the increase of extraction temperature improves the mass transfer of the target ions to the active sites of Fe3O4@SiO2-TCT-PVA MNPs. Furthermore, the increase of extraction temperature accelerates the complex formation between the heteroatoms and metal ions. The decrease of the adsorption after 35 oC can be attributed to the exothermic nature of adsorption process. Therefore, the adsorption order of the target ions is as follows: Cu(II) > Cd(II).
|
Temperature (oC) |
Metal ion |
Langmuir model |
Freundlich model |
||||
|
qm (mmol/g) |
KL (L/mmol) |
r |
n |
KF (mmol/g) |
r |
||
|
25 |
Cu(II) |
1.48 |
2246 |
0.9999 |
13.3 |
1.72 |
0.6474 |
|
Cd(II) |
0.84 |
182 |
0.9983 |
6.0 |
1.14 |
0.6253 |
|
|
35 |
Cu(II) |
1.57 |
7937 |
0.9999 |
14.5 |
1.23 |
0.5179 |
|
Cd(II) |
0.99 |
633 |
0.9998 |
7.6 |
1.28 |
0.7847 |
|
|
45 |
Cu(II) |
1.37 |
1457 |
0.9998 |
12.5 |
1.60 |
0.5405 |
|
Cd(II) |
0.89 |
796 |
0.9997 |
7.4 |
1.20 |
0.7179 |
|
3.4. Adsorption kinetic
The kinetic study of the adsorption for target metal ions in the Fe3O4@SiO2-TCT-PVA active sites was explored by fitting the experimental data to the Lagergren pseudo first-order and pseudo second-order model (Table 2). The assay was performed at various time intervals (0–25 min) and 35 oC using an initial concentration of 0.2 mmol L− 1 for both the metal ions. Table 2 depicts the rate constant values and correlation coefficients (r) from the assays and also the counterpart values of calculated from the mentioned models. The values computed from the pseudo second-order model are closer to the experimental data in compared with the values of pseudo first-order model. Moreover, the pseudo-second order kinetic model indicates a very high value of “r” for all kinetic data. These observations confirm that the adsorption kinetic obey from the pseudo second-order process. The pseudo second-order model occur in three steps including: 1) surface adsorption, 2) external liquid film diffusion, and 3) intra-particle diffusion.
|
Ion |
Experiment |
Pseudo first-order model |
Pseudo second-order model |
||||
|---|---|---|---|---|---|---|---|
|
qe (mmol/g) |
qe (mmol/g) |
k1 (min− 1) |
r |
qe (mmol/g) |
k2 (g/mmol.min) |
r |
|
|
Cu(II) |
1.44 |
0.2399 |
0.2006 |
0.9802 |
1.4497 |
4.0154 |
0.9992 |
|
Cd(II) |
0.93 |
0.4291 |
0.0998 |
0.9743 |
0.9332 |
0.7406 |
0.9976 |
3.5. Durability and stability assays
The regeneration of a nano-adsorbent is one of the vital keys for its commercial applications. The main route for desorption of heavy metal ions from active sites of adsorbents is its elution with HCl solutions in the range of 0.01-1.0 mol/L. To evaluate the stability of nano-adsorbent in the acidic solution before the regeneration process, Fe3O4@SiO2-TCT-PVA MNPs was treated in acidic conditions and the leaching content of iron ions was evaluated (Table 3).
|
HCl solution concentration (M) |
Leached Fe content (%) |
||
|---|---|---|---|
|
Fe3O4 |
Fe3O4@SiO2 |
Fe3O4@SiO2-TCT-PVA |
|
|
0.01 |
1.79 |
0.28 |
0.09 |
|
0.05 |
4.67 |
0.52 |
0.17 |
|
0.1 |
13.78 |
1.15 |
0.35 |
|
0.5 |
84.35 |
3.13 |
0.70 |
|
1.0 |
94.54 |
4.89 |
1.01 |
As depicted in Table 3, the leaching percentage for Fe3O4, and Fe3O4@SiO2, is 94.54% and 4.89% Fe, respectively, after suspending the material in 1.0 mol/L HCl solution for 24 h. This value is 1.01% for the Fe3O4@SiO2-TCT-PVA nanomaterials that affirms its high stability under the harsh acidic conditions (Table 3). Accordingly, 1.0 mol/L HCl solution was employed for desorption of Cu(П), and Cd(П), ions, and the results are illustrated in Fig. 7a. As Fig. 7a depicts, a small loss in the adsorption efficiency is observable after five consecutive adsorption-desorption cycles, which confirms the good performance and recyclability of the Fe3O4@SiO2-TCT-PVA nanomaterials. Figure 7b illustrates the FESEM micrograph of Fe3O4@SiO2-TCT-PVA nanomaterials after 5 adsorption-desorption assays and clarifies no remarkable change in the morphology of functionalized MNPs, though, a bit aggregation is unavoidable. In addition, DLS measurements were carried out to measure the particles size after performing the 5 adsorption-desorption assays. Figure 7c exhibits that this size distribution is centered at a value of 70 nm. These observations exhibit the excellent chemical stability and recyclability of the fabricated nanomaterial.
In this research, the Fe3O4@SiO2-TCT-PVA composites are synthesized and applied in the adsorption process of metal ions in aquatic system. The as-prepared multifunctional Fe3O4@SiO2 nanostructures shows excellent abilities to remove Cu(П), and Cd(П) with easy magnetic separation property. Moreover, it is found that the adsorption process is strongly dependent on pH parameters. According to the calculated parameters and fitting model, the kinetics adsorption data are well fitted to the pseudo-second-order kinetic model which suggests that the main rate determining step was chemisorption’s. The adsorption equilibrium is well explained by Langmuir adsorption isotherms which namely monolayer adsorption. It is proved in the desorption study that there is possibility to recycle a single dose of adsorbent for five consecutive cycles of adsorption and desorption. Therefore, these results combined with the eco-friendly nature and reusability which prove that the presented magnetic adsorbents are an effective and viable alternate to traditional micro-sized adsorbents.
Acknowledgments
The authors thank the Niroo Research Institute (NRI) and the Estahban Payam Noor University for supporting this research.
-Ethical Approval
Reply: There is not any experiment which involves human precipitants.
-Consent to Participate
Reply: All authors are informed about the submission of this research.
-Consent to Publish
Reply: The authors give the permission to the publisher to publish this research.
-Authors Contributions
Reply:
Ali Akbar Asgharinezhad: Conceptualization, Software, Formal analysis, Data curation, Writing-Original draft preparation, Reviewing and Editing, Visualization, Investigation.
Mohsen Esmaeilpour: Supervision, Conceptualization, Methodology, Formal analysis, Data curation, Writing-Reviewing and Editing, Visualization, Investigation.
Majid Ghahraman Afshar: Conceptualization, Methodology, Formal analysis, Validation, Investigation, Reviewing and Editing.
-Funding
Reply: Niroo Research Institute (NRI) support the project fanatically.
-Competing Interests
Reply: There is not any competing interest in all manuscript.
- Afshar MG, Crespo GA, Bakker E (2015): Thin‐Layer Chemical Modulations by a Combined Selective Proton Pump and pH Probe for Direct Alkalinity Detection. Angew. Chem., Int. Ed. 127, 8228-8231
- Ahmedzeki NS (2013): Adsorption filtration technology using iron-coated sand for the removal of lead and cadmium ions from aquatic solutions. Desalination Water Treat. 51, 5559-5565
- Aliabadi M, Irani M, Ismaeili J, Piri H, Parnian MJ (2013): Electrospun nanofiber membrane of PEO/Chitosan for the adsorption of nickel, cadmium, lead and copper ions from aqueous solution. J. Chem. Eng. 220, 237-243
- Asgharinezhad AA, Ebrahimzadeh H (2016): Poly (2-aminobenzothiazole)-coated graphene oxide/magnetite nanoparticles composite as an efficient sorbent for determination of non-steroidal anti-inflammatory drugs in urine sample. J. Chromatogr. A 1435, 18-29
- Bagheri H, Molaei K, Asgharinezhad AA, Ebrahimzadeh H, Shamsipur M (2016): Magnetic molecularly imprinted composite for the selective solid‐phase extraction of p‐aminosalicylic acid followed by high‐performance liquid chromatography with ultraviolet detection. J. Sep. Sci 39, 4166-4174
- Cao J, Li J, Liu L, Xie A, Li S, Qiu L, Yuan Y, Shen Y (2014): One-pot synthesis of novel Fe 3 O 4/Cu 2 O/PANI nanocomposites as absorbents in water treatment. J. Mater. Chem. A. 2, 7953-7959
- Comba S, Martin M, Marchisio D, Sethi R, Barberis E (2012): Reduction of nitrate and ammonium adsorption using microscale iron particles and zeolitite. Water Air Soil Pollut. 223, 1079-1089
- Dindarloo Inaloo I, Esmaeilpour M, Majnooni S, Reza Oveisi A (2020a): Nickel‐Catalyzed Synthesis of N‐(Hetero) Aryl Carbamates from Cyanate Salts and Phenols Activated with Cyanuric Chloride. ChemCatChem 12, 5486-5491
- Dindarloo Inaloo I, Majnooni S, Eslahi H, Esmaeilpour M (2020b): Nickel (II) nanoparticles immobilized on EDTA-modified Fe3O4@ SiO2 nanospheres as efficient and recyclable catalysts for ligand-free Suzuki–Miyaura coupling of aryl carbamates and sulfamates. ACS Omega 5, 7406-7417
- Dindarloo Inaloo I, Majnooni S, Eslahi H, Esmaeilpour M (2020c): Air‐Stable Fe3O4@ SiO2‐EDTA‐Ni (0) as an Efficient Recyclable Magnetic Nanocatalyst for Effective Suzuki‐Miyaura and Heck Cross‐Coupling via Aryl Sulfamates and Carbamates. Appl. Organomet. Chem. 34, e5662
- Duran A, Soylak M, Tuncel SA (2008): Poly (vinyl pyridine-poly ethylene glycol methacrylate-ethylene glycol dimethacrylate) beads for heavy metal removal. J. Hazard. Mater. 155, 114-120
- Ebrahimzadeh H, Asgharinezhad AA, Tavassoli N, Sadeghi O, Amini MM, Kamarei F (2012): Separation and spectrophotometric determination of very low levels of Cr (VI) in water samples by novel pyridine-functionalized mesoporous silica. Int. J. Environ. Anal. Chem. 92, 509-521
- Esmaeilpour M, Javidi J (2015): Fe3O4@ SiO2‐imid‐PMAn Magnetic Porous Nanosphere as Reusable Catalyst for Synthesis of Polysubstituted Quinolines under Solvent‐free Conditions. J. Chin. Chem. Soc. 62, 328-334
- Esmaeilpour M, Sardarian AR, Firouzabadi H (2018a): N-heterocyclic carbene-Pd (II) complex based on theophylline supported on Fe3O4@ SiO2 nanoparticles: highly active, durable and magnetically separable catalyst for green Suzuki-Miyaura and Sonogashira-Hagihara coupling reactions. J. Organomet. Chem. 873, 22-34
- Esmaeilpour M, Sardarian AR, Firouzabadi H (2018b): Theophylline supported on modified silica‐coated magnetite nanoparticles as a novel, efficient, reusable catalyst in green one‐Pot synthesis of spirooxindoles and phenazines. ChemistrySelect 3, 9236-9248
- Esmaeilpour M, Zahmatkesh S, Fahimi N, Nosratabadi M (2018c): Palladium nanoparticles immobilized on EDTA‐modified Fe3O4@ SiO2 nanospheres as an efficient and magnetically separable catalyst for Suzuki and Sonogashira cross‐coupling reactions. Appl. Organomet. Chem. 32, e4302
- Esmaeilpour M, Larimi A, Asgharinezhad A, Ghahramanafshar M, Faghihi M (2022): Silica nanoparticles extracted from rice husk and functionalized with dendrimer as an effective recyclable adsorbent to remove divalent cadmium from aqueous solutions. J. Appl. Polym. 6, 63-76
- Filpponen I, Kontturi E, Nummelin S, Rosilo H, Kolehmainen E, Ikkala O, Laine J (2012): Generic method for modular surface modification of cellulosic materials in aqueous medium by sequential “click” reaction and adsorption. Biomacromolecules 13, 736-742
- Fu L, Liu F, Ma Y, Tao X, Ling C, Li A, Shuang C, Li Y (2015): High-efficient technique to simultaneous removal of Cu (II), Ni (II) and tannic acid with magnetic resins: Complex mechanism behind integrative application. J. Chem. Eng. 263, 83-91
- Inaloo ID, Majnooni S, Eslahi H, Esmaeilpour M (2020): Efficient nickel (II) immobilized on EDTA‐modified Fe3O4@ SiO2 nanospheres as a novel nanocatalyst for amination of heteroaryl carbamates and sulfamates through the cleavage of CO bond. Mol. Catal. 492, 110915
- Jalilian N, Ebrahimzadeh H, Asgharinezhad AA, Molaei K (2017): Extraction and determination of trace amounts of gold (III), palladium (II), platinum (II) and silver (I) with the aid of a magnetic nanosorbent made from Fe 3 O 4-decorated and silica-coated graphene oxide modified with a polypyrrole-polythiophene copolymer. Microchim. Acta 184, 2191-2200
- Jeon Y, Thangadurai DT, Piao L, Yoon S (2013): A facile one-step method to prepare size controlled Fe3O4 submicro/nanoparticles. Mater. Lett. 96, 27-30
- Joo S-H, Kim Y-U, Kang J-G, Kumar JR, Yoon H-S, Shin SM (2012): Recovery of rhenium and molybdenum from molybdenite roasting dust leaching solution by ion exchange resins. Mater. Trans. 53, 2034-2037
- Kazemnejadi M, Alavi SA, Rezazadeh Z, Nasseri MA, Allahresani A, Esmaeilpour M (2019): Fe3O4@ SiO2@ Im [Cl] Mn (III)-complex as a highly efficient magnetically recoverable nanocatalyst for selective oxidation of alcohol to imine and oxime. J. Mol. Struct. 1186, 230-249
- Lu AH, Salabas EeL, Schüth F (2007): Magnetic nanoparticles: synthesis, protection, functionalization, and application. Angew. Chem., Int. Ed. 46, 1222-1244
- Mahima S, Kannikka B, Subhasha N, Moniska J (2018): TiO2-GO Nanocomposite for Energy and Environmental Applications: A green Syntheis Approach. Vacuum. 156, 434-439
- Mahmoud ME, Amira MF, Zaghloul AA, Ibrahim GA (2016): Microwave-enforced sorption of heavy metals from aqueous solutions on the surface of magnetic iron oxide-functionalized-3-aminopropyltriethoxysilane. J. Chem. Eng. 293, 200-206
- Mangalam J, Kumar M, Sharma M, Joshi M (2019): High adsorptivity and visible light assisted photocatalytic activity of silver/reduced graphene oxide (Ag/rGO) nanocomposite for wastewater treatment. Nano-Struct. Nano-Obj. 17, 58-66
- Mashhadizadeh MH, Karami Z (2011): Solid phase extraction of trace amounts of Ag, Cd, Cu, and Zn in environmental samples using magnetic nanoparticles coated by 3-(trimethoxysilyl)-1-propantiol and modified with 2-amino-5-mercapto-1, 3, 4-thiadiazole and their determination by ICP-OES. J. Hazard. Mater. 190, 1023-1029
- Mittal H, Maity A, Ray SS (2015): Effective removal of cationic dyes from aqueous solution using gum ghatti-based biodegradable hydrogel. Int. J. Biol. Macromol. 79, 8-20
- Mohapatra RK, Parhi PK, Pandey S, Bindhani BK, Thatoi H, Panda CR (2019): Active and passive biosorption of Pb (II) using live and dead biomass of marine bacterium Bacillus xiamenensis PbRPSD202: Kinetics and isotherm studies. J. Environ. Manage. 247, 121-134
- Moradi E, Ebrahimzadeh H, Mehrani Z, Asgharinezhad AA (2019): The efficient removal of methylene blue from water samples using three-dimensional poly (vinyl alcohol)/starch nanofiber membrane as a green nanosorbent. Environ. Sci. Pollut. Res. 26, 35071-35081
- Nassar NN (2010): Rapid removal and recovery of Pb (II) from wastewater by magnetic nanoadsorbents. J. Hazard. Mater. 184, 538-546
- Rodriguez-Arco L, Rodriguez IA, Carriel V, Bonhome-Espinosa AB, Campos F, Kuzhir P, Duran JD, Lopez-Lopez MT (2016): Biocompatible magnetic core–shell nanocomposites for engineered magnetic tissues. Nanoscale 8, 8138-8150
- Sardarian A, Kazemnejadi M, Esmaeilpour M (2021): Functionalization of superparamagnetic Fe3O4@ SiO2 nanoparticles with a Cu (II) binuclear Schiff base complex as an efficient and reusable nanomagnetic catalyst for N‐arylation of α‐amino acids and nitrogen‐containing heterocycles with aryl halides. Appl. Organomet. Chem. 35, e6051
- Sardarian AR, Eslahi H, Esmaeilpour M (2018): Copper (II) complex supported on Fe3O4@ SiO2 coated by polyvinyl alcohol as reusable nanocatalyst in N‐arylation of amines and N (H)‐heterocycles and green synthesis of 1H‐tetrazoles. ChemistrySelect 3, 1499-1511
- Sardarian AR, Eslahi H, Esmaeilpour M (2019): Green, cost‐effective and efficient procedure for Heck and Sonogashira coupling reactions using palladium nanoparticles supported on functionalized Fe3O4@ SiO2 by polyvinyl alcohol as a highly active, durable and reusable catalyst. Appl. Organomet. Chem. 33, e4856
- Sharma M, Joshi M, Nigam S, Shree S, Avasthi DK, Adelung R, Srivastava SK, Mishra YK (2019): ZnO tetrapods and activated carbon based hybrid composite: Adsorbents for enhanced decontamination of hexavalent chromium from aqueous solution. J. Chem. Eng. 358, 540-551
- Sharma RK, Agrawal M (2005): Biological effects of heavy metals: an overview. J. Environ. Biol. 26, 301-313
- Soleimani M, Mahmodi MS, Morsali A, Khani A, Afshar MG (2011): Using a new ligand for solid phase extraction of mercury. J. Hazard. Mater. 189, 371-376
- Soleimani M, Afshar MG (2013): Potentiometric sensor for trace level analysis of copper based on carbon paste electrode modified with multi-walled carbon nanotubes. Int. J. Electrochem. Sci 8, 8719-8729
- Soleimani M, Ghahraman Afshar M, Sedghi A (2013): Amino-functionalization of multiwall carbon nanotubes and its use for solid phase extraction of mercury ions from fish sample. Int. Sch. Res. Notices 2013
- Soleimani M, Afshar MG (2014): Octaethylporphyrin as an ionophore for aluminum potentiometric sensor based on carbon paste electrode. Russ. J. Electrochem. 50, 554-560
- Soleimani M, Afshar MG (2015): Highly selective solid phase extraction of mercury ion based on novel ion imprinted polymer and its application to water and fish samples. J. Anal. Chem. 70, 5-12
- Somaratne M, Liyanage N, Walpalage S (2014): Surface modification of silica with a hydrophilic polymer and its influence on reinforcement of natural rubber latex. J. Natl. Sci. Found. 42
- Soni S, Bajpai P, Mittal J, Arora C (2020): Utilisation of cobalt doped Iron based MOF for enhanced removal and recovery of methylene blue dye from waste water. J. Mol. Liq. 314, 113642
- Tripathi PK, Liu M, Zhao Y, Ma X, Gan L, Noonan O, Yu C (2014): Enlargement of uniform micropores in hierarchically ordered micro–mesoporous carbon for high level decontamination of bisphenol A. J. Mater. Chem. A. 2, 8534-8544
- Vayssieres L, Chanéac C, Tronc E, Jolivet JP (1998): Size tailoring of magnetite particles formed by aqueous precipitation: an example of thermodynamic stability of nanometric oxide particles. J. Colloid Interface Sci. 205, 205-212
- Venkateswarlu S, Rao YS, Balaji T, Prathima B, Jyothi N (2013): Biogenic synthesis of Fe3O4 magnetic nanoparticles using plantain peel extract. Mater. Lett. 100, 241-244
- Xiong Y, Ye F, Zhang C, Shen S, Su L, Zhao S (2015): Synthesis of magnetic porous γ-Fe 2 O 3/C@ HKUST-1 composites for efficient removal of dyes and heavy metal ions from aqueous solution. RSC Adv. 5, 5164-5172
- Yuan D, Anthis AH, Ghahraman Afshar M, Pankratova N, Cuartero M, Crespo GA, Bakker E (2015): All-solid-state potentiometric sensors with a multiwalled carbon nanotube inner transducing layer for anion detection in environmental samples. Anal. Chem. 87, 8640-8645
- Zahmatkesh S, Esmaeilpour M, Javidi J (2016): 1, 4-Dihydroxyanthraquinone–copper (II) supported on superparamagnetic Fe 3 O 4@ SiO 2: An efficient catalyst for N-arylation of nitrogen heterocycles and alkylamines with aryl halides and click synthesis of 1-aryl-1, 2, 3-triazole derivatives. RSC Adv. 6, 90154-90164
- Zhang H, Zhong X, Xu J-J, Chen H-Y (2008): Fe3O4/polypyrrole/Au nanocomposites with core/shell/shell structure: synthesis, characterization, and their electrochemical properties. Langmuir 24, 13748-13752
- Zhong L-S, Hu J-S, Cao A-M, Liu Q, Song W-G, Wan L-J (2007): 3D flowerlike ceria micro/nanocomposite structure and its application for water treatment and CO removal. Chem. Mater. 19, 1648-1655
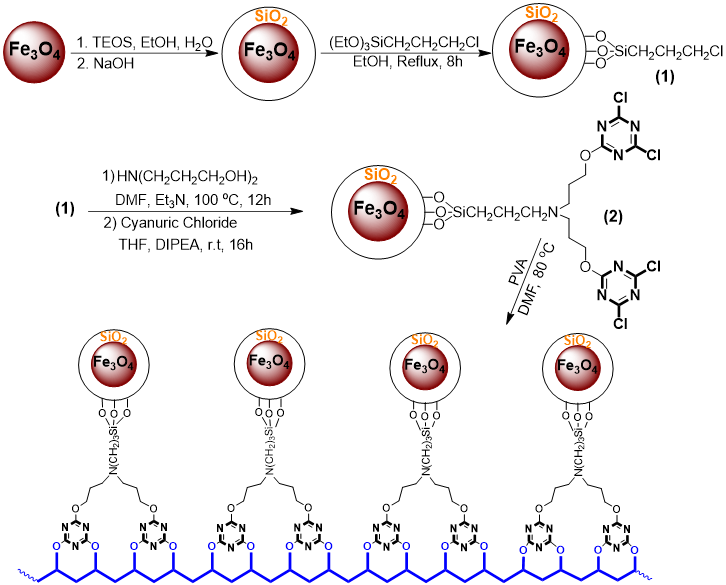
Scheme 1 is available in the Supplementary Files section.
- scheme1.png
Scheme 1. Schematic of synthesis steps to fabricate polyvinyl alcohol immobilized on cyanuric chloride-modified Fe3O4@SiO2 NPs.