3.1 Characterization of the adsorbent
SEM was used to observe the morphologies of SBC, CSBC, Al/Y-CSBC, and the spent adsorbent (referred to as F-Al/Y-CSBC). Figure 1 displays the findings. The SEM images illustrated that the surface of SBC was smooth and had an irregular sheet-like structure, which was destroyed by potassium acetate activation, while the surface of CSBC was rough. The modified Al/Y-CSBC had a massive surface with a significant amount of granular material attached, whereas the surface morphology of both adsorbed F-Al/Y-CSBC and Al/Y-CSBC was found to be similar. EDS was used to show the distribution of surface elements of Al/Y-CSBC and F-Al/Y-CSBC. Figure 2a demonstrated that the surface components of Al/Y-CSBC were predominantly O, C, Al, and Y. Figure 2a demonstrates the successful loading and uniform distribution of Al and Y. The presence of F elements with a uniform distribution on the F-Al/Y-CSBC surface during adsorption indicated that fluoride was successfully adsorbed, and the other surface element species were comparable to Al/Y-CSBC, as illustrated in Fig. 2b.
Figure 3 illustrates the surface characteristics of SBC, CSBC, and Al/Y-CSBC, while Table 1 presents the corresponding parameters. The N2 adsorption-desorption curves of all samples followed type-IV isotherms, exhibiting hysteresis loops that were caused by capillary condensation. This indicated the presence of a mesoporous structure ranging from 2 to 50 nm (Cui et al. 2018; Huang et al. 2020). Specifically, SBC had an H3-type hysteresis loop, and its isotherms rose sharply between 0.8 and 1, indicating the presence of macropores (> 50 nm) likely due to particle accumulation and agglomeration (Wei et al. 2019). On the other hand, the type-IV pattern with the H3 and H1-type hysteresis loops combination under moderate relative pressure (P/P0 = 0.4 ~ 0.9) exhibited slit-shaped pores and confirming their mesoporous nature for both CSBC and Al/Y-CSBC. The pore size distribution depicted in Fig. 3 highlighted the mesoporous structure of CSBC and Al/Y-CSBC, as compared to the mesopores and macropores structure observed in SBC.
According to the data presented in Table 1, SBC had a BET surface area of 25.92 m2·g− 1, while CSBC and Al/Y-CSBC had significantly higher values of 69.78 m2·g− 1 and 110.15 m2·g− 1, respectively. The rise in specific surface area can be attributed to the activation-induced decomposition of potassium acetate and the significant dissolution of CaCO3 through metallic modification with introduced acid. These processes helped to crack the biochar lamellae and expose more mesopores, thus contributing to the enhanced BET surface area observed in both CSBC and Al/Y-CSBC.
Table 1
BET analysis result of samples
| Sample | BET(m2·g− 1) | Pore Volume(cm3·g− 1) | Pore Size(nm) |
| SBC | 25.59 | 0.114 | 13.454 |
| CSBC | 69.78 | 0.144 | 11.395 |
| Al/Y-CSBC | 110.15 | 0.165 | 7.058 |
Figure 4a shows the XRD patterns collected, with the diffraction peaks at 20.8°, 26.6°, and 50.1° attributed to reflections of SiO2 in the SBC, CSBC, and Al/Y-CSBC samples. Intense and strong peaks at 2θ of 29.4°, 35.9°, 39.4°, 43.1°, 47.7° and 48.4° observed in SBC and CSBC could belong to reflections of CaCO3. After modification with Al-Y bimetals, the diffraction peak of CaCO3 disappeared, and the diffraction peak of SiO2 was diminished in both Al/Y-CSBC and F-Al/Y-CSBC. This leaded to a rise in specific surface area and a decrease in pore diameter. Additionally, the appearance of the crystalline phase of Fe3O4 was observed in both Al/Y-CSBC and F-Al/Y-CSBC. These findings suggest that the modification process loaded the metals mostly in amorphous form onto the surface of the sludge biochar.
In Fig. 4b, the FTIR spectra of SBC, CSBC, Al/Y-CSBC, and F-Al/Y-CSBC were analyzed and presented. The broad bands observed around 3400 cm− 1 were identified as the –OH vibrations, while the bands about 998 cm− 1 were assigned to the deformation vibrations of C–O (Min et al. 2022). The band at 1403 and 872 cm− 1 observed in SBC and CSBC was ascribed to the vibrations of CO32− (Medellín-Castillo et al. 2020), and the band at 562 cm− 1 to the deformation vibrations of Ca2+ (Rojas-Mayorga et al. 2015). In Al/Y-CSB and F-Al/Y-CSBC, the vibrations at 1627 cm− 1 were identified as C = O (Rojas-Mayorga et al. 2015), and the vibrations at 1522 cm− 1 to C–C (Min et al. 2022). In comparison to the FTIR spectra of SBC and CSBC, the spectrum of Al/Y-CSBC exhibited strengthened –OH vibrations while showing an absence of bands related to CO32− and Ca2+, which is consistent with the XRD results. Moreover, the evident attenuation of –OH bands in F-Al/Y-CSBC indicates the involvement of the –OH group in the adsorption process, implying that the surface functional groups of Al/Y-CSBC played a pivotal role in adsorbing fluorides from aqueous solutions.
3.2 Adsorption
3.2.1 Impact of pH
Figure 5a displays the impact of pH on the adsorption process of Al/Y-CSBC materials. With an initial concentration of 10 mg·L− 1 fluoride ions, the adsorption capacity of the Al/Y-CSBC exhibited a gradual increase as the pH increased within the acidic range. At pH = 7, the removal rate reached its highest value of 97.16%, but subsequently decreased gradually with further increases in pH. A significant decline in removal efficiency was observed when the pH exceeded 9. Due to the dispersion action of biochar(Liao et al. 2022), which fully exposed more active sites and increased its applicability over a larger pH range, the Al/Y-CSBC adsorbent had an adsorption capability of more than 90% fluoride removal in the range of solution pH = 5 ~ 9.
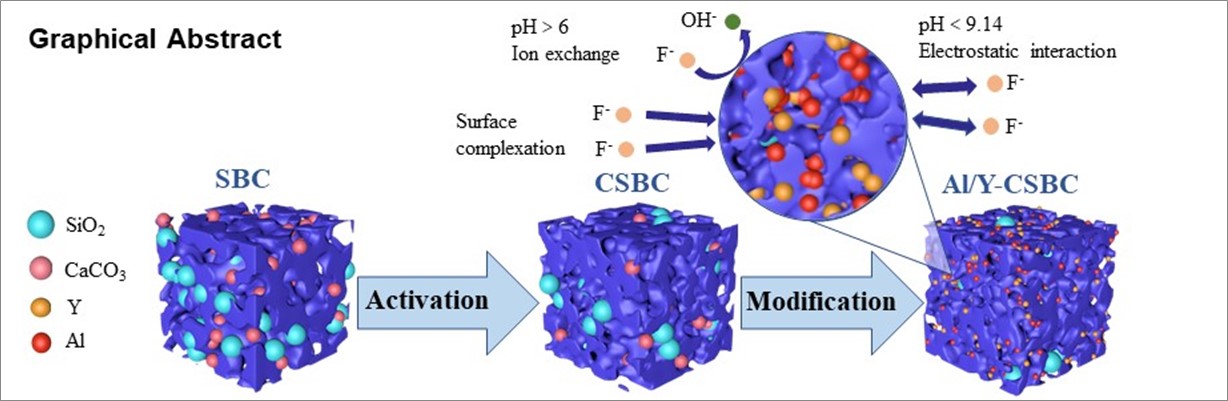
Figure 5b displays the results of the investigation into pH variation in aqueous systems that contain Al/Y-CSBC adsorbent with initial pH values ranging from 3 to 10, examining both the impact of initial pH and fluoride ions presence. Our study found that the pH value after adsorption decreased under alkaline conditions and increased under acidic conditions, indicating remarkable acid-base buffering ability of the adsorbent. (Wang et al. 2018). The negligible effect of fluoride ions on pH variation in systems with initial pH below 6 indicates that the adsorption of these ions was mainly due to electrostatic forces. However, when the initial pH exceeded 6, the degree of pH decrease varied depending on the presence of fluoride ions after reaching adsorption equilibrium. The pH of the aqueous Al/Y-CSBC system containing fluoride ions decreased less than that of the simple adsorbent-water system without fluoride ions, indicating that the adsorption of fluoride ions on Al/Y-CSBC resulted in a relatively higher pH of the solution. The entry of fluoride ions into the water solution could be explained by the role of hydroxyl groups on the adsorbent surface in facilitating ion exchange. This finding is supported by the FTIR results (Chen et al. 2022).
The decrease in Zeta potential was observed as the pH increased, as demonstrated in Fig. 5c. It was also discovered that the point of zero charge (pHpzc) was at pH value of 9.16. When the pH was less than 9.16, the adsorbent gave a positive zeta potential, facilitating the electrostatic adsorption of fluoride ions. Beyond a pH of 9.16, the adsorbent surface became negatively charged, resulting in the electrostatic repulsion of fluoride ions. Moreover, the presence of hydroxide ions can impede the adsorption of fluoride ions by competing for available adsorption sites, thus reducing the overall capacity for fluoride removal.
3.2.2 Adsorption kinetics
Figure 6 displays the kinetic curves for the adsorption of fluoride ions by Al/Y-CSBC, and Table 2 displays the corresponding kinetic parameters. Figure 6a shows that the initial stages of the fluoride ion adsorption by Al/Y-CSBC were rapid, reaching an adsorption capacity of 9.36 mg·g− 1 in just 10 minutes, then followed by slow adsorption until reaching equilibrium whin 240 minutes. Figure 6a presents the application of pseudo-first and pseudo-second-order kinetic models for further investigation of the fluoride adsorption mechanism. The pseudo-second-order kinetic model, with an R2 value of 0.96, provided a more precise depiction of the adsorption kinetics compared to the pseudo-first-order model. These results suggest that the fluoride adsorption process on Al/Y-CSBC was predominantly governed by chemisorption mechanisms, such as ion and ligand exchanges (Yang et al. 2018).
Additionally, Fig. 6b includes the application of the intraparticle diffusion model, which was utilized to characterize the adsorption process. This model demonstrated three linear segments throughout the process, signifying the existence of various mass transport adsorption stages, where K1 > K2 > K3. The initial linear fraction (K1) demonstrated the membrane diffusion governed by external mass transfer, in which a significant quantity of fluoride in solution was transported to the boundary layer and adsorbed on the outer surface of the Al/Y-CSBC. The intermediate linear fraction (K2) represented fluoride progressively diffusing to the inner surface of the Al/Y-CSBC as the quantity of external adsorption sites declines. Finally, in the equilibrium phase (K3), most of the adsorption sites on the adsorbent surface were occupied by fluoride, and some of them entered the adsorbent's internal pores as well (Kim et al. 2020). Furthermore, the C, C1, and C2 values represented the film thickness, liquid film diffusion, and intraparticle diffusion, indicating that intraparticle diffusion was not the sole restricting factor in fluoride adsorption (Peng et al. 2020). On the contrary, the adsorption process was controlled by both intraparticle diffusion and liquid film diffusion, as reported by Zheng et al (Zheng et al. 2022).
Table 2
Kinetic parameters of fluoride ion adsorption on Al/Y-CSBC
| Model | Parameter1 | Parameter2 | R2 |
| Pseudo-first-order | K1 = 0.73 | qe=9.72 mg·g− 1 | 0.60 |
| Pseudo-second-order | K2 = 0.23 | qe=9.88 mg·g− 1 | 0.96 |
| Intra-particle diffusion | K1 = 0.359 | C1 = 8.179 | 0.932 |
| K2 = 0.069 | C2 = 9.314 | 0.989 |
| K3 = 0.011 | C3 = 9.782 | 0.923 |
3.2.3 Adsorption isotherms
The corresponding fitting outcomes obtained from three isotherm models are outlined in Fig. 7, and the fitted parameters are presented in Table 3. Based on the results, it was found that the Freundlich model provided better accuracy than the Langmuir model in describing the adsorption isotherm due to a higher correlation coefficient, demonstrating that the fluoride adsorption process was multi-layer sorption, and the active sites situated on the surface of Al/Y-CSBC were heterogeneous.
The maximum capacity obtained from the Langmuir adsorption model was 55.24 mg·g− 1, which was comparable to the actual experimental maximum capacity of 62.44 mg·g− 1. This exceeds the abilities of other reported adsorbents. Regarding the DR model, E (kJ·mol− 1) represents the free energy of adsorption required to transfer 1 mol of the adsorbate from infinity to the adsorbent surface. If E < 8 kJ·mol− 1, physisorption dominates, while 8 kJ·mol− 1<E < 16 kJ·mol− 1, chemisorption prevails (Kim et al. 2020). Table 4 displays the E values of Al/Y-CSBC (12.13 ~ 12.58 kJ·mol− 1), indicating that chemisorption played a leading role in defluoridation as the E values fall above 8 kJ·mol− 1 and below 16 kJ·mol− 1.
Table 3
Parameters obtained by fitting different adsorption isotherm models
| T (K) | Langmuir isotherm | Freundlich isotherm | Dubinin-Radushkevich |
| qm (mg·g− 1) | KL (L·mg− 1) | R2 | KF (mg·g− 1) | 1/n | R2 | β (mol2·kJ− 2) | E (kJ·mol − 1) | R2 |
| 298 | 55.24 | 0.71 | 0.91 | 21.67 | 0.29 | 0.97 | 3.40×10− 3 | 12.13 | 0.93 |
| 308 | 45.95 | 0.42 | 0.93 | 15.47 | 0.33 | 0.98 | 3.36×10− 3 | 12.20 | 0.93 |
| 318 | 36.88 | 0.52 | 0.96 | 14.16 | 0.28 | 0.94 | 3.16×10− 3 | 12.58 | 0.95 |
3.2.4 Thermodynamic study
Table 4 shows the thermodynamic parameters of fluoride ion adsorption on Al/Y-CSBC at different temperatures. At higher temperatures (25 ℃ to 45 ℃), the equilibrium adsorption capacity of Al/Y-CSBC for fluoride decreased by 18.36 mg·g− 1, indicating that temperature increase was unconducive for fluoride adsorption. The negative ΔH and ΔG values also reflected that fluoride adsorption on Al/Y-CSBC is an exothermic and spontaneous reaction. The positive value of ΔS value also indicated an increase in degree of freedom, which drove the fluoride adsorption process (Zeng et al. 2021).
Table 4
Thermodynamic properties of fluoride adsorption on Al/Y-CSBC
| T (K) | KT | △G (kJ·mol − 1) | △H (kJ·mol − 1) | △S (J·(mol·k)−1) |
| 298 | 13474.42 | -23.39 | -12.50 | 36.16 |
| 308 | 8020.09 | -23.68 | | |
| 318 | 9888.47 | -20.14 | | |
3.2.5 Impact of co-existing anions and reusability
In naturally fluorinated wastewater, there are typically co-existing anions such as NO3−, Cl−, Br−, HCO3−, CO32−, SO42−and PO43− ions. These anions may compete with fluoride ions for adsorption sites during the adsorption process, thereby reducing the effectiveness of fluoride removal. Figure 8a presents the results of an experiment investigating the influence of varying concentrations of anions on fluoride removal. This study indicates that different types of anions have distinct effects on fluoride adsorption. Chloride ion had little effect at all concentrations, while phosphate had the most significant reduction. The order of influence, from high to low, is phosphate > carbonate ~ sulfate > chloride. The affinity for the adsorbed ions is mainly related to the ionic radius and charge, which determines the competitive adsorption strength of the coexisting anions. Among these anions, PO43− has the highest negative charge density and the strongest electrostatic attraction with positively charged materials, therefore it has the greatest impact on fluoride ion removal (Huang et al. 2020). It should be noted that the concurrent presence of multiple anions substantially diminishes the absorbent's adsorption rate. Therefore, it is imperative to strengthen the adsorbent's capacity to resist interference from coexisting anions.
To examine the reusability of Al/Y-CSBC, a 0.5 mol·L− 1 NaOH solution was employed to disrobe fluoride ions from the spent adsorbent. As shown in Fig. 8b, even after the sixth cycle, the Al/Y-CSBC material was still able to adsorb 96.52% of fluoride ions. This demonstrates the effective capabilities of Al/Y-CSBC regeneration and highlights its great advantages in terms of recoverability and cost control for future practical applications.
3.3 Mechanism Study
Figure 9 illustrates the chemical states of the surfaces of SBC, CSBC, Al/Y-CSBC and F-Al/Y-CSBC. Before modification, the presence of the Ca 2p peak indicated the existence of large amounts of calcium salts in SBC and CSBC. However, this peak disappeared after modification, accompanied by the presence of Al 2p and Y 3d peaks at 74.05 eV and 158.54 eV, respectively, indicating the successful loading of Al and Y. These results are consistent with those obtained from EDS, XRD, and FTIR analyses.
In F-Al/Y-CSBC, the content of O 1s and Al 2p were observed to decrease to 33.07% and 9.69%, respectively. Additionally, a new F 1s peak was detected at 684.91 eV, indicating the successful adsorption of fluoride ions. The binding energy of F 1s was higher than that of sodium fluoride (684.50 eV), indicating an interaction between fluoride ions and aluminum and yttrium metal ions (Wang et al. 2021; Zhu et al. 2017).
Furthermore, Fig. 10 provides detailed XPS spectra before and after adsorption. In Fig .10a, the C 1s peak exhibits anti-folding at 283.72 eV (C = C), 284.80 eV (C-C) and 288.41 eV (O-C = O). However, after adsorption, the peak shifted to 283.55 eV (C = C), 284.80 eV (C-C) and 288.20 eV (O-C = O)(Li et al. 2020,2020). As shown in Fig. 10b, The O 1s peak is counter-folded to accumulate at 530.54 eV (M-O) and 531.65 eV (OH−) before adsorption. After adsorption, it moves to 530.76 eV (M-O) and 531.89 eV (OH-), indicating a decrease in the hydroxyl group content from 87.48–58.70% and an increase in the M-O content from 12.52–41.30%. These observations suggest that OH− is responsible for exchanging with fluoride ions (He et al. 2021; Ma et al. 2020).
In Fig. 10c, the Al 2p peak is counter-folded to accumulate at 73.53 eV (Al-O) and 74.25 eV (Al-OH) before adsorption. However, after adsorption, it shifts to 73.72 eV (Al-O) and 73.59 eV (Al-O), indicating a decrease in Al-OH content from 57.80–41.52%. These findings indicate that Al-OH is involved in the adsorption of fluoride ions and is converted to Al-O upon adsorption. The binding energy before adsorption at the 75.17 eV (Al-OH) peak corresponds to the octahedral coordination of aluminum (Nehra et al. 2020; Ekka et al. 2017). After adsorption, it forms γ-Al2O3, and the Al-O bond complies with 529.74 eV (M-O) in O 1s after adsorption (Filatova, Konashuk 2015; Ekka et al. 2017). In Fig. 10d, the Y 3d peaks initially appeared at 157.80 eV and 159.85 eV, but shifted to 158.19 eV and 160.24 eV after adsorption, as reported else well (Yu et al. 2019; Jiang et al. 2019). It is worth noting that there is an overlap between the energy level spectrum of Y 3d and Si 2s. Interestingly, the binding energy of the Si 2s level is reported as 153.03 eV by Yu et al (Yu et al. 2022). These findings offer additional evidence of the successful adsorption of fluoride ions by the Al/Y-CSBC material and reveal the changes in the chemical states of the surfaces before and after adsorption. The decrease in hydroxyl group content and the shift in the Al 2p and Y 3d peaks provide insights into the defluoridation mechanism of the Al/Y-CSBC material.
Based on the pH effects observed during the fluoride adsorption process, as well as the isotherm models and kinetic models and XPS analysis discussed above, it can be concluded that the adsorption of fluoride by Al/Y-CSBC involves both physical and chemical processes, with chemisorption playing a dominant role. This includes ion exchange and surface complexation. The solid metal minerals in the Al/Y-CSBC adsorbent undergo surface hydroxylation and protonation at the solid-liquid interface, which enables them to exhibit strong buffering capacity during adsorption.
As shown in Fig. 11, under alkaline conditions, a significant amount of surface hydroxylation and O2− generation occurs, resulting in a negatively charged. Conversely, under acidic conditions, they become protonated and positively charged. The modified sludge biochar exhibits a high zero-charge-point and strong acid-base buffering properties due to the formation of numerous amorphous bimetallic oxides with a positive charge, as well as good dispersion of biochar support (Liao et al. 2022).
Under acidic conditions, the adsorbent surface has a high zeta potential, inducing strong electrostatic attraction to fluoride ions in the solution. However, under excessively low acidic circumstances, the fluoride mainly exists in the form of hydrogen fluoride with weak electrostatic attraction. Meanwhile, excessively low acidic circumstances lead to metals being leached from the adsorbent surface and ultimately decreasing the adsorption capacity. As the pH of the solution increases, the zeta potential of the adsorbent surface decreases, causing the electrostatic attraction to weaken. Once the zero-charge point is exceeded, the adsorption becomes negatively charged and repulsive, and the adsorption process is influenced by ion exchange. The XPS results show the increase of metal oxides on the surface of the adsorbent after adsorption and the complexation reaction with fluorine ions, which finally presents in the form of complexed fluorides. Due to the inherent fluorophilic nature of the aluminum-yttrium as well as the dispersing effect of sludge biochar(Liao et al. 2022), the adsorbent exhibits excellent acid-base suitability and predominantly multilayer inhomogeneous adsorption (Jing et al. 2020; Kim et al. 2020).