Chemistry
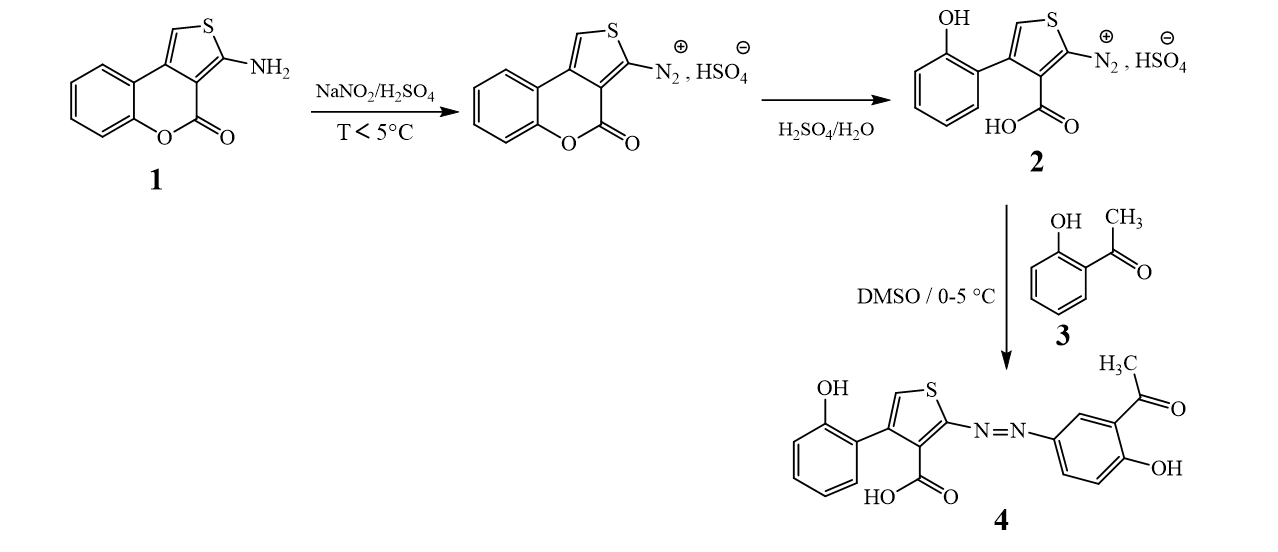
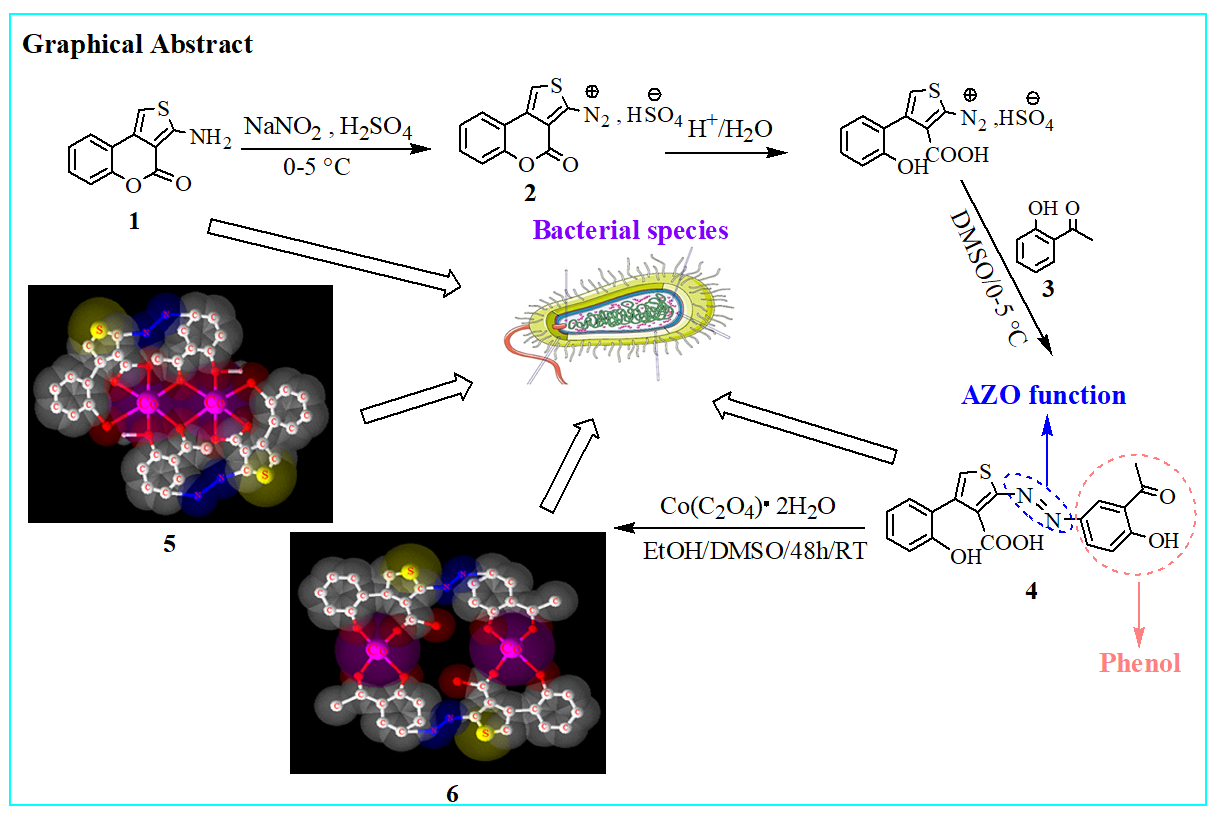
The new azoic ligand 4 was prepared using the thienocoumarin 1 as starting material. Procedure for the preparation of 1 has been reported earlier [28, 29]. The general preparation process of 4 is displayed in Scheme 1 [29, 30].
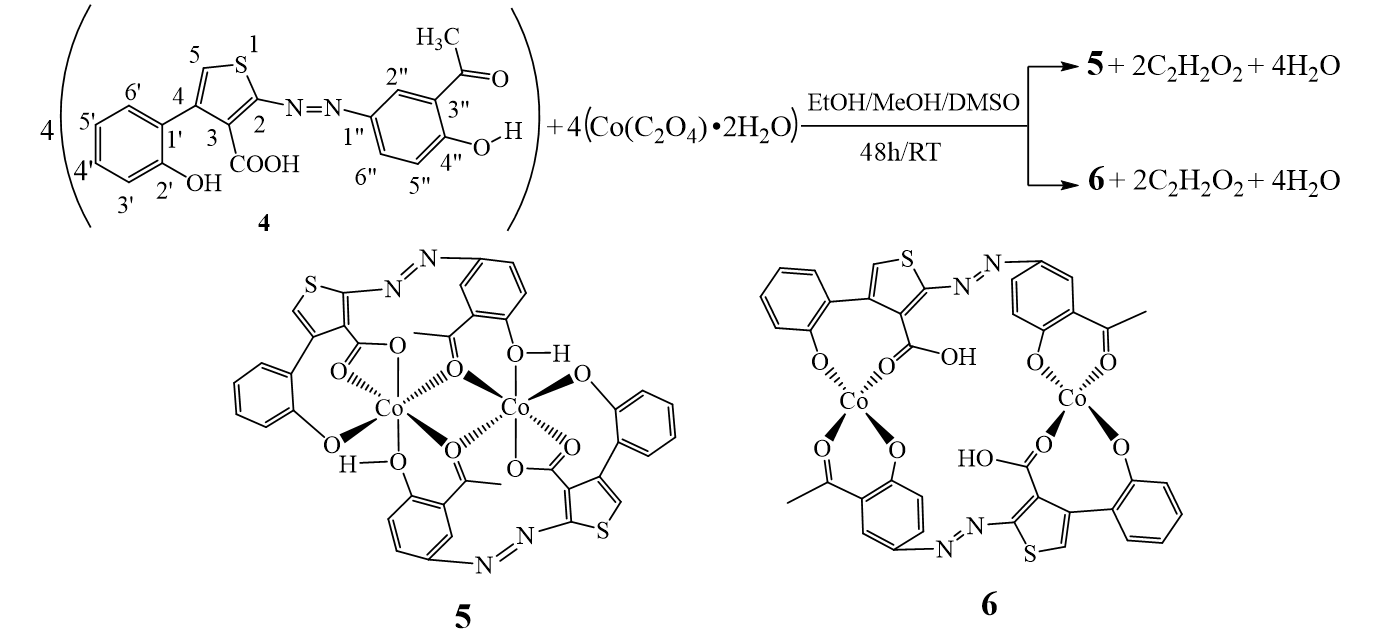
The structure of substrate ligand 4 (C19H14N2O5S) was confirmed with its physical and spectroscopic data. Reaction of compound 4 (previously dissolved in 4 mL of DMSO) with Co(C2O4)•2H2O (dissolves in EtOH/MeOH 2:1) with constant stirring at room temperature for 48 hours gave compounds 5 and 6 (Scheme 2).
The ligand and the complexes were obtained as dark green, black and green colors powders respectively, air stable and soluble in DMSO and acetone. The elemental analysis (C, H, N, and S) and melting points data of these compounds are recorded in Table 1.
Table 1 Analytical and physical data for the complex
|
Compounds
|
Colors
|
m p (∘C)
|
Calculated (found)
|
|
%C
|
%H
|
%N
|
%S
|
|
4
|
dark green
|
296-298
|
59.68 (59.70)
|
3.69 (3.68)
|
7.33 (7.31)
|
8.38 (8.37)
|
|
5
|
black
|
288-290
|
51.95 (51.98)
|
2.75 (2.78)
|
6.38 (6.36)
|
7.30 (7.27)
|
|
6
|
green
|
214-216
|
51.95 (51.92)
|
2.75 (2.77)
|
6.38 (6.41)
|
7.30 (7.33)
|
The UV-VIS spectrum of ligand 4 showed a strong band in the ultraviolet range at 332 nm and moderate bands above 350 nm, attributed to the π→π* and n→π* transitions (due to the azo bridge) respectively (Table 2). Electronic spectral measurements were used to assign the stereochemistry of the metal complexes based on the positions and number of d→d transition peaks.
For the cobalt (II) complexes, the only possible configurations found in the literature are square-plane, tetrahedral and octahedral. Therefore, for complex of cobalt(II) hexadentate 5, the only possible geometry that can be envisaged is octahedral. In fact, its electronic spectrum shows two bands of low intensities in the visible range. The first at 490 nm is attributed to the 4T1g(F) → 4A2g(F) transition and the second around 600 nm is due to the 4T1g(F) → 4T1g(P) transition [31]. These two absorptions are characteristic of an octahedral environment around the cobalt(II) ion complexes [32].
For the tetradentate complex 6, a square-planar or tetrahedral configuration could be envisaged. Based on its electronic spectrum, it was possible to differentiate between these two alternative configurations as follows. The absence of absorptions between 600-700 nm which are characteristic for tetrahedral cobalt(II) complexes [33, 34], ruled out the hypothesis of a tetrahedral geometry for 6. Moreover, the presence of an absorption (of very low intensity) above 500 nm (Figure 6) makes more plausible the hypothesis of a low-spin square-plane geometry for this complex [35, 36]. As a consequence, on the basis of the LCAO approach, the central Co(II) ions should be hybridized sp3d2 and dsp2 respectively to comply with the octahedral and square-planar geometries of the coordination spheres in compound 5 and 6. The absorption spectra of the ligand and complexes are represented in Fig. 1.
The free ligand C19H14N2O5S shows a very strong sharp band with well-structured peaks at 1726 and 1668 cm-1 due to the ν(C=O) (ketone and acid respectively) present in the molecule (Fig. 2). In the IR spectrum of the complexes [Co2(C19H12N2O5S)2] (Fig. 3 and 4), these bands appear but with a pronounced shift towards higher frequencies at 1748 cm-1 and 1695 cm-1 respectively (for 6), and towards lower frequencies around 1713 cm-1 (for 5), indicating the involvement of the corresponding oxygen in the coordination with the central Co2+ ion. In these complexes, the values of ν(N=N) observed at 1446 cm-1 in the ligand remain constant, meaning that the azo function does not participate in the coordination. The other atoms involved in the coordination bonds in these molecules are those of the oxygen of the two phenolic hydroxyl groups and that of the carboxylic acid function present in ligand 4. The absence in the complex 6 of the ν(OH) frequencies present in the starting ligand at 3541 cm-1 and 3248 cm-1 which are assigned to free (2'-OH) and chelated (4''-OH) phenolic hydroxyls respectively, suggests the participation of the latter in coordination with deprotonation (Fig. 4). In the complex 5, the signal of the hydroxyl (2'-OH) appears in the higher frequency region at 3258 cm-1 and one can notice the disappearance of the signal of the carboxylic acid hydroxyl at 2575 cm-1. These observations are suggestive of the participation of the corresponding oxygen atoms in the coordination without and with deprotonation respectively. The new bands that appeared in the complex in the region 521-570 cm-1 at 548 and 528 cm-1 (complex 5) and at 530 cm-1 (complex 6) were attributed to the Co–O bonds [37, 38] between the central cobalt ion and all the oxygen atoms involved in coordination. The relative intensities as well as the provisional assignments of the various bands mentioned above are given in the Table 2.
Table 2 Infrared and electronic spectral data for the ligand and complexes
|
Compounds
|
Infrared spectral data (cm-1)
|
Electronic spectral bands (nm)
|
|
ν(2’-OH)
|
ν(4’-OH)
|
ν(OH)acid
|
ν(C=O)ketone
|
ν(C=O)acid
|
ν(N=N)
|
ν(Co–O)
|
|
4
|
3541
|
3249
|
2575
|
1726
|
1668
|
1446
|
--
|
332, 445, 586
|
|
5
|
--
|
3258
|
--
|
1713
|
1713
|
1446
|
528/548
|
332, 436, 490, 595
|
|
6
|
--
|
--
|
2577
|
1748
|
1695
|
1450
|
530
|
332, 382, 538
|
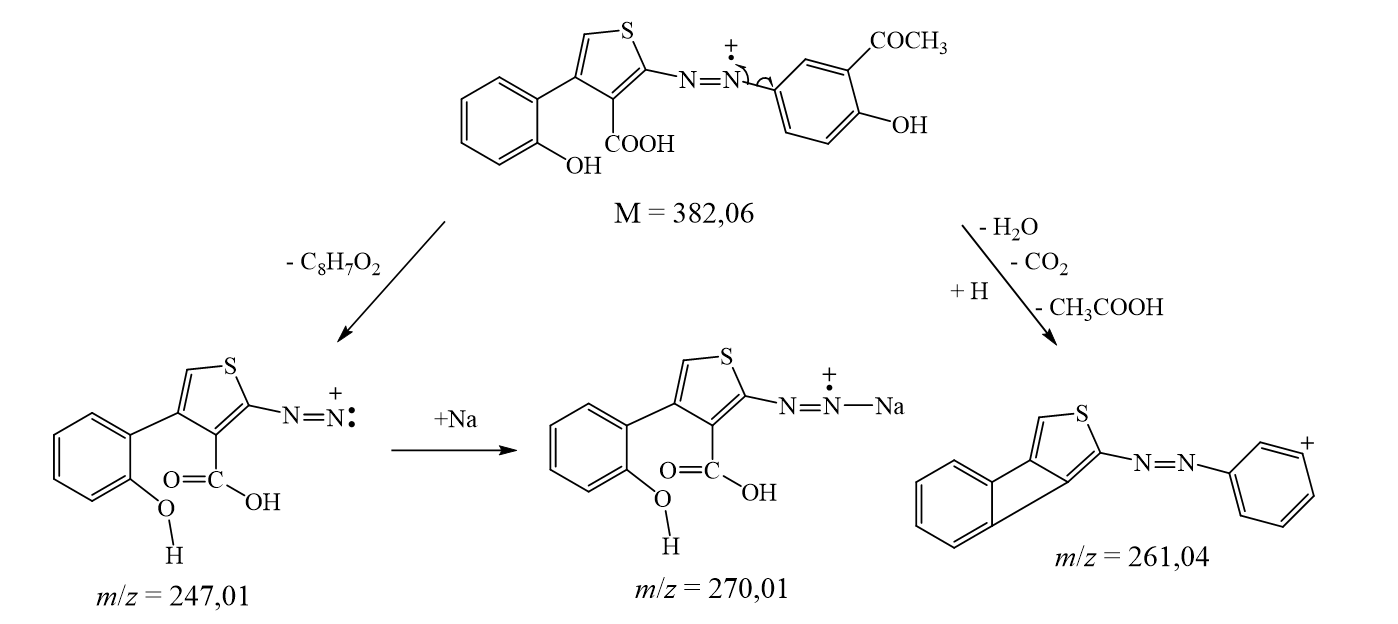
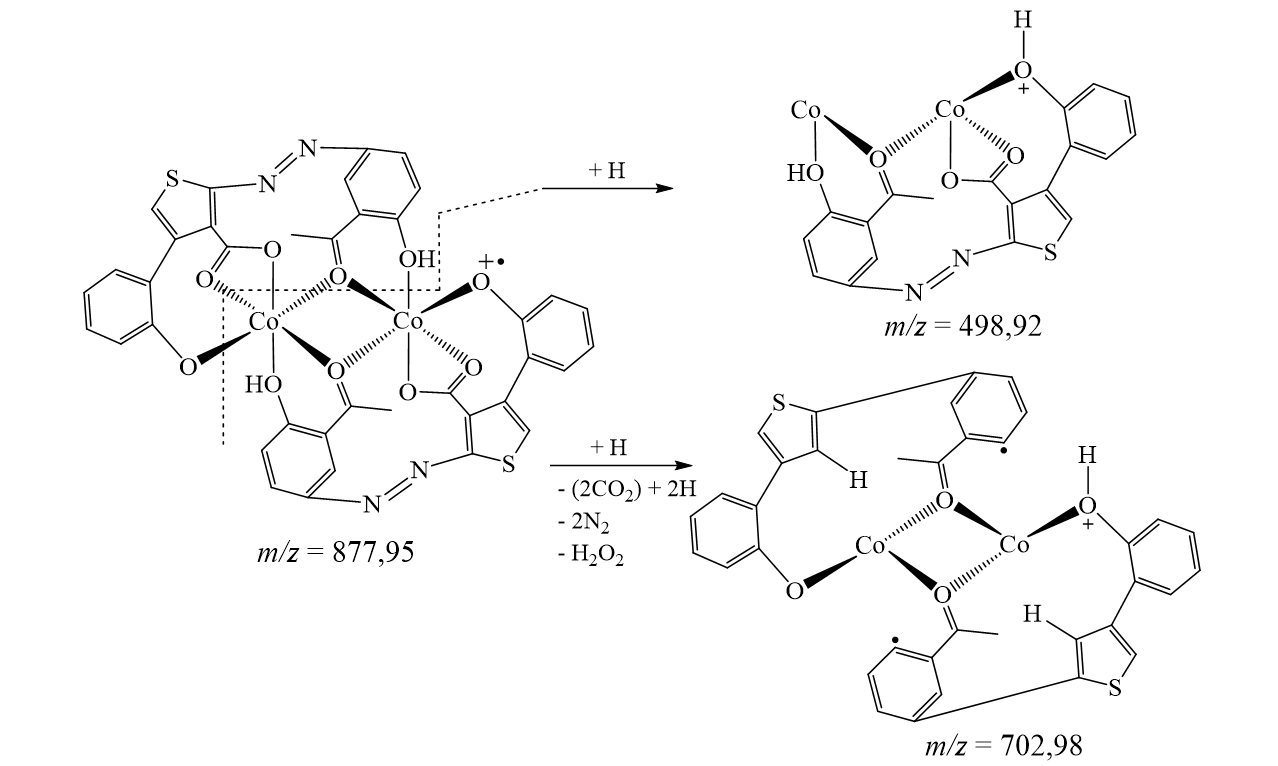
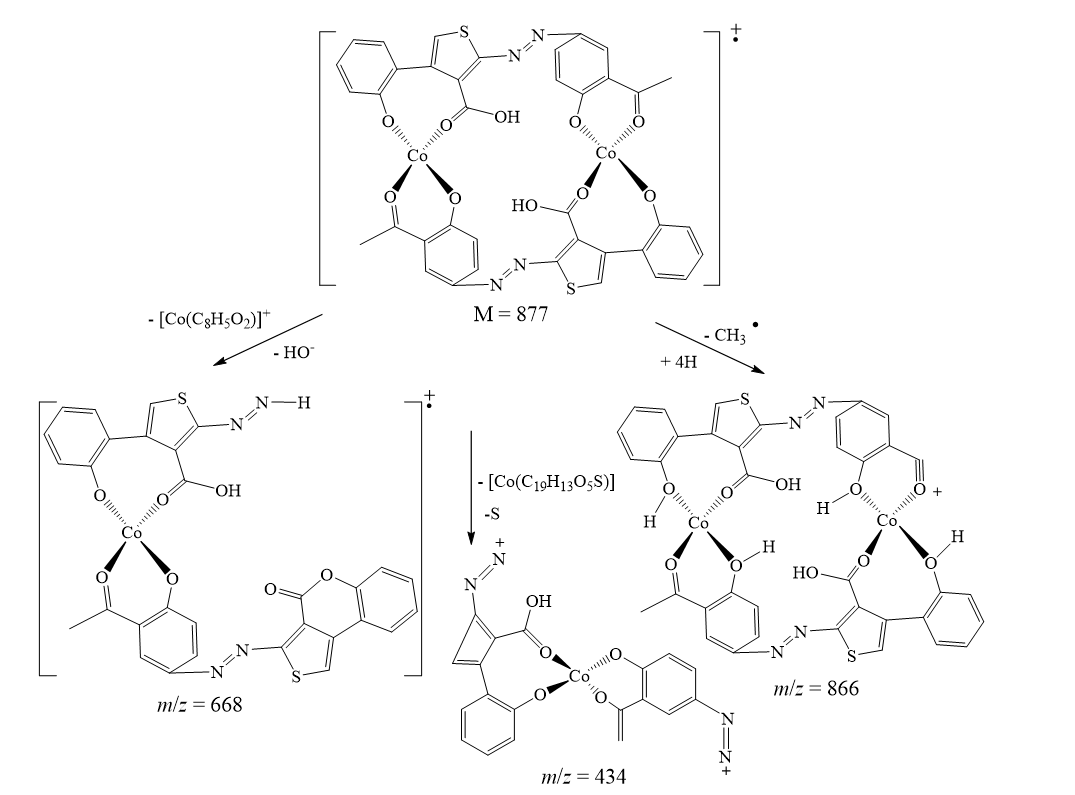
The suggested structures were supported by the mass spectral data of the free azo dye ligand and its Co(II) complexes, which were compatible with the molecular ion fragments (Fig. 5). Some of the fragments observed in the mass spectra of the ligand 4 and its Co(II) complexes 5 and 6 are rationalized in the fragmentation Scheme 3-5.
Comparative 1H NMR spectra of the ligand and the complexes (Fig. 6) showed deprotonation of the latter in the derived complexes. Indeed, the spectra of complexes 5 and 6 present the deprotonations of the chelated ligand, that of the hydroxyl 2’-OH at 2.99 ppm in the complex 5 and those of the hydroxyl 2’-OH at 2.99 ppm and 4’’-OH at 11,93 ppm in the complex 6. These observations confirm the formation of the Co-O bonds with those oxygen atoms. Moreover the same signals with almost the same multiplicities are observed in the spectra of the ligand and the complexes with respect to the aromatic protons.
The 13C NMR spectrum of the ligand 4 (C19H14N2O5S) displays 19 signals due to the 19 carbon atoms present in this molecule (Fig. 7). The most important being the carbon atoms bearing the coordinating oxygen atoms, found at 205.2 ppm, 184.8 ppm, 161.3 ppm and 155.5 ppm for the carbons 3’’-COCH3, 3-COOH , C-4’’ and C-2’’ respectively.
Thus, the comparison of this spectrum with those of the [Co2(C19H12N2O5S)2] complexes made it possible to assign the carbonyls 3’’-COCH3 and 3-COOH the chemical shift values 195.0 ppm and 179.9 ppm and the phenolic carbons the values 156.0 ppm and 156.5 ppm in the complex 5 whereas the values 192.4 ppm, 185.6 ppm, 161.4 ppm and 156.7 ppm respectively could correspondingly be assigned in the complex 6. The chemical shifts of the ligand and the complexes are summarized in Table 3.
Fig. 8 summarizes the two most significant interactions that were seen in the HSQC spectra of the ligand and compounds 5 and 6. The first of these is the correlation spots between the methyl protons at 2.63 ppm (in 5) (one signal), and at 2.63 and 2.61 ppm (in 6) (two signals) and their carbons at 39.1 ppm and at 39.9 and 39.8 ppm respectively. On the other hand, correlation spots between protons H-6' at 8.87 ppm (in 5) and at 8.83 ppm (in 6) and their carbons at 129.6 ppm (in 5) and at 129.9 ppm (in 6) indicate the presence of the acetophenone fragment and that of the thiophenic moieties on each side of the N=N bridge.
The long-distance couplings (2J and 3J) between the protons and the carbons of the chelating ligand moieties were highlighted by the HMBC experiment (Fig. 9). Indeed, it allowed to reconstruct the carbon skeleton of the coupling fragment through correlation spots between the 4''-OH proton (11.93 ppm) and the C-4'' carbons (161.3 ppm) and C-5'' (118.1 ppm), the proton H-6'' (~ 7.85 ppm) and the carbons C-2'' (136.8 ppm) and C-4'' (161.3 ppm ), the H-5'' proton (6.91 ppm) and the C-3'' carbons (120.0 ppm) and finally between the methyl CH3 (2.60 ppm) and the carbonyl C=O (205.1 ppm), thus eliminating the hypothesis of multiple couplings on the aromatic ring of the coupler. Some of these correlations were also found in the HMBC spectra of the complexes despite their high complexity due to the overlapping of homologous proton systems of the chelating ligand moieties.
Table 3 Comparison of the 1H and 13C NMR (DMSO-d6) chemical shifts of the ligand 4 with those of the complexes 5 and 6
|
Positions
|
Ligand 4
|
Complex 5
|
Complex 6
|
|
δ13C in ppm
|
δ1H in ppm
|
δ13C in ppm
|
δ1H in ppm
|
δ13C in ppm
|
δ1H in ppm
|
|
2
|
154.5
|
--
|
--
|
--
|
155.4
|
--
|
|
3
|
154.2
|
--
|
--
|
--
|
154.9
|
--
|
|
3-COOH
|
184.8
|
--
|
179.9
|
--
|
185.6
|
--
|
|
4
|
148,4
|
--
|
149.6
|
--
|
148.1
|
--
|
|
5
|
119.7
|
6.94
|
129.1
|
8.83
|
--
|
7.54
|
|
1’
|
115.6
|
--
|
115.2
|
--
|
115.2×2
|
--
|
|
2’
|
155.5
|
--
|
156.0
|
--
|
156.7
|
--
|
|
2’-OH
|
--
|
2.99
|
--
|
--
|
--
|
--
|
|
3’
|
117.7
|
7.46-7.49
|
117.0
|
7.41-7.47
|
117.2×2
|
7.34-7.42
|
|
4’
|
136,0
|
7.74-7.85
|
135.3
|
7.73-7.81
|
135.7
|
7.71-7.80
|
|
5’
|
126.0
|
7.46-7.49
|
125.3
|
7.41-7.47
|
125.7×2
|
7.34-7.42
|
|
6’
|
129.5
|
8.69
|
129.6
|
8.87
|
129.9
|
8.83
|
|
1’’
|
134.9
|
--
|
134.4
|
--
|
--
|
--
|
|
2’’
|
136,8
|
7.74-7.85
|
--
|
7.73-7.81
|
|
7.71-7.80
|
|
3’’
|
120.3
|
--
|
--
|
--
|
119.4
|
--
|
|
3’’-COCH3
|
205.1
|
--
|
195.0
|
--
|
192.4
|
--
|
|
3’’-COCH3
|
28.1
|
2.60
|
39.1
|
2,63
|
39.9
39.8
|
2.63
2.61
|
|
4’’
|
161.3
|
--
|
156.5
|
--
|
161.4
|
--
|
|
4’’-OH
|
--
|
11.93
|
--
|
--
|
--
|
--
|
|
5’’
|
118.1
|
6.91
|
--
|
7.41-7.47
|
--
|
7.51
|
|
6’’
|
132.0
|
7.74-7.85
|
--
|
7.73-7.81
|
--
|
7.71-7.80
|
The COSY 1H-1H experiment of the ligand (Fig. 10) clearly showed the correlation squares between the aromatic protons belonging to the molecular fragments on either side of the azo bridge. For the complexes, the most visible correlations are those of the benzene ring for the above mentioned similar reasons (Fig. 11).
Theoretical calculations were performed on the ligand to determine the most reactive sites of the unsaturated system. The energies and electronic densities of the frontier molecular orbitals (FMO), HOMO and LUMO, as well as the molecular electrostatic potential (MEP) are important electronic parameters for this purpose [39, 40]. The structures of the FMO and the MEP obtained from a B3LYP/6-311G mode of calculations are given in Fig. 12. The EHOMO and ELUMO values are - 6.114 eV and - 2.960 eV respectively, resulting in an energy gap of 3.15 eV.
XDR analysis
The powder X-ray diffraction of ligand 4 and complex 6 are different from each other (Fig. 13) and indicates a good crystalline structure and a good purity of these compounds. The spectra of compound 6 shows a significant number of sharp bands or peaks. This suggests that it is made up of well-organized particles. All the new peaks exhibited in the diffractogram of the complex 6 are in agreement with the fact that it is different from the ligand 4. The optimized 3D view of compound 4, 5 and 6 are clearly presented in Fig. 14.
Biology
Antibacterial activity
The comparative study of the activity of the starting 2-aminothiophen (1) and the tree new compounds (4, 5 and 6) was carried out on bacteria strains such as Staphylococcus aureus ATCC25923, Pseudomonas aeruginosa, Escherichia coli ATCC25922 and Klebsiella pneumoniae 22. Screening results showed that compound 1 had a moderate activity (CMI = 128 µg/mL) and (CMI = 64 µg/mL) on Escherichia coli ATCC25922 and Klebsiella pneumoniae 22 respectively, but its highest activity (CMI = 32 µg/mL) was found on Pseudomonas aeruginosa and Staphylococcus aureus ATCC25923 strains. These activities decrease in the azoic ligand 4 on Pseudomonas aeruginosa (CMI = 64 µg/mL) and Staphylococcus aureus ATCC25923 (CMI = 128 µg/mL); increase on Escherichia coli ATCC25922 (CMI = 32 µg/mL) and remains constant on Klebsiella pneumoniae 22 (CMI = 64 µg/mL). Complex 5 had no activity on two strains Staphylococcus aureus ATCC25923 and Escherichia coli ATCC25922, but had a moderate activity (CMI = 128 µg/mL) and (CMI = 64 µg/mL) on Pseudomonas aeruginosa and Klebsiella pneumoniae 22 respectively, while complex 6 had no activity on all strains except on Klebsiella pneumoniae 22 (CMI = 64 µg/mL) where the activity remains constant with respect to precursor 1. All data are summarized in Table 4.
Table 4 Antimicrobial activity (MIC and MBC in µg/mL) of synthesized compounds as well as reference antimicrobial drugs
|
Coumpounds
|
Inhibition parameters
|
S. aureus ATCC25923
|
P. aeruginosa
|
E. coli ATCC25922
|
K. pneumoniae 22
|
|
1
|
MIC
MBC
MBC/CMI
|
32
>256
/
|
128
>256
/
|
64
>256
/
|
64
>256
/
|
|
4
|
MIC
MBC
MBC/CMI
|
32
>256
/
|
64
>256
/
|
64
>256
/
|
128
>256
/
|
|
5
|
MIC
MBC
MBC/CMI
|
128
>256
/
|
32
>256
/
|
>256
>256
/
|
64
>256
/
|
|
6
|
MIC
MBC
MBC/CMI
|
64
>256
/
|
64
>256
/
|
128
>256
/
|
64
>256
/
|
|
Reference drugs*
|
MIC
MBC
MBC/CMI
|
8
16
2
|
8
16
2
|
16
32
2
|
16
32
2
|
/ not determined, MIC Minimum Inhibitory Concentration, MBC Minimum Bactericidal Concentration,
*Ciprofloxacin was tested together with compounds 1, 4, 5 and 6
Cytotoxic activity
To investigate the potential use of compounds 1, 4, 5 and 6, their cytotoxicity was evaluated. None of the tested samples showed hemolytic activities against red blood cells at concentrations up to 128 µg/mL (Table 5). However, at the highest concentration tested in this study (256 μg/mL), complexes caused less than 4% of hemolysis. This finding highlights that complexes are slightly hemolytic at 256 μg/mL.
Table 5 Cytotoxicity of compounds against red blood cells
|
Compounds
|
Cell lysis (%)
|
|
4 µg/mL
|
8 µg/mL
|
16 µg/mL
|
32 µg/mL
|
64 µg/mL
|
128 µg/mL
|
256 µg/mL
|
|
1
|
0
|
0
|
0
|
0
|
0
|
0
|
0
|
|
4
|
0
|
0
|
0
|
0
|
0
|
0
|
0
|
|
5
|
0
|
0
|
0
|
0
|
0
|
0
|
1,76±0,000
|
|
6
|
0
|
0
|
0
|
0
|
0
|
0
|
2.44±0.003
|