Phenotypic variations, correlations, and ANOVA for growth period traits
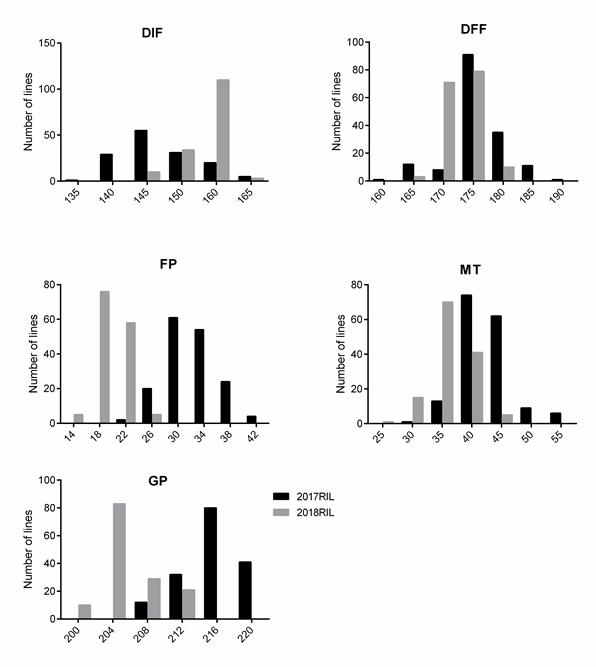
Five growth period traits (DIF, DFF, FP, MT and GP) of 588 rapeseed lines were investigated in three years. Significant variation among the genotypes for five growth period traits was observed: for instance, DIF ranged from 138 d to 207 d with an average of 157.98 d in 2017, from 149 d to 174 d with an average of 157.34 d in 2018, and from 137 d to 189 d with an average of 151.87 d in 2019 (Table 1). The coefficient variation (CV) of FP and MT was the highest (over 10%) followed by DIF and DFF, and GP was the lowest. In addition, the phenotypic frequency distributions of five traits in the three years all showed approximately continuous and normal distributions, which showed that the group was suitable for association analysis (Fig. 1).To test the effects of genotype (G), environment (E) and their interactions (GE), we conducted analysis of variance (ANOVA) for each trait (Table S1a). Significant variations were observed among environments and genotypes for all five traits. The DFF has the highest broad-sense heritability (h2) of 92.66%, the FP has relatively low heritability (74.11%). Overall, these findings indicated that all five traits were stably inherited.
To determine whether there are any relationships between five growth period traits in B. napus, the average value of three years for each trait was used for correlation analysis (Table 2). DIF showed a significant positive correlation with DFF and GP but was negatively correlated with FP and MT and DFF. DFF was significantly correlated with FP, MT, and GP with correlation coefficients of 0.148, –0.664 and 0.760, respectively. These results are consistent with a previous study reported by Zhou et al. [13]. It can be concluded that a shorter flowering time corresponds to a shorter growth period and a longer maturity time.
Genome-wide association analysis for growth period traits in three years
Through a set of processes of library construction, paired-end sequencing and SNP calling, a series of 3,856,91 highly consistent and locus-specific SNPs (minor allele frequency > 0.05 and call frequencies > 0.9) were retained for the following analysis. Fig. S1 shows the density distribution of SNP markers on different chromosomes. The 3,856,91 SNPs were covered and unevenly distributed on all 19 B. napus chromosomes.
To avoid false negative associations, three general linear models (GLM), naïve, PCA and Q models, and three mixed linear models (MLM), K, Q + K and PCA+ K models were chosen to evaluate the effects of population structure (Q, PC) and relative kinship (K). According to the Q-Q plots of the six models, the MLM model can control false positives well for each trait in three years (Fig. S2). To minimize the effect of environmental variation, best linear unbiased predictor (BLUP) value for each line were also calculated for each trait using the R package lme4 [19]. Therefore, the MLM models were conducted for GWAS of five growth period traits with three years’ data and BLUP values. We mainly focused on the QTLs detected in at least two environments. In total, 146 SNP loci significantly associated (-log10(P) ≥ 5.58) with five growth-related traits were identified, including 13 related to DIF, 23 to DFF, 6 to FP, 9 to MT and 85 to GP for the whole panel of accessions (Table S2 and Fig. 2).
Identification of candidate genes for growth period traitsin B. napus
Among the 146 SNP loci significantly associated with growth period traits, 60 SNPs were divided into 19 genomic regions using a haplotype block estimation, with sizes ranging from 7 bp to 270.31 kb, while the remaining 86 SNP loci were not present in the LD blocks (Table S3 and Fig. S3). Then, we obtained the genes within the same LD block or within 300 kb to either side of the significant SNPs using B. napus ‘Darmor v4.1’ as the reference genome. Finally, a total of 101 candidate genes were identified as orthologous to Arabidopsis flowering genes reported in the Flowering Interactive Database (FLOR-ID), most of which were involved in six flowering pathways of aging, autonomous pathway, vernalization, photoperiod, GA, and circadian clock; other genes functioned as flower development and meristem identity and flowering time integrator (Table S4). The flowering time integrators FLOWERING LOCUS C (FLC) control the transition from vegetative to reproductive meristem by integrating the signals from six pathways and then precisely regulating the expression of specific flower meristem identity genes APETALA2 (AP2) and FRUITFULL (FUL)20].
By comparing the SNP regions, 28 SNP loci (within 300 kb) associated with growth period traits, were located in or near the QTL regions identified in previous studies: 23 were reported by Raman et al., 7 were reported by Wang et al., and 4 were reported by Zhou et al. [3, 13, 21, 22] (Table S3 and Fig. 3). Among these loci, S1_5075025, S2_5719334 and S15_5922896 were reported in 2 studies, and S3_13708544 and S7_10803897 were detected simultaneously in three studies. At the same time, the candidate genes we identified in this study were also reported in previous studies [13, 21–27]. The flowering time integrator (BnaFLC.C02, BnaFUL.A03 and BnaSVP.A09) were reported in three or more previous studies (Table S3). Overall, the comparison of QTLs and candidate genes further validates the reliability of the GWAS mapping and help us mine the novel QTL.
QTL linkage mapping of growth period traits in two years
The RIL population of GH06 P174 grown in 2017 and 2018 was evaluated for DIF, DFF, FP, MT and GP phenotypes and then used for QTL analysis. The flowering time of GH06 was later than that of P174 in the two investigated environments. A wide range of variation (Table 3) and the normal phenotypic distribution for the growth period traits (Fig. S4) were observed in the RIL population, indicating a quantitative inheritance suitable for QTL mapping. ANOVA was performed on the phenotypic data from two years, and h2 ranged from 49% (DFF) to 53% (GP) (Table S1b).
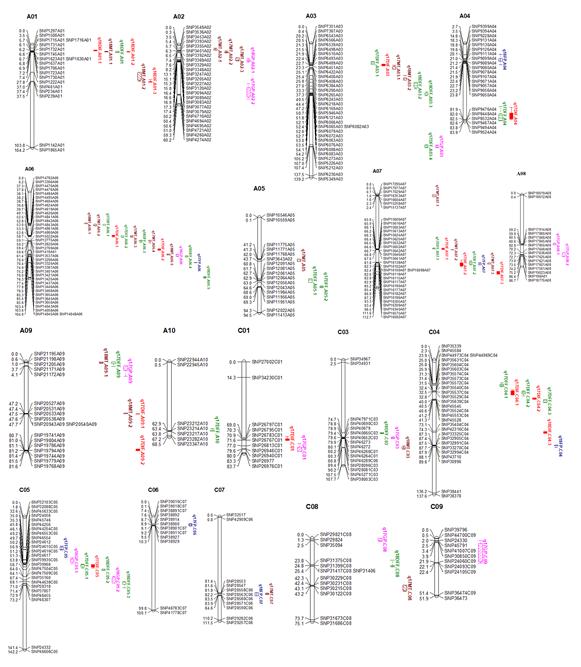
A total of 17, 25, 7, 21 and 13 QTLs for DIF, DFF, FP, MT and GP were detected in two years and were located on all B. napus chromosomes except C02 (Table S5 and Fig. S5). These QTLs for DIF, DFF, FP, MT and GP explained ~17.48%, ~15.92%, ~7.95%, ~18.30% and ~9.43% of the phenotypic variance, and the additive effect varied from –0.43 to 2.30, –1.12 to 1.79, - 0.83 to 0.71, –2.09 to 1.13, and from –0.70 to 1.10, respectively. The QTLs have the overlapped confidence intervals with the same direction of additive effect are considered to be the same QTL. Among the 83 QTLs, 14 QTLs were associated with at least two traits. The QTL q18DIF.A01–2, q18DFF.A01 and q18MT.A01–1 have the same QTL region and explained the highest total phenotypic variation of each trait. However, the additive values of DIF and DFF were positive, and the additive value of MT was negative, which indicates that the QTL from GH06 increased DIF and DFF, while the QTL from P174 increased MT. The QTL q17DIF.A06–1, q17DFF.A06–2, q17MT.A06–3 and the QTL q17DIF.A07–2, q17DFF.A07–2, q17FP.A07, q17MT.A07–3 also has the same region and opposite additive effect. These results indicate that the same QTL may have opposite effects on the different traits. Based on the rapeseed genome annotation and the physical locations of these QTL regions, a total of 75 Arabidopsis flowering homolog genes were identified (Table S6), and their location relative to the adjacent SNP markers is shown in Fig. 4.
Identification of DEGs for floral transition and flower development by RNA-sequencing
To identify candidate DEG transcripts controlling flowering time, we sequenced four RNA samples from leaves of early-flowering cultivar 18Z134 and late-flowering cultivar 18Z88 sampled at vegetative and reproductive development stages (EV, ER, LV and LR). Every sample had two replicates. 18Z134 and 18Z88 were selected from the above RIL population based on six years of field data. Their flowering time differences are shown in Table S7. The total reads, mapped and unique mapped reads to the reference B. napus genome are shown in Table S8. After removing low-quality sequences, 34,862,287 (86.32%) ~ 37,786,256 (90.79%) clean reads were successfully mapped to the genome using TopHat. Of these clean reads, 33,089,439 (81.93%) ~ 38,684,877 (85.93%) were uniquely mapped.
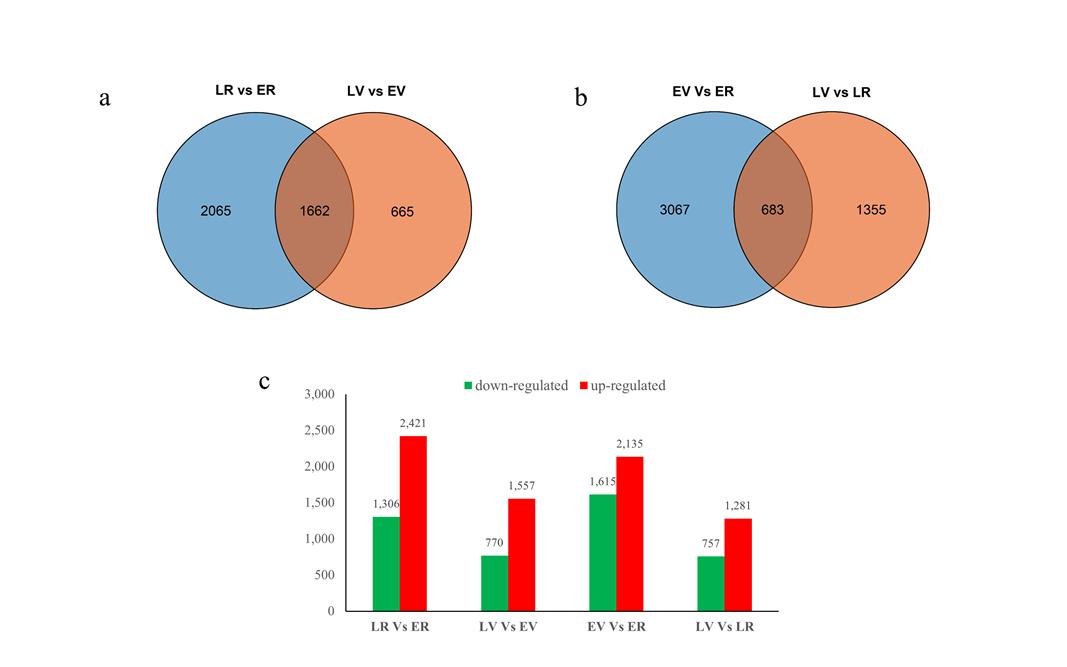
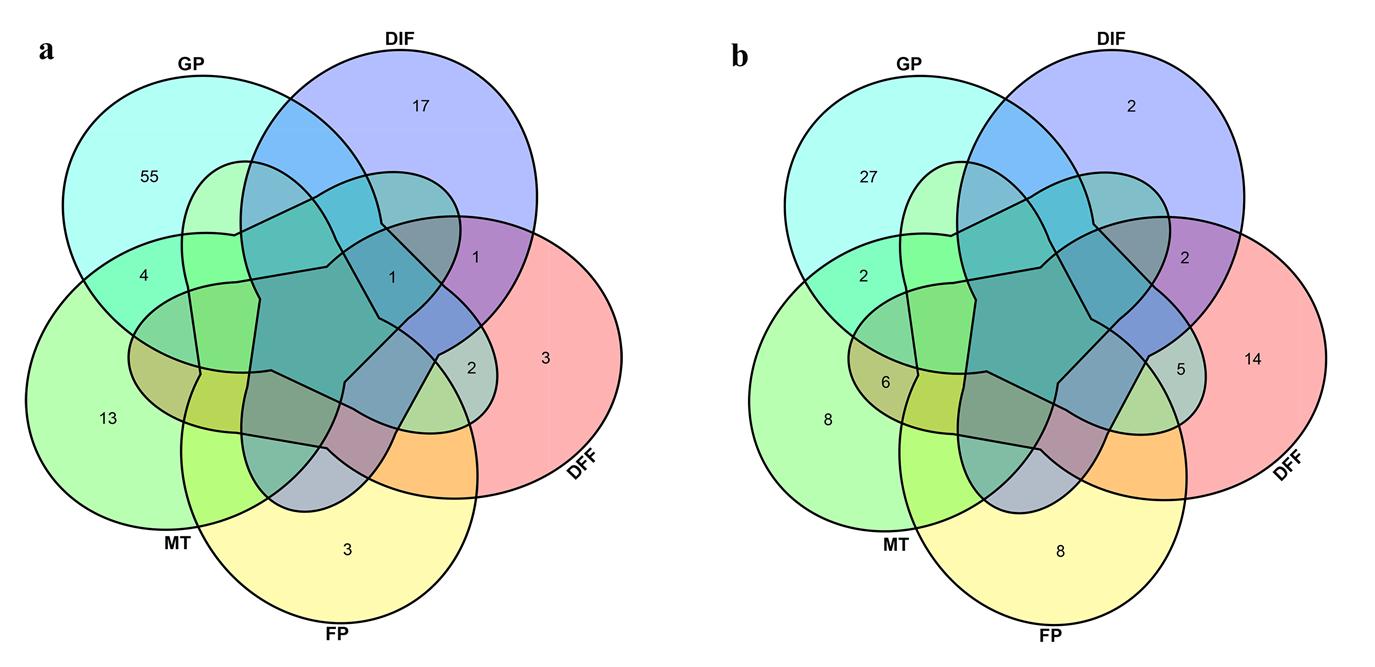
Two types of comparisons were performed: (1) to identify DEGs between the two extreme lines at each development stage: LR vs. ER and LV vs. EV; (2) to identify expression changes between different stages in each line: EV vs. ER and LV vs. LR. The false discovery rate (FDR) ≤ 0.05 and absolute value of |log2 (fold change) | ≥ 1 were used as thresholds to judge the DEGs between the two groups. In total, 3727 DEGs were identified in LR vs. ER (2421 upregulated, 1306 downregulated), 2327 DEGs were identified in LV vs. EV (1557 upregulated, 770 downregulated), 3750 DEGs were identified in EV vs. ER (2135 upregulated, 1615 downregulated), and 2038 DEGs were identified in LV vs. LR (1281 upregulated, 757 downregulated). In addition, 1662 and 683 DEGs were common to LR vs. ER/LV vs. EV and EV vs. ER/LV vs. LR, respectively (Fig. S6 and Table S9).
GO and KEGG analysis of differentially expressed genes
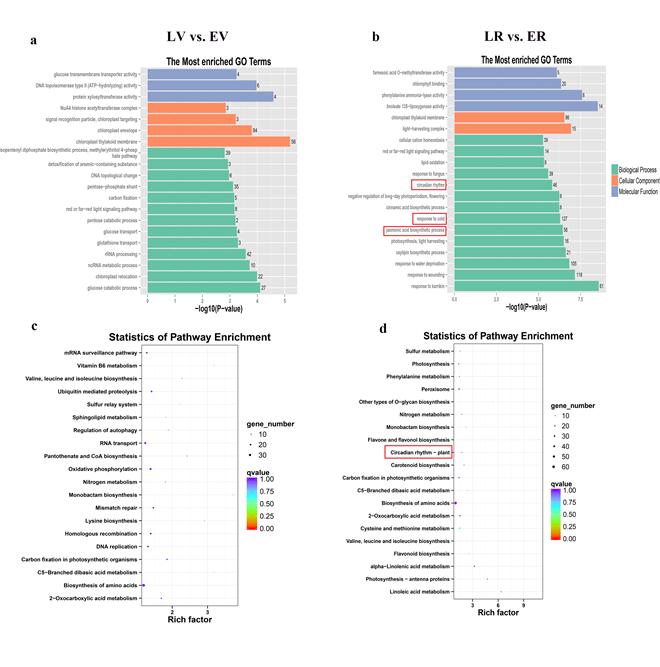
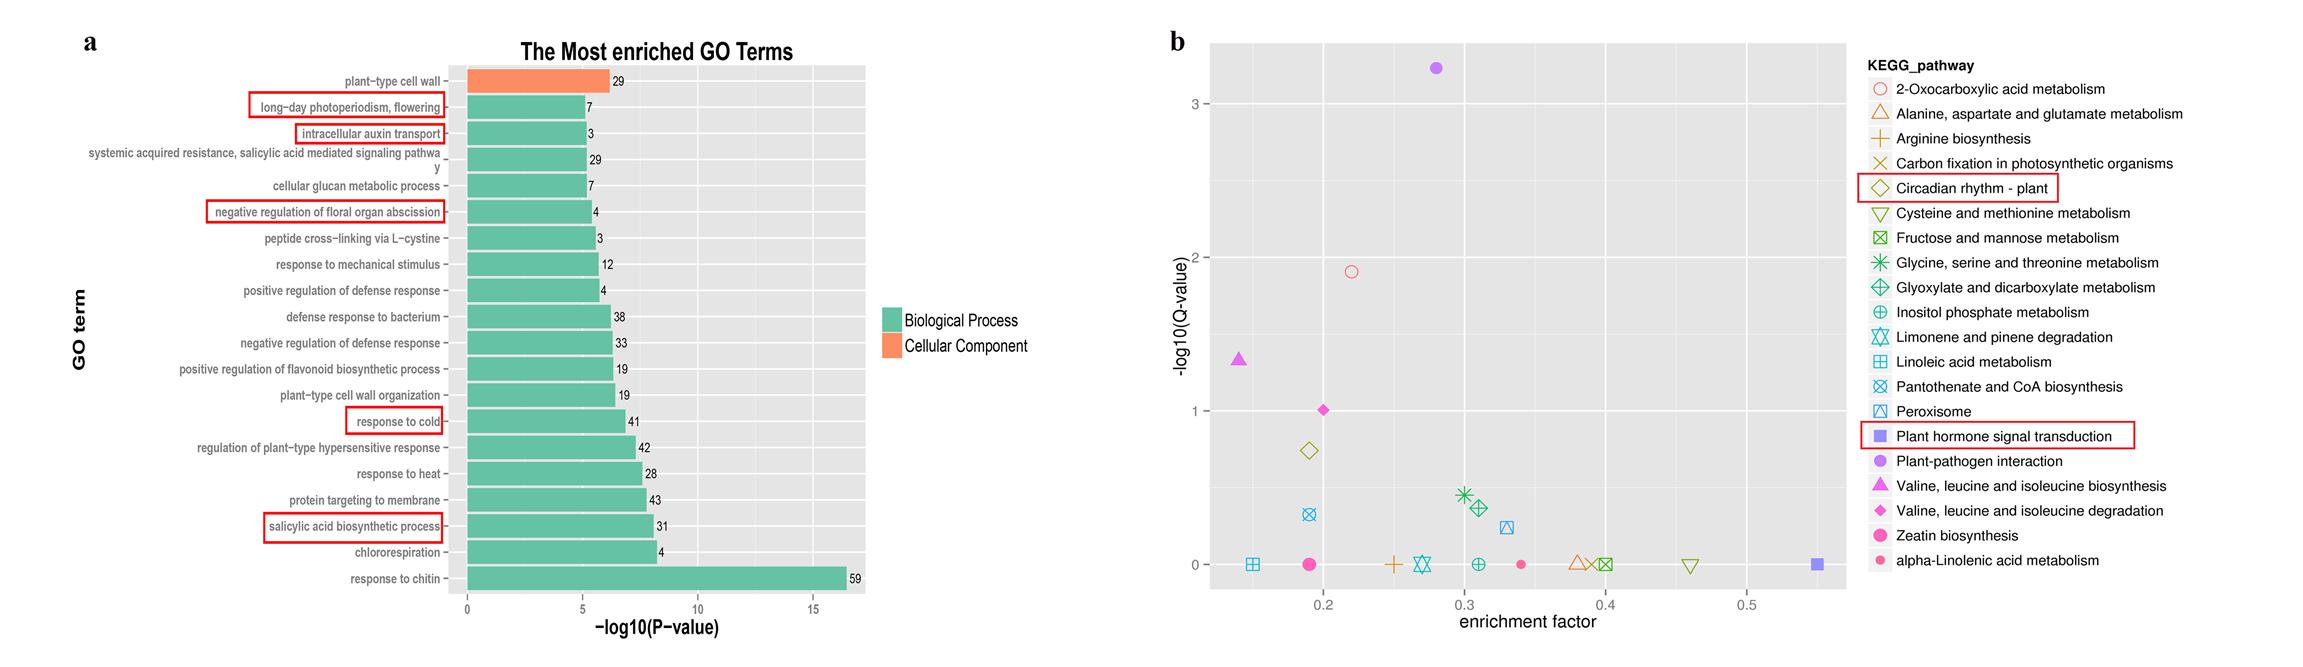
As the first criterion, we analyzed DEGs between vegetative and reproductive stages of development (EV vs. ER and LV vs. LR) to identify the key phase transition-associated genes. The 683 common DEGs between EV vs. ER and LV vs. LR were subjected to an enrichment analysis for GO annotation terms. The top 20 significantly enriched GO terms are shown in Fig. S7a and Table S10a. Among these terms, the salicylic acid biosynthetic process (GO:0009697), response to cold (GO:0009409), negative regulation of floral organ abscission (GO:0060862), intracellular auxin transport (GO:0080162) and long-day photoperiodism, flowering (GO:0048574) were involved in the phase transition process.
To further determine the metabolic pathways in the phase transition process, we performed KEGG enrichment analysis (Fig. S7b and Table S10b). Circadian rhythm–plant (ko04712) and plant hormone signal transduction (ko04075) were significantly enriched and participate in plant development and flowering processes. As the second criterion, we looked for DEGs between early-flowering and late-flowering lines that result in flowering time variation. The 2327 DEGs between LV vs. EV and 3727 DEGs between LR vs. ER were subjected to GO and KEGG enrichment analysis (Fig. S8). DEGs in the circadian rhythm were enriched in both GO and KEGG analysis between LR vs. ER, suggesting that the different expression of genes involved in circadian rhythm could result in flowering differences.
Identification of TFs involved in floral transition and flower development
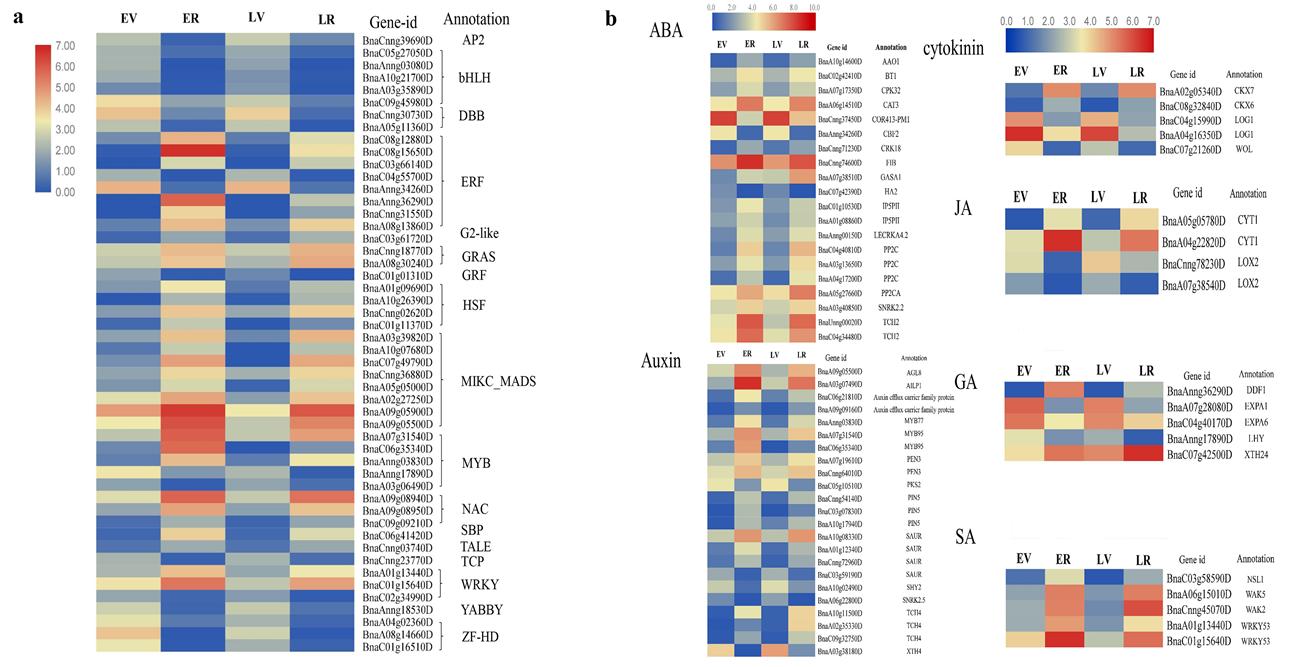
Transcription factors (SBP, AP2, MADS) play a central role in flowering development [20]. The MADS-box transcription factor is a major group of regulators controlling floral transition, floral organ specification and floral development in flowering plants [28]. In total, 50 TF-encoding DEGs, including the basic helix-loop-helix (bHLH, five members), ERF (eight members), MIKC_MADS (eight members), NAC (three members) and WRKY (four members), were identified in the early and late-flowering lines at two developmental stages. Fig. S9ashows the overall expression trend in the four samples, and most TF families were significantly upregulated in the reproductive stages.
Identification of DEGs involved in flowering-related hormone pathways
Plant hormones, such as auxin, cytokinin (CK), abscisic acid (ABA), gibberellic acid (GA), salicylic acid (SA), and jasmonic acid (JA), are involved in the floral transition process and plant flowering[29–31]. The effects of GA on flowering have been extensively studied in Arabidopsis [32, 33]. In total, 20 genes in the ABA signaling pathway, 23 genes in the auxin signaling pathway, five genes in the GA signaling pathway, five genes in the cytokinin signaling pathway, four genes in the JA signaling pathway and five genes in the SA signaling pathway were identified in our transcriptome data (Fig. S9b).
Identification of floral transition- and flowerdevelopment-related genes
According to the annotation of unigenes in Arabidopsis, a total of 125 DEGs related to flowering time were identified in the comparisons LR vs. ER, LV vs. EV, EV vs. ER and LV vs. LR (Table S11). These genes mainly included the photoperiod, circadian rhythms, vernalization, GA signaling, aging, flowering time integrator and flower meristem identity genes, and the expression value of these genes in the four samples is shown in Fig. 5.
In the photoperiod pathway, 36 unigenes homologous to EARLY FLOWERING 3 (ELF3),, EARLY FLOWERING 4 (ELF4),, CONSTANS-like 9 (COL9),, cycling DOF factor 1 (CDF1) and LATE ELONGATED HYPOCOTYL (LHY) were identified; the circadian rhythm, as an internal timekeeper, controls daily and seasonal changes, is an important part of the photoperiod pathway and plays a key role in controlling plant flowering [34]. Circadian clock associated 1 (CCA1) is a key component of the Arabidopsis circadian oscillator, and it interacts with LATE ELONGATED HYPOCOTYL (LHY) and TIMING OF CAB EXPRESSION 1 (TOC1) to inhibit transcription of the Evening Complex (EC) proteins ELF4 and ELF3. In the circadian clock pathway, two CCA1 genes, three TOC1 genes, two pseudo response regulator 7 (PRR7) genes and three pseudo response regulator 9 (PRR9) genes were included; For the aging pathway, eight unigenes, including SQUAMOSA PROMOTER-BINDING-LIKE PROTEIN 4 (SPL4),, SQUAMOSA PROMOTER-BINDING-LIKE PROTEIN 5 (SPL5),, SQUAMOSA PROMOTER-BINDING-LIKE PROTEIN 15 (SPL15) and TARGET OF EARLY ACTIVATION TAGGED 1(TOE1),, were found. Seven homologous genes of the GA signaling pathway were also identified, including GA2 oxidase (GA2ox, three unigenes), GA2 oxidase 1 (GA2ox1),, gibberellin 20-oxidase 3 (GA20OX3),, DELLA protein RGA-like 2 (RGL2),, and the GA receptor GA INSENSITIVE DWARF1A (GID1A);; Additionally, five unigenes were annotated in the vernalization pathway, which included the AGAMOUS-like 19 (AGL19),, INDUCER OF CBF EXPRESSION 1 (ICE1),, vernalization5/VIN3-like (VEL1) and REDUCED VERNALIZATION RESPONSE 1 (VRN1).. Furthermore, ten floral pathway integrator genes related to FLC, FLOWERING LOCUS T (FT),, AGAMOUS-like 20 (AGL20),, SHORT VEGETATIVE PHASE (SVP) and TWIN SISTER OF FT (TSF) and ten flowering meristem-identifying genes, such as AGAMOUS-like 8 (AGL8),, AGAMOUS-like 14 (AGL14),, AGAMOUS-like 24 (AGL24) and APETALA 2 (AP2),, were all identified in our transcriptome database. All these DEGs are important resources for the further study of floral transition and floral development in B. napus.
Identification of candidates for growth period traits by integrating QTLs with DEGs
To further understand the roles of these DEGs in regulating floral transition and flower development, the DEGs were integrated with the significant QTLs identified in either association analysis or linkage mapping. Therefore, the DEGs were considered candidate genes if they were located within the confidence interval (CI) of the QTLs identified by GWAS, linkage mapping, or both. According to the above criteria, a total of twelve DEGs located in the CI of sixteen significant loci were identified as candidate genes of growth period traits. The loci were BnaC04g15640D, BnaA03g40160D, BnaC06g15270D, BnaC09g05250D, BnaA04g22640D, BnaA05g05560D, BnaA05g05000D, BnaC09g48370D, BnaC02g36310D, BnaC09g23670D, BnaA03g39820D and BnaA05g05010D. The twelve DEGs were known to regulate floral development by affecting aging, photoperiod/circadian clock, GA, vernalization, flower development and meristem identity and flowering time integrator (Table 4 and Fig. 6). BnaAGL6.A05, which encodes a MADS-box transcription factor, negatively regulates the FLC/MAF clade genes and positively regulates FT in Arabidopsis [35]. Among them, BnaC06g15270D (BnaLNK2.C06),, BnaC09g48370D (BnaGA20OX3.C09) and BnaA03g39820D (BnaFUL.A03) were also identified as EDGs between BBCH20 and BBCH50 (vernalized and nonvernalized) associated with flowering time and yield QTLs [26]. In addition, an ortholog of the circadian clock pathway, BnaTOC1.A03 and floral meristem identity gene BnaFUL.A03 were identified in both GWAS and linkage analysis[36]. Thus, we considered these five genes to be our most promising candidate genes for future prospects.
To analyze the polymorphism and explore their relationship with five growth traits, the sequence variation was analyzed in the genomic sequence including the complete coding sequence and 2000 bp upstream of the ATG translational start codon in the twelve candidate genes in the 558 lines based on our resequencing data. Among twelve genes, seven genes had polymorphic sites: one, fifteen, four, five, one, three and ten SNPs were identified in the BnaFUL.A03, BnaELF4.A04, BnaSOC1.A05, BnaELF4.A05, BnaLNK2.C06, BnaTOC1.C09 and BnaGA20OX3.C09, respectively,and formed different types of haplotypes. Detailed haplotype information is listed in Table S12.
The association of each haplotype with five growth periods was then analyzed in the GWAS population. We compared the phenotypic variations of different haplotypes for the above agronomic traits (Fig. 7). In general, for BnaELF.A04, accessions with BnaELF.A04-Haplc accounted for 94.2% and showed a significantly shorter MT period in 2018 and 2019 compared to BnaELF.A04-Hapla. For BnaELF.A05, varieties with BnaELF.A05-Hapla accounted for 90.8% and showed the shortest FP compared to the other two haplotypes in 2017 and 2019. For BnaSOC1.A05, most accessions have BnaSOC1.A05-Haplb (97.5%) and exhibited shorter DFF and longer MT over three years compared to the Hapla. For BnaKNK2.C06, most varieties have BnaKNK2.C06-Hapla (93.7%) and showed lower DFF and GP than Haplb. For BnaTOC1.C09, accessions with BnaTOC1.C09-Haplc accounted for 94.1% and had lower DFF, lower FP and longer MT over three years. For BnaGA20OX3.C09, the two haplotypes did not exhibit significant differences between the five growth period traits. Zhou et al. (2017) reported that SNP alleles with positive effects on decreases in the values of DIF and DFF or on increases in FP were defined as ‘favorable alleles’ for earliness. Thus, the haplotype BnaSOC1.A05-Haplb and BnaLNK2.C06-Hapla showed more favorable phenotypic traits and may be used for further earliness molecular breeding.
Confirmation of candidate gene expression using qRT- PCR
To verify the accuracy and reproducibility of the transcriptome analysis, nine candidate genes listed in Table 6 were randomly selected for qRT-PCR analysis. As shown in Fig. 8, the expression of nine genes were consistent with the RNA-Seq results between four samples. These results demonstrated the reliability of the RNA-sequencing results.