Antibody changes pre- and post-immunization changes to antibodies, along with pre- and post-heat-stress changes to physiological indices
After the injection of Newcastle disease virus, antibody levels in heat-stressed SPF chicken rose at 7 d and 10 d post-immunization, antibody levels were significantly higher than pre-immunization levels, indicating immune response was ongoing. Moreover, acute heat stress did not appear to cause antibody changes immediately (Fig. 1A). Heat-stressed (36 ± 1ºC) chickens exhibited shortness of breath as a physical sign of experiencing high temperatures (Fig. 1B, C). They also had significantly higher concentration of H/L (P < 0.001) and corticosterone (P < 0.001) (Fig. 1D, E) and significantly lower concentration of CD4+/CD8+ (P < 0.001) than non-heat-stressed chickens (Fig. 1F), indicating a physiological stress response.
Gene expression differences in spleen and bursa of Fabricius tissues from different treatments
Across the spleen comparison groups (A and B), respectively, 22 (20 up-regulated, 2 down-regulated) and 35 (7 up-regulated, 28 down-regulated) differentially expressed genes were identified (q < 0.05). Of the 22 genes in A, 11 were functionally annotated (e.g., FGB, IGSF11, and ALDOB),, but the others were not. Expression differences were likely related to immune function in chickens. Of the 35 genes in B, 26 were functionally annotated (e.g., GZMA, STAR, and DUSP1) and 9 were not (Fig. 2A, B). Nonetheless, differential gene expression in Group B were likely associated with the immunoreaction in heat-stressed chickens.
In the bursa of Fabricius groups (C and D), 43 (12 up-regulated, 31 down-regulated) and 13 (5 up-regulated, eight down-regulated) genes, respectively, were differentially expressed (q < 0.05). Of the 43 genes in C, 16 were functionally annotated (e.g., MAP2, CD69, and MYL4) and 27 were not. And their differential expression may also be related to chicken immunity. Of the 13 genes in D, 9 were functionally annotated (e.g., ABCB1LB, COL21A1, and CD69) and 4 were not (Figure 2C, D).
GO enrichment analysis of differentially expressed genes in the spleen and bursa of Fabricius
Differentially expressed genes in spleen samples of Group A were enriched in the following biological processes: cellular protein complex assembly (4 genes, q < 0.05), platelet activation (3 genes, q < 0.05), and assembly of cellular macromolecule complexes (4 genes, q < 0.05) (Fig. 3A). In Group B, enriched biological processes included the assembly of cellular protein complexes (4 genes, q < 0.05), platelet activation (3 genes, q < 0.05), and protein aggregation (3 genes, q < 0.05) (Fig. 3B).
Differentially expressed genes in the bursa of Fabricius samples of Group C were enriched in the following biological processes: cellular processes (2 genes, q < 0.05), multicellular processes (1 genes, q < 0.05), and responses to stimuli (2 genes, q < 0.05) (Fig. 3C). In Group D, enrichment occurred in biological adhesion (1 genes, q < 0.05) and cellular processes (1 genes, q < 0.05) (Fig. 3D).
Differentially expressed genes associated with immune responses in the spleen and bursa of Fabricius
Six differentially expressed genes (including IGSF11, ALDOB, and APOB) were associated with spleen immune response after immunization. Their upregulation is associated with enhanced immunity, suggesting that immune raises disease resistance in chickens. Additionally, 15 differentially expressed genes (e.g., GZMA, DUSP1, and HSPA5) associated with immune response and heat stress were identified after 3 h of heat stimulation (Table 1). Their down-regulation is associated with reduced immunity, indicating the negative effects of heat stress on disease resistance in chickens.
In the bursa of Fabricius, CD69 was the only immune-response-related gene identified after immunization. After 3 h of heat stimulation, 3 more differentially expressed genes (COL21A1, CD69, and HSP90AB1) associated with immune response were detected (Table 1). Contrasting with results from spleen samples, these data indicated that the bursa of Fabricius is insensitive to heat stress and the vaccine used.
KEGG pathway analysis of differentially expressed genes in the spleen and bursa of Fabricius
The results of KEGG pathway analysis showed that the 22 differentially expressed genes in Group A were significantly enriched in 8 pathways (P < 0.05), including complement and coagulation cascades, pentose phosphate pathway, and fat digestion and absorption (P < 0.05). In Group B, 35 genes were enriched in 7 pathways, such as glutathione metabolism, complement and coagulation cascades, and chemokine signalling pathways (Table 2). We noted that the pathway of complement and coagulation cascades was found in both groups. These pathways involve proteins mediating immune and inflammatory responses. Thus, KEGG results suggested that the genes in Groups A and B are associated with immune responses, supporting known spleen function.
The 43 differentially expressed genes in Group C were not enriched in any pathway, whereas the 13 differentially expressed genes in Group D were significantly enriched in the following 2 pathways, synaptic vesicle cycle and protein digestion and absorption (Table 2). These results further emphasize that the bursa of Fabricius does not respond to heat stress or the selected vaccine.
Ingenuity Pathway Analysis (IPA) network formed by differentially expressed genes in the spleen and bursa of Fabricius
The results of an IPA network analysis on Group A’s 22 differentially expressed genes showed that they formed a significantly interactive gene network (Table 3), associated with cellular functions and maintenance, hematopoietic system development and function, as well as cell development. The 35 differentially expressed genes in Group B formed 2 significantly interactive gene networks (Table 3). The first was associated with neurological system development and function, cancer, as well as cardiovascular system development and function. The second was associated with cell motility, along with multiple immunity-related genes, including hematopoietic system development and functions, along with immune cell trafficking (Fig. 4). These networks in the spleen have strong association with immune response.
Group C’s 43 differentially expressed genes also formed two significantly interactive gene networks (Table 3). The first was associated with cell migration, along with cellular functions, maintenance, and behaviour, whereas the second was associated with cell-to-cell signal transduction and interactions, digestive system development and function, as well as liver development and function. The 13 differentially expressed genes of Group D formed a single significantly interactive gene network (Table 3), associated with cell-to-cell signal transduction and interactions, as well as cell growth, proliferation, and migration. In line with data from our other analyses, these networks in the bursa of Fabricius have no strong association with immune response.
RT-qPCR analysis of the differentially expressed genes
To verify sequence accuracy, 20 differentially expressed genes were randomly selected from Groups A–D for RT-qPCR verification. The results indicated different fold changes (FC) from the sequencing data, but consistent trends in differential expression (Table 4). Thus, the sequencing results appeared to be reliable.
The sequencing and RT-qPCR results all indicated that heat stress significantly decreased DUSP1 (sequencing: FC = 0.29, P < 0.01; RT-qPCR: FC = 0.45, P < 0.01) and HSPA5 (sequencing: FC = 0.52, P < 0.01; RT-qPCR: FC = 0.42, P < 0.01) mRNA expression from levels in the non-stressed group. Both KEGG and IPA analyses indicated that DUSP1 is involved in immune-related pathways, and many reports have shown that HSPA5 is associated with immune response. Thus, our subsequent experiments focused on verifying that DUSP1 and HSPA5 differential expression was associated with post-heat-stress immunity.
LPS stimulates immune response in chicken HD11 cells
Compared with the control group, mRNA levels of MHC-I (P < 0.01) and CD80 (P < 0.05) were very significantly or significantly increased at 4 h post-LPS stimulation. At 6 h post-stimulation, MHC-II (P < 0.01), IL1B (P < 0.05), IL6 (P < 0.05), TLR4 (P < 0.01), CD1C (P < 0.05), CD80 (P < 0.05), and CD86 (P < 0.01) mRNA levels were very significantly or significantly increased (P < 0.01) (Fig. 5A-H). LPS can induce immune response in chicken HD11 cells.
The effect of DUSP1 on LPS recognition in HD11
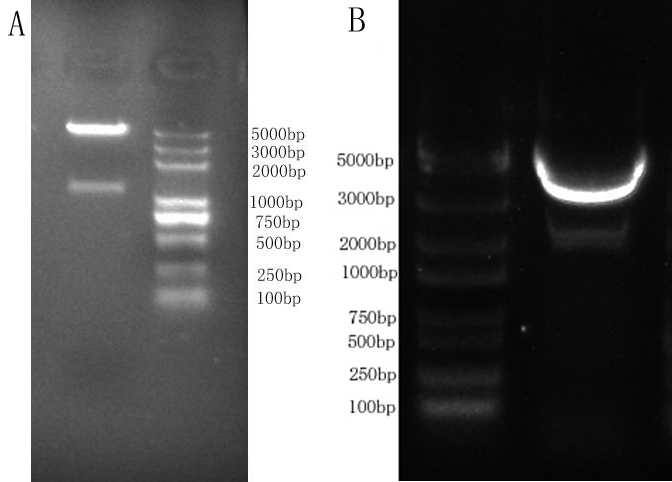
The full-length coding sequence (CDS) of DUSP1 is 1110 bp, and the pcDNA3.1 (+)-DUSP1 overexpression vector was confirmed via restriction enzyme digestion (Supplemental Fig. 2A). A 35-fold increase in mRNA (Fig. 6A) and an increased protein expression area (Fig. 6B) both clearly indicated DUSP1 overexpression and confirmed that the overexpression vector can express genes in HD11. Next, RT-qPCR results showed that the mRNA expression of MHC-I, MHC-II, CD80, and CD86 did not significantly differ before and after DUSP1 overexpression (Fig. 6C). Thus, intracellular DUSP1 overexpression does not influence macrophage activation without actual LPS addition.
Although DUSP1 overexpression did not affect macrophage activation, it could affect HD11 recognition of LPS. Upon DUSP1 overexpression, TLR4 (P < 0.01) expression was significantly up-regulated at 2 h after LPS stimulation (Fig. 6E). Moreover, a two-fold decrease in duration before TLR4 up-regulation occurred compared with LPS stimulation alone, indicating that HD11 recognition of LPS was enhanced with DUSP1 assistance. We also found that MHC-II (P < 0.01) mRNA levels increased significantly at 4 h after LPS stimulation (Fig. 6D), while mRNA levels of IL1B (P < 0.05)Fig. 6F), CD1C (P < 0.01) (glycolipid antigen presenting molecule) (Fig. 6G), CD80 (P < 0.05) (Fig. 6H), and CD86 (P < 0.05) (Fig. 6I) increased significantly at 2 h after LPS stimulation. This timing was earlier than under LPS stimulation only. Together, these data indicated that DUSP1 overexpression accelerates HD11 recognition of LPS and thus allows earlier LPS recognition, as compared with LPS stimulation alone.
The DUSP1 interfering fragment 724 (DUSP1–724) was able to inhibit DUSP1 expression at both mRNA and protein levels (Fig. 7A, B). After treatment with DUSP1–724, HD11 cells were stimulated with LPS, and the results within 6 h showed that MHC-I (Fig. 7C) and MHC-II (Fig. 7D) mRNA levels did not change significantly from LPS-stimulation-only levels. Thus, interfering with DUSP1 can inhibit MHC-I and MHC-II expression in LPS-stimulated HD11 cells. We also found that CD80 (P < 0.05) (Fig. 7E) and CD86 (Fig. 7F) mRNA expression was inhibited within 6 h post-LPS stimulation, followed by a significant decrease (also observed in and the mRNA expression of CD1C (P < 0.01) mRNA expression). In addition, we found that IL6 expression (Fig. 7H) failed to change significantly within 6 h post-LPS stimulation, suggesting a decreased ability of HD11 cells to secrete cytokines upon interference of DUSP1 expression. In summary, our data suggested that HD11 recognition of LPS is affected by DUSP1 expression levels. Thus, interfering with DUSP1 inhibits the ability of HD11 recognition LPS, causing downstream effects in the expression of other immune-related genes.
Effect of HSPA5 on the ability of HD11 to recognize LPS
The full CDS length of chicken HSPA5 is 1959 bp, and the pSDS-HSPA5 overexpression plasmid vector was confirmed with restriction enzyme digestion. We confirmed the successful construction of pSDS-HSPA5 through verifying a significant increase in HSPA5 mRNA and protein levels (Fig. 8A, B). We tested whether changes to intracellular HSPA5 expression can alter macrophage activation through fluorescent quantitative PCR. The mRNA expression level of intracellular MHC-I, MHC-II, CD80, and CD86 did not change significantly before and after HSPA5 overexpression (Fig. 8C), indicating that without LPS addition, HSPA5 overexpression does not affect macrophage activation.
However, HSPA5 overexpression affected LPS recognition by HD11. The mRNA levels (FC > 2) of MHC-I (P < 0.01), MHC-IIP < 0.01), CD80 (P < 0.05), CD86 (P < 0.01), CD1C (P < 0.05), IL1B (P < 0.05), IL6 (P < 0.01), and TLR4 (P < 0.01) (Fig. 8D - K) increased significantly at 2 h after LPS stimulation when HSPA5 was overexpressed, compared with LPS stimulation alone. This increase occurred far earlier than the timing of MHC-II expression after LPS stimulation alone. Together, these data combine to demonstrate clearly that HSPA5 can facilitate and accelerate HD11’s LPS recognition.
After using HSPA5 interfering fragment 183 (HSPA5–183) to interfere with HSPA5 expression (Fig. 9A, B), HD11 cells were LPS-stimulated. The results within 6 h showed that MHC-I (Fig. 9C) and MHC-II (Fig. 9D) mRNA levels did not change significantly, compared with LPS stimulation alone. Moreover, CD80 mRNA levels (Fig. 9G) were also inhibited within 6 h after LPS stimulation, whereas CD1C (P < 0.05) mRNA levels (Fig. 9E) decreased significantly at 2 h after LPS stimulation. We then found that IL6 mRNA (Fig. 9F) did not change significantly within 6 h post-LPS stimulation, nor did TLR4 mRNA (Fig. 9 H). In summary, these data allow us to propose that HD11 recognizes the rate of LPS is affected by HSPA5 expression levels, and interference with HSPA5 inhibits LPS recognition through inhibition of immune-related molecules (e.g., MHC, cytokines).