XRD
The X-ray diffraction (XRD) analysis is used to study for crystalline structure of pure g-C3N4 and 10 wt % loading of doped nanocomposite Sn-ZnO/g-C3N4 (TZO/CN), Ag-ZnO/g-C3N4 (SZO/CN), and Cd-ZnO/g-C3N4 (CZO/CN). The x-ray diffraction patterns are presented in Fig. 1. The peaks pertaining to the hexagonal wurtzite structure of zinc oxide, in nanocomposites matched well with JCPDS [57]. The peak at 27.50° appeared for the g-C3N4 sample corresponding to the plane (002) indicating the layered structure of CN. In addition, major alternations in crystalline patterns are not observed in diffraction patterns revealing the retention of the ZnO doping (metal oxides) lattice plane. The doped ZnO showed diffraction peaks at 27.50, 31.50, 34.40, 36.30, 45.50, 55.30, 62.30, 67.61 corresponding to lattice plane is (100), (101), (002), (102), (110), (103), (112) respectively. The g-C3N4 doped with 10wt% of (2 mol% Sn, Ag, Cd doped) bimetallic zinc oxides indicate the incorporation of dopants without alteration in the hexagonal wurtzite structure of ZnO.
Debye-Scherrer and Williamson-Hall Formula
The average nanocrystalline size was calculated using Debye-Scherrer’s formula:
$$\text{D}=\frac{K\lambda }{\beta \text{C}\text{o}\text{s} {\theta }}$$
Where D = Crystalline size, K = shape factor (0.9), \(\lambda\) = wavelength of Cuk\(\alpha\) radiation from the calculations.
Williamson- Hall Equation
$${\beta }\text{h}\text{k}\text{l}\text{C}\text{o}\text{s}{\theta }=\frac{K\lambda }{D}+4{\epsilon } \text{s}\text{i}\text{n}{\theta }$$
$${\beta }\text{C}\text{o}\text{s}{\theta }=\frac{0.9\lambda }{\text{D}}+4{\epsilon } sin\theta$$
\(\beta\) is a full-width half maximum of XRD peaks, \(\theta\) is Bragg angle, D is crystalline size, and \({\epsilon }\)is the average microstrain. The Williamson Hall plots were obtained by plotting \({\beta }\text{C}\text{o}\text{s}{\theta }\) and 4 sin\(\theta\) in the y and x axis respectively [58]. Plot drawn 4sin\(\theta\) in x-axis and \({\beta }\text{c}\text{o}\text{s}{\theta }\) along the y-axis as prepared for ZnO nanoparticles crystalline size was determined from y-intercept and strain \({\epsilon }\) from the slop fit. The final results indicate a slope for linear lattice strain for the W-H formula.
Table 1
Lattice parameter of lattice strain and crystalline size g-C3N4 and metal oxides with ZnO using Scherrer and Williamson-Hall method.
| Material | Lattice Parameters | Volume (nm3) | Crystalline size (nm) (Scherrer equation) | Crystalline size (nm) (W-H equation) |
| a (A°) | c (A°) | c/a |
| g-C3N4(VSA01) | 1.54 | 6.47 | 4.18 | 13.79 | 87.17 | 159.13 |
| SZO/g-CN (VSA02) | 1.49 | 6.48 | 3.48 | 10.92 | 90.43 | 42.71 |
| AZO/g-CN (VSA03) | 1.54 | 6.47 | 3.63 | 11.62 | 89.19 | 96.54 |
| CZO/g-CN (VSA04) | 1.58 | 6.46 | 3.56 | 12.22 | 88.54 | 42.71 |
UV- Visible Spectroscopy
The optical properties and optical band of the nanocomposites were investigated by UV-vis reflectance and absorbance spectra. Figure 2(a) shows UV-Vis spectra bimetallic ZnO doped in g-C3N4 and Fig. 2(b) shown in the Tauc plot deals with optical band gap energy level. The synergistic relationship between ZnO/ g-C3N4 composite and tin and silver, cadmium-doped zinc oxide containing g-C3N4 nanocomposites is consistent with the report [59]. Pure and doped ZnO showed an absorbance range of 350–400 nm. The due to absorption in the proximity of 450 nm is increasing significantly in the g-C3N4 loaded metal oxides nanocomposite, indicating a reduction band gap to 2.7 eV, which has been enhanced with the applied load of the g-C3N4 layer with the 4d metal oxides. To obtain the exact direct optical bandgap of all samples, Tauc’s plots were evolved by extrapolating the linear portion, absorption coefficient plotted with incident photon energy (hv).
The doped ZnO-loaded g- C3N4 from the optical bandgap was found to be 2.70 eV and had an ultraviolet absorption maximum of about 400 nm. This composite doping material used has the highest visible light absorption, which increases the generation of electron-hole pairs when exposed to light, resulting in higher photocatalytic properties [60]. Figure 2(b) explains for optical band gap energy level (Tauc’s plot) with tin-doped zinc oxide with g-CN (VSA02), silver-doped with zinc oxide with g-CN (VSA03), and cadmium-doped zinc oxide (VSA04) all the samples band gap energy level is 2.71, 2.76 and 2.41 eV. The 2.90 to 2.70 eV decrease to energy level loading to the metal oxides. The UV-Vis investigations indicate that the incorporation of reduced energy level has the highest photocatalytic activity of g-C3N4 doped metal oxide materials.
Table 2
Absorption maximum values, optical bandgap values FT-IR regions, and elemental composition.
| Material | Absorption maxima (I, nm) | Optical band gap (eV) | Wave number (cm− 1) | FT-IR | Weight (%) | Atomic (%) |
| g-C3N4 | 385 | 2.76 | 690–800 | C-N | C- 31.67 N-68.33 | C- 35.09 N- 64.91 |
| 10wt% of Sn-ZnO- g-C3N4 | 370 | 2.78 | 690–800 1120–1250 | C-N Sn-ZnO | C- 33.18 N- 45.02 O- 14.74 Zn- 6.87 Sn- 0.18 | C- 39.44 N- 45.88 O- 13.15 Zn- 1.50 Sn- 0.02 |
| 10wt% of Ag-ZnO-g-C3N4 | 365 | 2.77 | 690–800 1120–1250 | C-N Ag-ZnO | C- 29.46 N- 46.00 O- 17.22 Zn- 7.27 Ag- 0.05 | C- 35.42 N- 47.43 O- 15.54 Zn- 1.61 Ag- 0.01 |
| 10wt% of Cd-ZnO/g-C3N4 | 380 | 2.74 | 690–800 1120–1250 | C-N Cd-ZnO | C- 30.71 N- 18.94 O- 24.85 Zn- 24.78 Cd- 0.72 | C- 43.72 N- 23.13 O- 26.56 Zn- 6.48 Cd- 0.11 |
FT-IR analysis of nanocomposites
FT- IR transmittance spectra of doped ZnO/g-CN nanocomposites recorded between 400 and 4000 cm − 1 pure g-C3N4 and doped with 10 wt % of Sn/ZnO, Ag/ZnO, Cd/ZnO are given in Fig. 3. The peaks revealed from 690–800 cm− 1 are due to the rocking and stretching vibration modes of g-C3N4 with Zinc oxide nanocomposites. The metal-metal oxide in the sharp peak range is 820 cm− 1 and broad peaks are presented in 1120–1250 cm− 1. The peaks at 1530–1645 cm− 1 were attributable to C-N stretching and vibrations modes, although 1240, 1320, 1380, 1520, and 1630 cm− 1 to C-N aromatic stretching (Jia et al, 2012). The FT-IR spectra of g-C3N4/ZnO, similar to the main peaks of the g-C3N4 are shown in spectra. The peaks found between 3000 and 3300 cm− 1 belong hydroxyl group and are identified as stretching vibration in zinc oxide lattice.
SEM –EDX Analysis
The surface morphology of synthesized nanocomposites was investigated through SEM analysis. The SEM images of synthesized g-C3N4 and doped with 10 wt% of metal oxides such as SZO, AZO, and CZO of nanocomposites were given in Fig. 4. Pure g-carbon nitride reflects an aggregated particle which gives a large sheet-like structure. The layered surface area of the aggregation is very smooth. After the encapsulation of Sn, Ag, and Cd nanocomposite morphology was not affected. SEM images the nanocomposites 10 µm and 1 µM is shown in Fig. 4 viz (a, b) g-CN, (c, d). SZO/gCN, (e, f). AZO/gCN, (g, h). CZO/gCN.
EDS mapping of the nanocomposites is shown in Fig. 5 and elemental composition values are summarised in Table 2. All the nanocomposites showed the presence of C, N, Zn and O elements along with dopants Sn, Ag and Cd in the respective EDS mapping (Fig. 5b, 5c and 5d).
Depolymerisation of PET using Aminolysis and Glycolysis
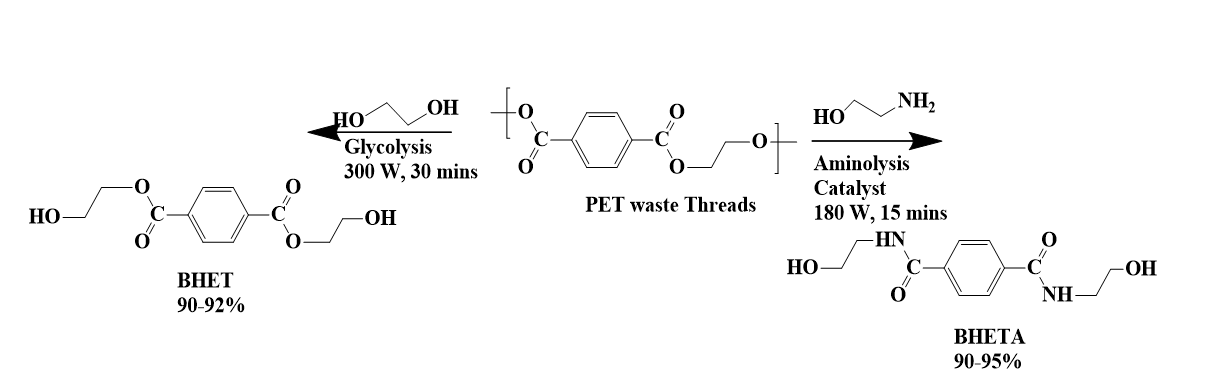
Aminolysis and glycolysis is general depolymerization reaction for managing PET wastes. The ethanolamine and ethylene glycol have been used for PET waste threads depolymerization to give product bis(2-hydroxy ethylene) terephthalamide (BHETA) and bis (2-hydroxy ethylene) terephthalate (BHET) respectively. Heterogeneous catalysts have more advantages than homogeneous catalysts. In this investigation we have used 10 wt % of SZO (2 mol % Ag doped ZnO), TZO (2 mol % Sn doped ZnO), and CZO (2 mol % cd doped ZnO) have been supported over g-C3N4. The g-C3N4 is a sheet-like π-conjugated system comprised of carbon and nitrogen. It is capable of absorbing light in the visible region (400–425 nm). The presence of nitrogen lone pair is having as well as cavity generated during polycondensation of melamine and acts as a carrier site for holding Lewis acidic doped ZnO nanoparticles. The purpose of making doped nanocomposite with g-C3N4 is to achieve degradation dyes as well as depolymerization of PES-coloured threads in a one-pot reaction.
Bimetallic Zinc oxide and graphene carbon nitride nanocomposite are generally Lewis acid in character. The carbonyl group of PET is attracted by Zinc oxide. Sn-ZnO/g-C3N4 is enhanced catalytic activity to be obtained for BHETA and BHET final product. The glycolysis and aminolysis of PET threads using ethylene glycol (EG) and ethanolamine (EA) were optimized with respect to: 1) PET to EA/EG ratio, 2) Catalyst to PET ratio, and 3) the ability of catalyst recycling.
The glycolytic depolymerization led to monomer bis (hydroxyethyl) terephthalate (BHET) and aminolysis depolymerization led to monomer bis (hydroxyethyl)terephthalamide (BHETA) the final product was isolated from both aminolysis and glycolysis reaction, the compound is confirmed by 1H and 13C NMR, FT-IR, MS techniques.
Effect of Catalyst
The investigations of pure g-C3N4 catalyst with 10wt% of different metal oxides (Tin, Silver, Cadmium) doped with ZnO respectively (Fig. 6a). PET color threads (red, blue, green) were taken 1g and the catalyst was taken 100 mg at the PET to Catalyst ratio (10:1) to proceed depolymerization chemical recycling process in MW condition. The catalyst was aminolytic and glycolytic reactions are highest percentage of aminolysis monomer compound BHETA and glycolysis depolymerized product BHET yield obtained for this PET catalyst combination are better results compared to other ratios.
Effect of MW power
PET waste thread decomposition in variable microwave radiation has been used to study the effect of MW power (Fig. 6b). The 6 MW power value from 80 to 300 W was used for aminolytic and glycolytic irradiation 180 W and 300 W optimized. All the irradiation reaction mixture irradiated for 30 minutes yield is noted. At the lowest power, 100 W (60–80°C) of very slow conversion PET degradation and yield is obtained. When 180 W (140–150 ˚C) power range is used for complete PET decomposition within 5 min for aminolysis. The aminolysis PET depolymerization MW power irradiation is in the range of 150–180 W to increase the yield of BHETA up to 95%. A similar procedure is followed for glycolytic PET depolymerization MW power irradiation range is varied from 100, 180, and 300 W. The lowest power 100 W used for PET degradation was only 50% yield obtained. When 300 W power range irradiation of PET is completely dissolved and highest yield of BHET was obtained. The glycolysis reaction 300 W (180–200°C) is the optimal parameter range for following the glycolytic test.
Effect of PET to solvent ratio
The effect of PET to solvent ratio was studied using 1g of PET thread and 50 mg of nanocomposite catalyst with variable amounts of EA and EG (Fig. 6c). The amount of PET is kept Constant at 1g and aminolytic, and glycolytic solvent is increased (5, 10, 15, 20, 25 mL) and optimum 180 W and 300 W microwave irradiation for aminolysis and glycolysis respectively. The yield is aminolysis product obtained about 50, 62, 74 87, and 95% glycolysis product obtained was 46, 53, 67, 85, and 92% respectively for 5, 10, 15, 2,0, and 25 mL of EA and EG both aminolysis and glycolysis reaction.
Effect of irradiation Time
With respect to reaction time (irradiation time), PET waste depolymerization under microwave irradiation through aminolysis and glycolysis reaction have been studied (Fig. 6d). For aminolysis using ethanolamine EA 20 ml and 180 W and 100 mg of TZO/ZnO catalyst have been used at variable irradiation times and the complete PET waste threads depolymerization under microwave irradiation and observed time range of 5, 10, 15, 20, and 25 min. The 10–15 min the PET was completely dissolved 65 to 90%. PET waste was completely (100%) dissolved after 15 min and BHETA was 95% yield obtained. A similar procedure as follows glycolytic agent ethylene glycol (EG) PET decomposistion process reaction time is variation compared to aminolysis reaction. Glycolysis PET decomposition time range is 5, 10, 1, 2, and 3 hr for irradiation timing. The glycolysis PET is 100% completely depolymerized in 1 hr with a high yield of BHET. This showed aminolysis and glycolysis completed depolymerization time has been found in major factors.
Catalyst Recycling
The Sn-ZnO and g-C3N4 loaded to the catalyst was investigated in recycling studies using aminolysis and glycolysis reaction (Fig. 6e). After complete PET decomposition of microwave irradiation. The next step is the catalyst separation process using Whatman filter paper, The catalyst is filtered, washed with deionized water, and dried in a hot air oven at 80°C before the next reaction cycle. The main concept for this study catalyst can be re-useable up to 6–9 cycles with more than 90% yield. The 2 mol% of SZO doping g-C3N4 catalyst has better activity compared to other metal-doped catalyst. The SZO/g-C3N4 catalyst investigated analysis of XRD, UV-Vis, FT-IR, SEM – EDX analysis.
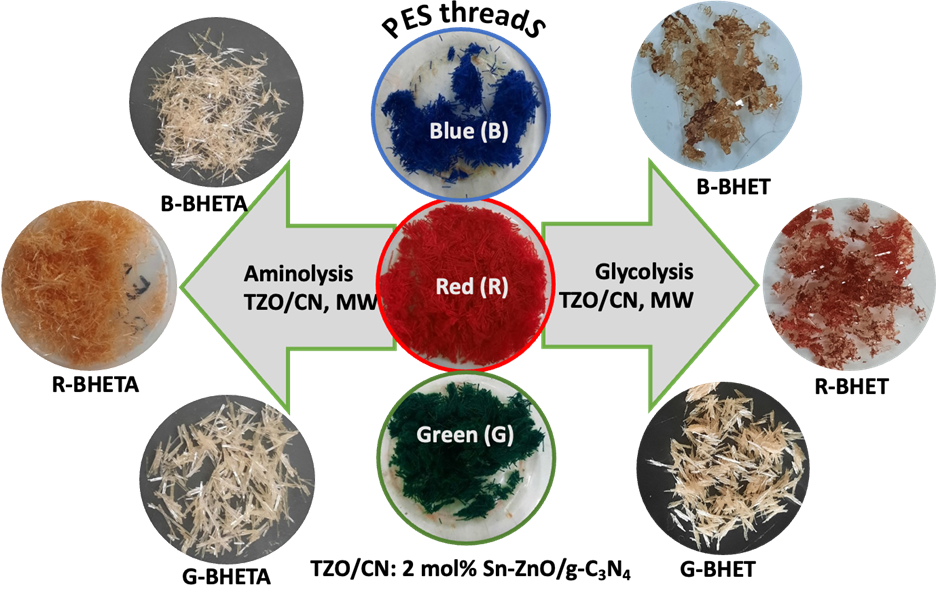
The depolymerization of red, blue, and green PES threads by aminolysis and glycolysis
Figure 7 depicts the depolymerization of the red, blue, and green color PES threads using ethylene glycol and ethanol amine catalyzed by pure CN, TZO/CN, SZO/CN, and CZO/CN under microwave irradiation. Aminolytic and glycolytic depolymerization was carried out using the procedure outlined in the experimental section. For about 1 g of PES thread dissolved in 20 mL ethanol amine and ethylene glycol at 140 ˚C (microwave power: 180 W) and 180 ˚C (microwave power 300 W) respectively and 50 mg CN, TZO/CN, SZO/CN, and CZO/CN were added. For aminolysis, the reaction mixture was irradiated for about 15 minutes and proceeded for the isolation of the product. Except for the red PES thread, the blue and green colored threads were completely depolymerized and decolorized to give white to pale yellow crystals with more than 95% yield. The blue and green color threads were completely dissolved in EA medium and degraded after 10–15 cycles of MW irradiation. Particularly, the blue threads turned into reddish pink and green threads turned into dark yellow and after the addition of 50 ml of hot water, the catalyst was recovered by filtration. After a few hours colorless needle-shaped crystals were formed (Fig. 7). From the weight of the crystals, the conversion of PET and yield of BHETA was calculated to be 100 and 90–95% respectively. Both blue and green threads were completely depolymerized and degraded in the presence of pure CN and bimetallic ZnO-doped CN. By following a similar procedure, the glycolysis of red, blue, and green PES threads was carried out in EG at 180–200°C (microwave power: 300 W). After the completion of the reaction and recovery of the catalyst, the reaction mixture was diluted with water and extracted with chloroform. The final product, BHET appeared as dark red to pale red for red, blue, and green color PES threads. Nevertheless, the depolymerization of PES threads occurred irrespective of the colors and afforded 90–92% of BHET. It is observed that aminolysis of colored threads was found to be more efficient when compared with glycolysis. On the other hand, CZO/CN and SZO/CN yielded pure white crystals for blue and green threads and pale yellow color for red PES threads.
Spectral analysis of BHETA and BHET
BHETA and BHET are characterized by FT-IR, 1H, 13C NMR, and MS analysis. The FT-IR analysis of BHETA and BHET spectral data is given in Fig S1(a) and (b) (Full spectrum analysis given in supplementary information). NMR analysis of BHETA and BHET is shown in Fig S2 and S3, respectively. The ESI-MS spectrum of BHETA and BHET is given in Fig S4(a) and (b) respectively.
FT- IR spectrum of BHETA
The FT- IR spectra of depolymerized monomer, bis(2-hydroxy ethyl)terephthalamide (BHETA) are shown in Figure S1(a). The spectrum of BHETA shows various absorption bands due to the presence of different stretching and bending vibration modes. The FT-IR spectrum was recorded at 400-4000cm− 1. According to the FT-IR spectra of BHETA stretching of N-H was observed at 3291cm− 1. Hydroxyl group stretching and vibrations broad peak was confirmed at 3364 cm− 1. The aromatic C-H and aliphatic –CH2- stretching vibrations broadband was presented at 2852 and 3088cm− 1. The sharp vibrations peak at 837 and 891 is corresponds to N-H bond formation. 1556 cm− 1 sharp peak is presented the aromatic -C = C- stretching and vibrations. The amide linkages (-CONH-) is presented as a sharp peak at 1629 cm− 1. The aliphatic -CH- stretching and vibrations peak is presented at 1053 cm− 1. These hydroxyl (-OH) and amide (-NH) stretching and vibrations was confirmed BHETA aminolysis depolymerized single monomer compound [61, 62]
FT-IR spectrum of BHET
FT-IR spectrum shown in Fig S1(b) is monomer, bis(2-hydroxy ethyl) terephthalate (BHET) obtained from glycolysis. The hydroxyl (OH) group is presented at 3343 cm− 1. The C-H alkyl stretching vibrations peaks indicated at 2854–2924 cm− 1. The ester carbonyl (C = O) group is presented at 1715 cm− 1. The aromatic C = C stretching observed at 1457 cm− 1. Peaks at 1286 and 1074 cm− 1 is pertaining to asymmetric stretching vibrations of C-O bond. The characteristic stretching vibrations were confirmed BHET [63, 64, 65].
1 H NMR spectrum of BHETA and BHET
1H NMR of BHETA is given in the supplementary information Figure S2(a). The BHETA molecule is symmetrical and the four aromatic hydrogens (C1, C2, C4 and C5) appeared as a singlet at 7.93 ppm, which confirming complete the depolymerisation of PES to form BHETA. A triplet shown between 8.55–8.59 ppm with J value 8.0 Hz indicates the presence of two amide N-H protons linked to carbonyl (C = O) (C7 and C8) and the methylene group (C9, C10). The -OH protons of the alcoholic group attached to C12 and C11 are observed as a broad singlet at 4.77 ppm. In the case of BHETA, the two hydrogens attach to carbon immediately after the amide N-H, appeared as triplet at 3.31–3.44 ppm. At 3.51–3.55 ppm, two hydrogens attached to carbon next to OH is shown up as a triplet. Two hydroxyl protons appeared as broad singlet at 4.77 ppm. Based on the 1H NMR, the appearance of -N-H and -O-H protons appears to confirm that the BHETA is formed by 2-amino ethanol attached to a terephthalaoyl group. The singlet at 2.52 ppm is due to DMSO-d6.
Fig S3(a) is 1H NMR spectrum of bis(2-hydroxyethyl)terephthalate (BHET). The aromatic protons (C1, C2, C5 and C6) appeared as singlet at 8.14 ppm. The protons of the methylene group (-CH2-) (C9 and C10) neighboring to the hydroxyl group -OH- appeared as doublet at 3.72 ppm and doublet at 4.48 ppm indicate the protons of the methylene group (C8 and C7) attached ester (-COO-) group. The hydroxy protons attached to C9 and C10 appeared as triplet at 4.99–5.01 ppm. The appearance of the singlet peak due to aromatic protons confirm the formation of BHET. The DMSO-D6 and H2O peaks appeared at 2.51 and 3.40 ppm, respectively.
13 C NMR spectrum of BHETA and BHET
In the supplementary information, the 13C NMR spectrum of the aminolyzed product, BHETA, is shown Figure S2(b). At 166.18 ppm, the amide carbonyl carbon of BHETA, indicating the symmetrical nature of the BHETA single product. Since BHETA is a symmetrical molecule, two aromatic carbons were detected at 137.14 and 127.60 ppm. The peak at 137.14 ppm corresponds to C3 and C6 attached to amide carbonyl, and the peak at 127.60 ppm corresponds to C1, C2, C4, and C5 attached to hydrogen, both of which appeared in 1:2 ratio indicating 2:4 ratio of aromatic carbons. At 42.71 ppm, BHETA showed C9 and C10 methylene carbons of the aliphatic chain attached to amide -NH-. The methylene carbons C11 and C12 attached to hydroxyl group and methylene group appeared at 60.10 ppm.
13C NMR spectrum of BHET is shown in the supplementary material, Figure S3(b). The ester carbonyl carbon of BHET appeared at 165.65 ppm, revealing a single ester carbonyl present in the structure and no other carbonyl carbons, confirming the presence of BHET as a single product. Because BHET is a symmetrical molecule, two aromatic carbons were detected at 134.22 and 129.99 ppm. The peak at 134.15 ppm values correspond to C3 and C6 attached to ester carbonyl, and the peak at 129.93 corresponds to C1, C2, C4, and C5 connected with aromatic hydrogen, both of which appeared as singlet in 1:2 ratio as appeared in BHETA. The methylene carbons (C7 and C8) of the aliphatic chain attached to the ester carbonyl oxygen were detected in BHET at 67.43 ppm. The hydroxyl group attached methylene carbons (C9 and C10) have been detected at BHET at 59.46 ppm. We also detected the peak at 63.70 ppm is due to the presence of ethylene glycol [5, 66].
Mass Spectrum of BHETA and BHET
The mass spectrum of BHETA is shown in Figure S4(a) of supplementary information. The formation of BHETA identified from the molecular ion peak observed mass spectrum. The mass spectrum showed a molecular ion peak at m/z 251.15 that indicated molecular weight of BHETA. The mass spectrum of BHET is given in supplementary information Figure S4(b). The BHET mass spectrum showed molecular ion peak at m/z 255.15 revealed the formation of BHET. Both the mass spectrum showed the molecular ion peak with respect to the monomers as well as absence of any other peaks pertaining to dimers or hydrolysed products revealed that the monomers BHETA and BHET are formed exclusively.