Background
Whereas several engineered nanomaterials are able to incite toxicological effects, the underlying molecular processes are understudied. And the varied physicochemical properties complicate toxicological predictions. Gene expression data allow us to study the cell-specific responses of individual genes, whereas their role in biological processes is harder to interpret. An overrepresentation analysis allows us to identify enriched biological processes and link the experimental data to these, but still prompt broad results which complicates the analysis of detailed toxicological processes. We demonstrated a targeted filtering approach to compare the cell-specific effects of two concentrations of the widely used nanomaterial titanium dioxide (TiO2) -nanobelts.
Methods
We compared public gene expression data generated by Tilton et al. from colon endothelium cells (Caco2), lung endothelium cells (SAE), and monocytic like cells (THP1) after 24-hour exposure to low (10 μg/ml) and high (100 μg/ml) concentrations of TiO2 -nanobelts. We used pathway enrichment analysis of the WikiPathways collection to identify cell and concentration-specific affected pathways. Gene sets from selected Gene Ontology terms (apoptosis, inflammation, DNA damage response and oxidative stress) highlighted pathways with a clear toxicity focus. Finally, pathway-gene networks were created to show the genetic overlap between the altered toxicity-related pathways.
Results
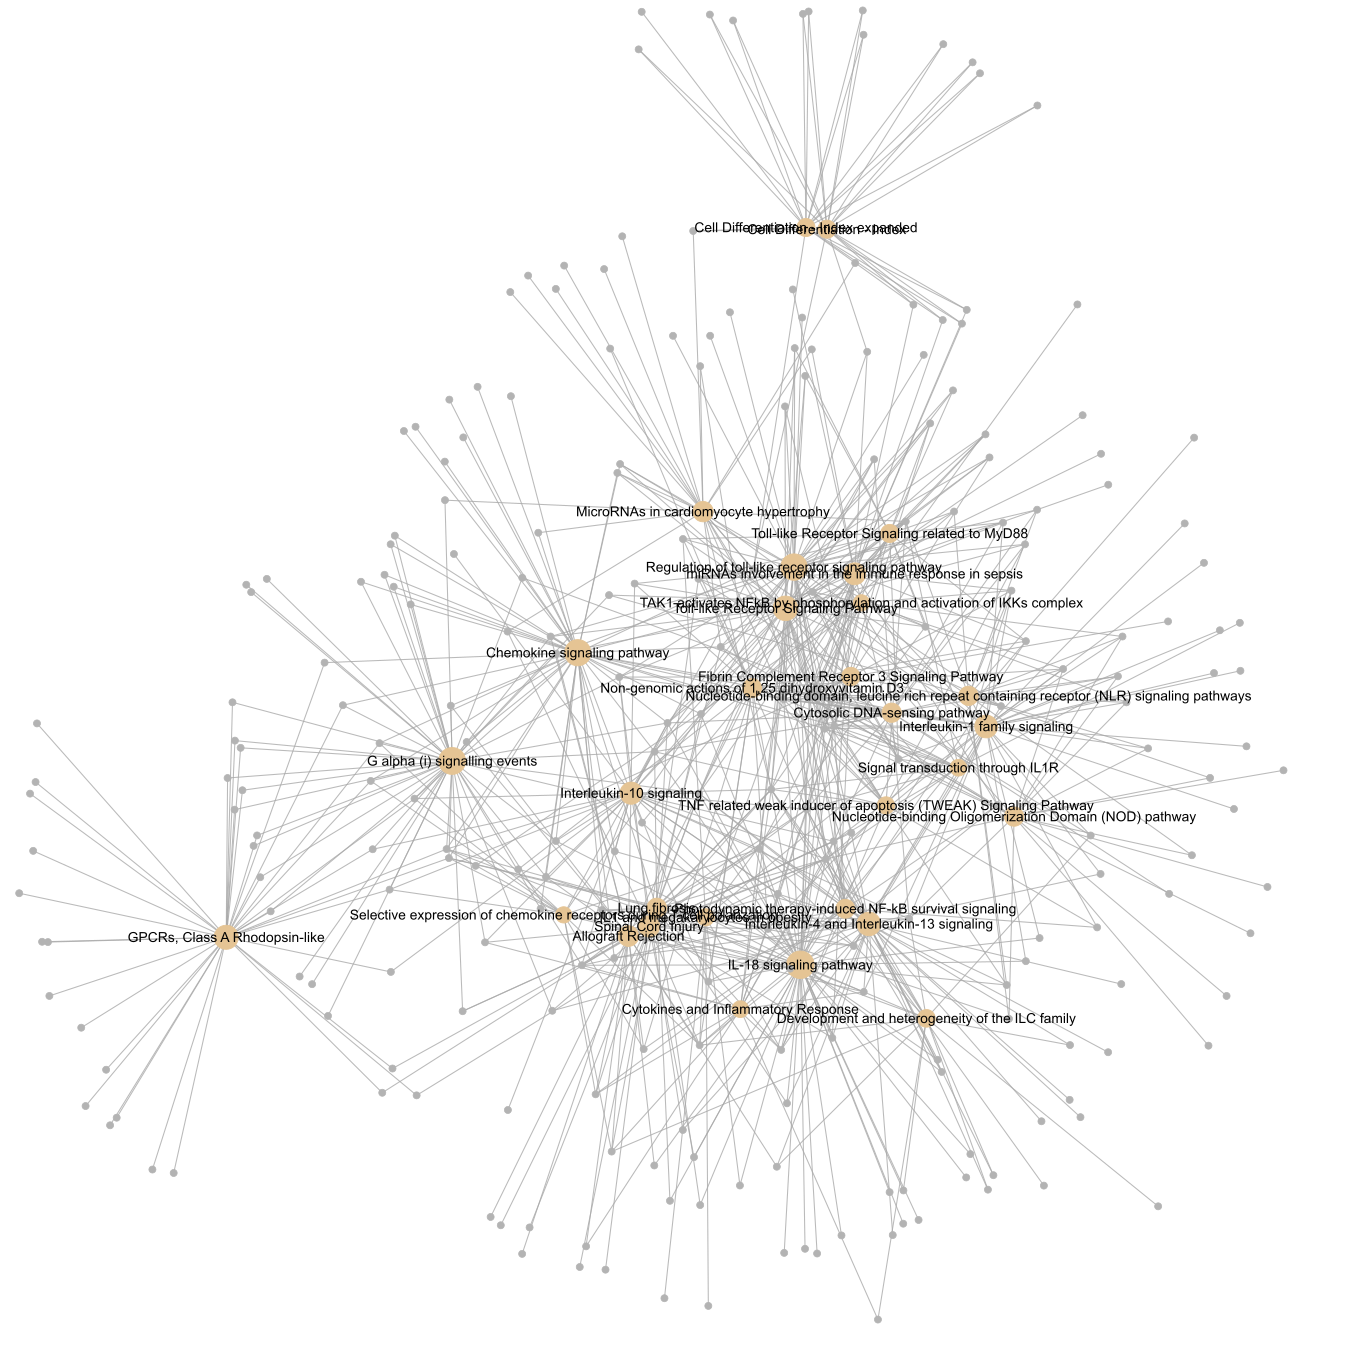
All cell lines showed more differentially expressed genes after exposure to higher concentration, but our analysis found clear differences in affected molecular processes between the cell lines. Approximately half of the affected pathways are categorized with one of the selected toxicity-related processes. Caco2 cells show resilience to low and high concentrations. SAE cells display some cytotoxic response to the high concentration, while THP1 cells are already strongly affected at a low concentration. The networks show for up- and downregulation for the THP1 cells the most pathways. Additionally, the networks show gene overlap between almost all pathways for all conditions.
Conclusions
The approach allowed us to focus the analysis on affected cytotoxic processes and highlight cell-specific effects. The results showed that Caco2 cells are more resilient to TiO2 -nanobelts exposure compared to SAE cells, while THP1 cells were affected the most. The automated workflow can be easily adapted using other Gene Ontology terms focusing on other biological processes.