Cell culture
HADSCs were purchased from the Cell Bank of the Chinese Academy of Sciences (Shanghai, China). Primary ADSCs were cultured in basic Dulbecco’s modified Eagle’s medium (DMEM) containing 10% fetal bovine serum (FBS) and 1% penicillin/streptomycin (Gibco). ADSCs at passages 3–5 were used in this study. The expression of surface marker proteins (including CD29, CD45, HLA-DR, CD49d, CD90 and CD105) in ADSCs was detected by flow cytometry. To confirm the differentiation ability of ADSCs, ADSCs were treated with adipogenic differentiation medium (OriCell) or chondrogenic differentiation medium (OriCell). Adipogenic differentiation was analyzed by Oil Red staining. Chondrogenic differentiation was analyzed with Alcian Blue staining.
HMBECs were purchased from the Cell Bank of the Chinese Academy of Sciences (Shanghai, China). HMBECs were grown in DMEM supplemented with 10% FBS, 1% penicillin, and streptomycin (Gibco). The HMBECs were maintained in a humidified incubator at 37°C with 5% CO2 and 95% air.
Isolation and identification of ADSC-Exos
As mentioned earlier, the collected conditioned medium was used to separate extracellular vesicles through differential ultracentrifugation. Briefly, ADSCs were continuously centrifuged (300, 2000 and 10000 for 10 and 45 minutes), and the supernatant was collected. Then, the obtained supernatant was diluted with 120000 g ultracentrifugation for 70 minutes to obtain the sediment suspended in phosphate buffered solution (PBS) and stored at -80°C for characterization and further use. The morphology of the separated vesicles was observed through transmission electron microscopy (TEM). The particle size distribution and concentration of extracellular vesicles were analyzed using nanoparticle tracer analysis (NTA). The expression of the protein markers CD9, CD63, and calnexin extracted from vesicles was detected by Western blotting. The extracted extracellular vesicles of ADSCs were labeled with PKH26 (Sigma, PKH26PCL, USA), added to HMBECS for 24 hours, and observed under a laser scanning confocal microscope.
Spinal cord contusion model
All experimental rats were bred at the Laboratory Animal Center, and after being approved by the Animal Research Committee, the animal experiments were performed according to the regulations and guidelines of the Animal Ethics Committee. In total, forty-eight adult male Sprague-Dawley rats (250–300 g) were used for this study. The surgical procedure was performed as described previously. Briefly, after the rats were anesthetized with 1% sodium pentobarbital (50 mg/kg; P-010, Sigma‐Aldrich, USA), a laminectomy was performed at the 10th thoracic vertebra (T10). The spinal cord was fully exposed. A contusion injury was induced by impacting the exposed dura of the spinal cord with a 3.0mm impactor tip at a speed of 3 centimeters/second, a depth of 2 millimeters. The SCI rats were randomly divided into 3 groups of 12 rats each and treated with PBS, 100 µg/ml ADSC-Exos or 100 µg/ml ADSC-Exos + ML385 (NrF2 inhibitor) (15 µg/kg) via tail vein injection 30 min after SCI. Additionally, 12 rats were included as the sham group (The sham surgery group underwent the same surgery without spinal cord contusion.). The wound was sutured after hemostasis. The rats were housed in individual cages, and the bladder of each rat was manually emptied twice a day until autonomic urination function was restored or the rats were sacrificed.
Oxygen glucose-deprivation/reperfusion (OGD/R) and drug treatment
HMBECs were cultured with glucose-free DMEM and placed in a hypoxic incubator filled with mixed gas containing 1% O2, 5% CO2, and 94% N2 at 37°C for 90 min to induce OGD injury22. Following OGD, the medium was replaced by fresh complete medium, and HMBECs were incubated in a 37°C/5% CO2 incubator for a 24 h reperfusion period. Control HMBECs were grown in glucose-containing media in a normoxic incubator for the same time period. HMBECs were divided into four groups: control, OGD/R, OGD/R + ADSC-Exos (30 µg/mL), and OGD/R + ADSC-Exos (30 µg/mL) + ML385 (1 µM) for 1 h.
Western blotting
Total protein from Spinal cord tissue or cells was lysed in RIPA buffer for 30 min on ice. The protein concentration was determined by the BCA kit (Beyotime Biotech, China), and the protein was denatured by adding an appropriate ratio of loading buffer (Yazyme, China) at 100°C for 10 min. The protein samples were separated by electrophoresis in 7.5%, 10% and 12% polyacrylamide gels (Yazyme, China) and transferred onto polyvinylidene fluoride (PVDF) membranes (Millipore, Billerica, MA, USA). After blocking the membrane in 5% skim milk, the membranes were incubated with the following antibodies: SLC7A11 (Bioss, Beijing, China), GPX4 (Abcam, Cambridge, UK), Nrf2 (Bioss, Beijing, China), 4-HNE (Bioss, Beijing, China), VEGFA (Proteintech, Wuhan, China), vWF (Proteintech, Wuhan, China), GADPH (Abcam, Cambridge, UK) and Histone-3 (Cell Signaling Technology, Beverly, MA, USA). The protein bands were visualized using an ECL kit (Yazyme, China) and imaged by a ChemiDoc XRS Plus luminescent image analyzer (Bio-Rad, England). ImageJ was used to quantify the density of the bands.
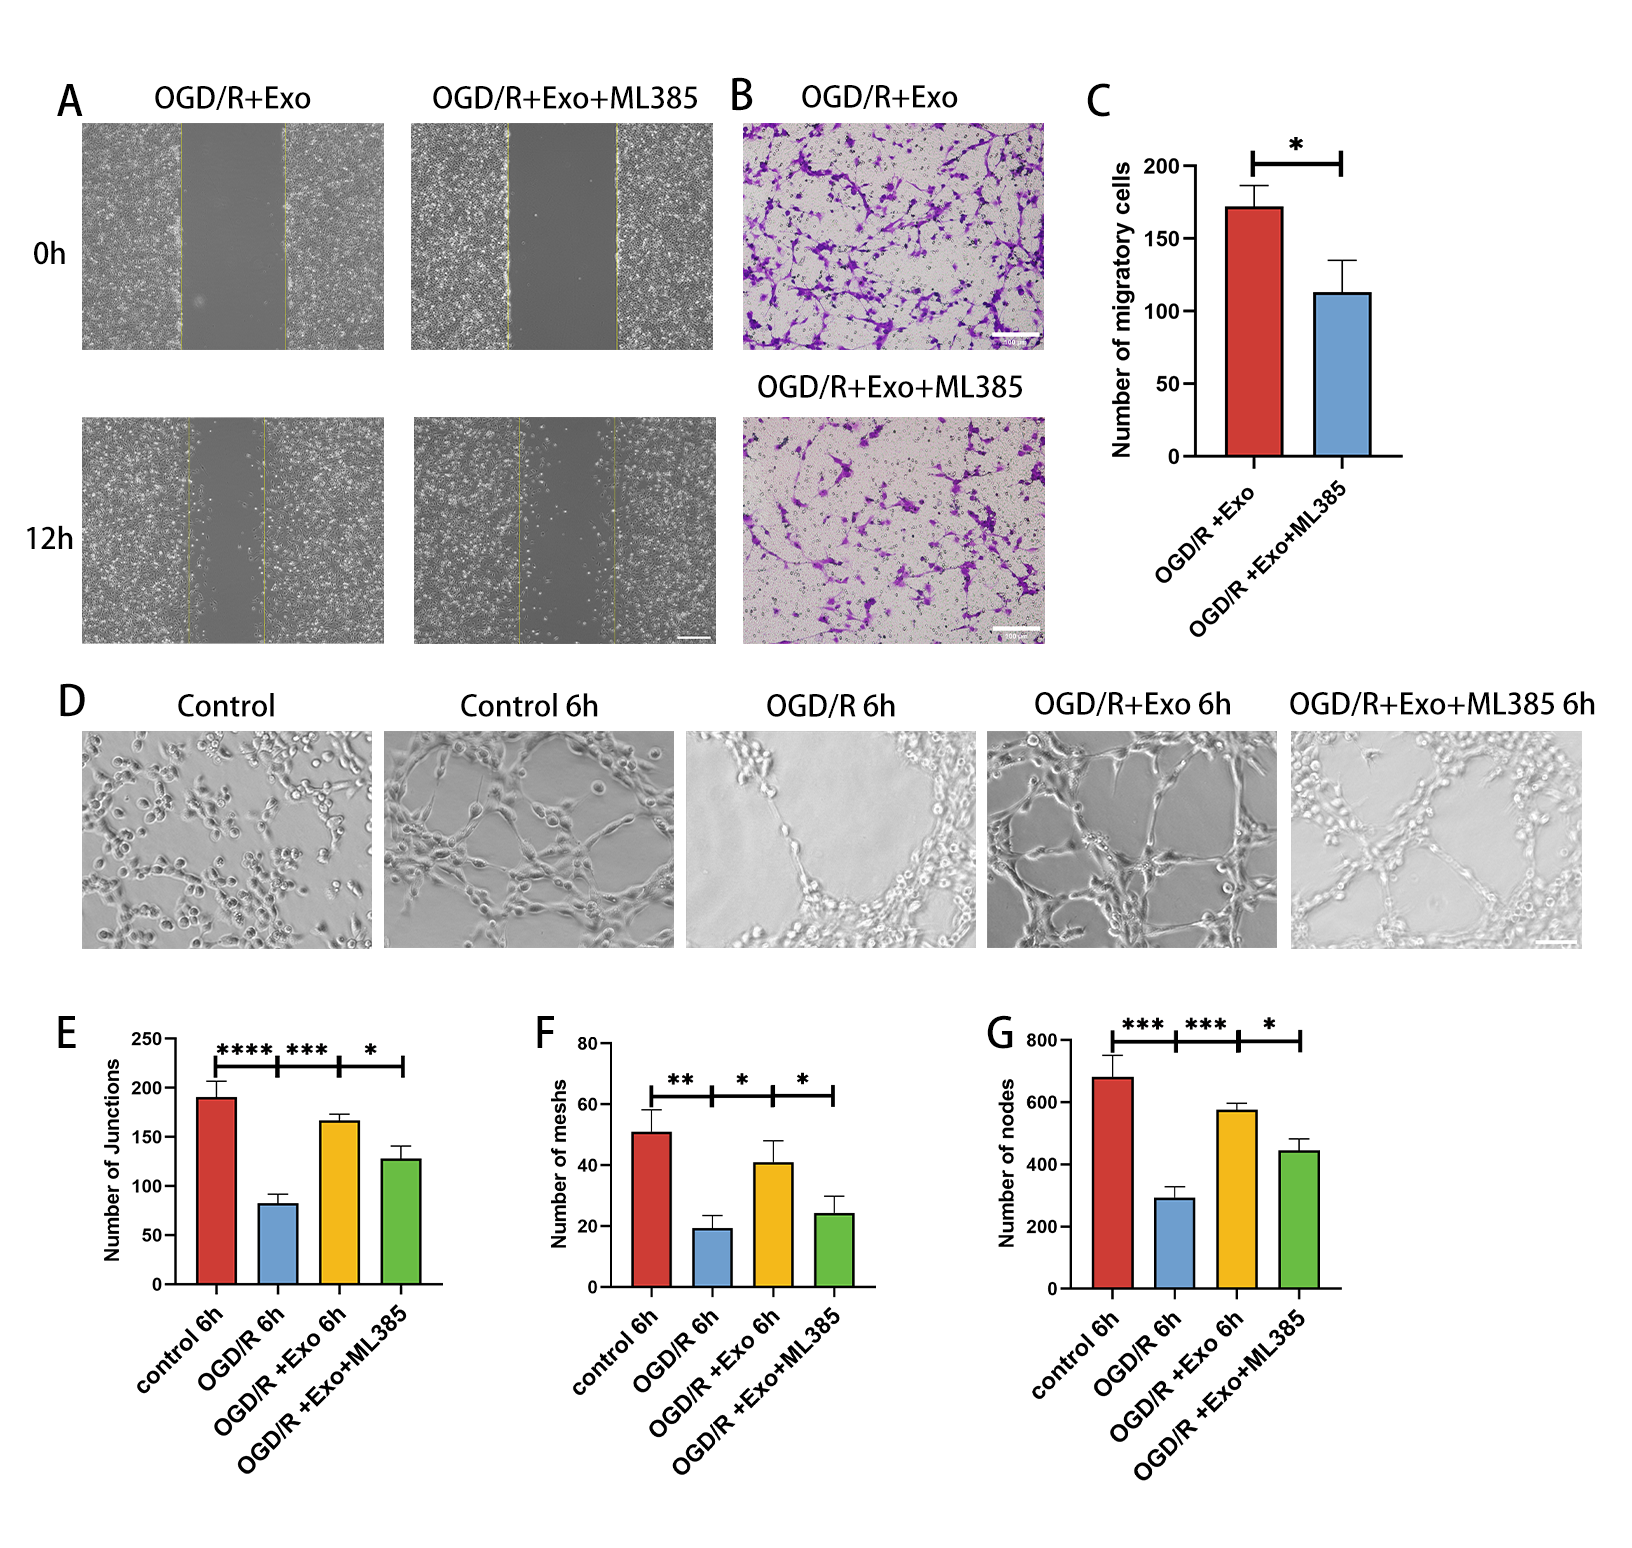
Transwell chamber migration assay
A twenty-four-well Transwell chamber with 8 mm filter inserts (Corning, China) was used to observe HMBEC migration. Differently treated HMBECs were digested into suspensions with trypsin; the upper chambers were filled with 2 × 10⁴ cells/ml containing DMEM (Gibco) and 1% FBS (Gibco), and the lower chambers were filled with 600 µl medium containing 10% FBS (Gibco). After 24h, the nonmigrated cells on the upper chambers were removed, and the migrated cells on the lower surface were fixed in 4% polyvinyl fluoride (PFA) for 20 min. Then, the migrated cells were stained with 0.5% crystal violet for 60 mins and quantified by counting three random fields.
Scratch wound migration assay
HMBECs were seeded on six-well plates until confluence reached 90%. The monolayer cells were scratched in a cross shape using a 1000 µl Tip. After culture in complete medium for 0 h, 6 h, and 12 h after scratching, the wound width was recorded with a microscope (Primovert, Zeiss, Germany). ImageJ (National Institutes of Health) was used to measure the distance between the sides of the scratch in three random fields.
Tube formation assay
250 µl precooled growth factor-reduced Matrigel (BD) was added to a 12-well plate. HMBECs (3×10⁴cells/well) were seeded onto Matrigel. Network formation was assessed using a bright-field microscope (Zeiss). The ability to form capillary-like structures was quantified by determining the number of branch points, tubule lengths, and loops in three randomly chosen microscopic fields using ImageJ software.
Quantitative polymerase chain reaction (qPCR)
The cell samples were collected after different treatment. TRIzol reagent (Invitrogen, USA) was used To extract total RNA according the manufacturer's protocol, and SYBR Green reagent was used for qPCR to quantify the mRNA levels. The soluble mediators of HMBECs (Nrf2, SLC7A11, GPX4, FTH-1, VEGF and vWF) were detected. Then, the 2−∆∆Ct method was used to calculate and analysis the relative mRNA expression of genes and the housekeeping gene glyceraldehyde 3-phosphate dehydrogenase (GAPDH) was used for normalization. The primers were listed in Table S1.
Tissue preparation
Each group of animals underwent deep anesthetic and then rapid cardiac perfusion with 0.9% normal saline, followed by 4% PFA until the rat's body became stiff. Rat spinal cord samples 1 cm in length were removed from the upper and lower areas of the injury, washed with PBS, and placed in 4% PFA for fixation. After 48 h of fixation, the tissue was transferred to a 4% paraformaldehyde solution containing 30% sucrose until the tissue sank to the bottom. A cryostat tissue slicer was used to obtain a frozen section (thickness: 15 µm). The tissue was fixed for 48 hours and rinsed with running water for 4 hours. After gradient dehydration, the tissue was soaked in xylene and then embedded in paraffin. Finally, a paraffin slicer was used to cut slices to obtain paraffin slices (thickness: 7 µm). Paraffin slices were kept at room temperature, and frozen slices were stored at -80°C.
Immunofluorescence
Rat spinal sections or cultured cells were incubated with Triton X-100 (0.3%) for 10 min at room temperature and washed three times with PBS for 5 min. The sections were incubated with BSA at room temperature for 2 h and then incubated with primary antibodies at 4°C overnight. On the second day, after washing in PBS, the sections or cells were incubated with secondary antibodies for two hours at room temperature. Alexa Fluor 488 goat anti-rabbit IgG or Alexa Fluor 594 goat anti‐mouse IgG (1:250, Thermo Fisher Science, A‐11034/A‐11005) was used. Finally, the sections or cells were incubated with DAPI for 10 minutes at room temperature. A fluorescence microscope was used to observe the tissue sections. ImageJ was used to examine the fluorescence intensity.
Transmission electron microscopy
Three sets of spinal cord tissue samples were collected 24 hours after injury. The samples were fixed overnight with 2.5% glutaraldehyde, followed by overnight fixation with 1% osmium tetroxide. After gradual dehydration in graded ethanol, the sample was embedded in an epoxy resin and heated at 70°C overnight. Ultrathin (60–80 nm) transverse sections were sliced using an ultramicrotome and stained with 2% uranium acetate saturated alcohol solution and lead citrate. Transmission electron microscopy (HT7700; Hitachi, Tokyo, Japan) for imaging
Angiography of spinal cord
Paraformaldehyde perfusion fixation was performed on animals as previously described. After that, the circulatory systems of the rats were perfused with Microfil® MV-122 (Yellow) silicone rubber contrast agents. A 10-mm-long spinal cord segment at the T10 thoracic cord that included the injury site was harvested and prepared for scanning. Images were obtained using a SkyScan-1176 microcomputed tomography (µCT) (Bruker micro CT, Belgium) system. The 1.6 version of NRecon software (Bruker) was used for three-dimensional (3D) reconstruction, and the 3.3.0 version of CTvox software (Bruker) was used for 3D photos.
Locomotion function assessment
On the 1st, 3rd, 7th and 14th days after surgery, two independent inspectors who were unaware of the treatment group conducted the Basso-Beattie-Bresnahan locomotion scale (BBB) test and the inclined plate test in an open space. The highest total score of the BBB is 21 points, and the higher the score is, the closer the animal's motor function is to normal. For the inclined plane test, rats were placed face down on an adjustable inclined plane, and the angle was increased from 0° to the point where the rat could not maintain its position for 5 seconds. The angle of the inclined board was changed by 5° each time. Two measurements were performed for each rat. The final score of each rat was obtained by averaging the values of two researchers.
Hematoxylin-eosin staining and Nissl staining
The prepared tissue sections were stained with hematoxylin-eosin (H&E) staining (Solarbio, Beijing, China) and Nissl staining solution (Beyotime, Beijing, China). The samples were dehydrated in gradient alcohol solution, removed with xylene, placed on glass slides with neutral glue, and finally observed with an optical microscope.
Measurement of lipid ROS levels
For cell experiments, lipid ROS were detected in HMBECs using C11 BODIPY staining (Thermo Fisher). Malondialdehyde (MDA) assay kit (Nanjing Jiancheng Bioengineering Research Institute, China), and 4-hydroxynonenal (4HNE) expression (Western blotting). For animal experiments, lipid ROS were detected using MDA kits and 4HNE expression (Western blotting). Following the production instructions for C11 BODIPY staining, the cells were observed with a laser scanning confocal microscope. The MDA kit was used to detect MDA content according to the manufacturer's instructions. As mentioned earlier, protein blotting was used to detect the expression of 4HNE.
Measurement of ROS Levels
For cell experiments, the level of intracellular reactive oxygen species (ROS) was measured using a Reactive Oxygen Species Assay Kit (DCFH-DA) (Solarbio, China), in which the intensity of fluorescence is proportional to the ROS level. Analyses were performed with flow cytometry (BD FACSAria™ III system, USA). The levels of intracellular ROS were quantified by the mean fluorescence intensity (MFI). To assess the level of spinal cord oxidative stress, we incubated freshly prepared frozen spinal cord sections with the fluorescent dye DHE (Thermo Fisher Scientific, USA) at 2 µmol/L in a humidified chamber for 30 min at 37°C with protection from light. ImageJ software was used to quantify the red fluorescence intensity.
Determination of MDA, glutathione concentrations and iron levels
MDA levels in spinal cord tissue were determined using an MDA assay kit (A003-1, Nanjing Jiancheng Bioengineering Institute) as instructed by the manufacturer. The ODs of the resulting supernatants were measured at 532 nm with a microplate reader (BioTek Epoch, Winooski, VT, USA)
Glutathione (GSH) concentrations in spinal cord tissue were determined using a GSH assay kit (A006-2, Nanjing Jiancheng Bioengineering Institute) as instructed by the manufacturer. The ODs of the resulting supernatants were measured at 405 nm with a microplate reader (BioTek Epoch, Winooski, VT, USA)
Iron concentrations in spinal cord tissue were determined using an iron assay kit (A039-2; Nanjing Jiancheng Bioengineering Institute, Nanjing, China) following the manufacturer’s instructions. The ODs of the resulting supernatants were measured at 520 nm using a microplate reader (BioTek Epoch, Winooski, VT, USA)
Statistical analysis
A total of three independent experiments were performed for all analyses. All data are presented as the mean ± SD. Statistical comparisons among groups (≥ 3) were analyzed using one-way ANOVA and Student’s t test (GraphPad Prism 8.0). Differences with P < 0.05 were considered statistically significant.