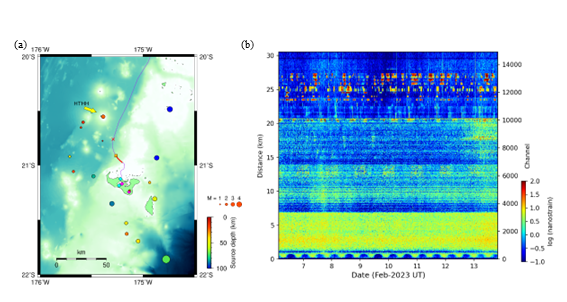
DAS records obtained during the entire observation period (Fig. 2) show clear correlations between seafloor depth and ambient noise level (discussed in the next section). Between about 23 and 27 km from the landing station, there are several series of dramatic increases of strain amplitude that lasted over periods of tens of minutes to hours over particular stretches of cable up to several hundred meters long. The timing of these phenomena seems generally irregular but correlates spatially for some segments. Although the cause of this behavior is unclear, it may reflect cable oscillations due to intermittent bottom currents (e.g., Williams et al. 2022).
Records of local and regional earthquakes recorded during our study period (Fig. 3) clearly show P- and S-wave arrivals along the cable, even for the observations of horizontal strain on the seafloor (e.g., Ide et al. 2021; Lior et al. 2021).
Earthquake hypocenter determinations
We observed many regional and local earthquake signals during our study (Fig. 3). To evaluate the event detection capability of our seafloor DAS observations, we used both the DAS data and the onshore seismometer records to determine hypocenter locations. We applied the STA/LTA event trigger (e.g., Allen 1978; Withers et al. 1998) to the DAS records after 1–20 Hz band-pass filtering. We used DAS traces from every 100th channel (effectively a 204 m interval) between channels 13,500 and 14,900 (i.e., channels 13,500, 13,600, …, 14,900), thereby avoiding the segments that showed the intermittent high noise levels described in the previous section. We then applied the network coincidence trigger of Trnkoczy (2012) with the coincidence sum threshold set at 5 channels by using the ObsPy toolbox for seismology (Beyreuther et al. 2010). The detected events were then visually inspected to identify and remove false triggers.
We then manually picked P- and S-wave arrival times for DAS traces from every 100th channel (i.e., channels 11,000, 11,100, …, 14,900). We selected events with clear P- and S-wave onsets for channels between 14,000 and 14,900 from the DAS records with S – P onset time differences of less than ~15 s at channel 14,900. We chose this criterion because our objective was to evaluate the seismic monitoring capability of DAS around HTHH for data recorded near the end of the cable. We also picked first motions from seismic records obtained at our temporary onshore seismometers and those from permanent stations in and around Tonga that we downloaded from the Incorporated Research Institutions for Seismology Data Management Center (IRIS-DMC) website. We used the P-wave crustal velocity structure obtained by a seismic survey over the Tonga ridge (Crawford et al. 2003) and assumed Vp/Vs = 1.73, where Vp and Vs are P- and S-wave velocities, respectively. Hypocenters were obtained using the method of Hirata and Matsu’ura (1987), and earthquake magnitudes were estimated from the peak velocity obtained at onshore stations by using the empirical formula of Watanabe (1971).
We determined hypocenters for 17 events with magnitudes of 1.0–6.1 that occurred during our study period at depths of 8–190 km (Fig. 1). Errors of the epicenter locations are shown in Fig. S2 and depth error was about 10 km. Only the largest event was of sufficient magnitude to be included in the U.S. Geological Survey (USGS) earthquake catalog. Although most of the earthquakes we recorded were tectonic events related to the subduction of the Pacific plate along the Tonga trench, several events were detected around the volcanic chain of the Tongan archipelago including one event directly beneath the HTHH crater (Fig. 1). Earthquake activity beneath HTHH has previously been attributed to the HTHH eruption (Kintner et al. 2023). Our detection of an event beneath the volcano suggests that HTHH was still active during our study period.
We next considered the event detection limit around HTHH based on the DAS data acquired using the domestic seafloor cable. Figure 4 shows the earthquake magnitudes we determined plotted against the epicentral distance from channel 14,900 (i.e., the northern end of the available section of the cable). Because the distance from HTHH to the nearest point on the domestic cable route is about 20 km (Fig. 1) and because a DAS cable effectively constitutes a dense linear array of seismometers, earthquakes as small as magnitude 1 beneath HTHH would be detectable by DAS if we could use the segment of cable beyond 31 km from the landing station (i.e., north of channel 14,900), which was missing during our observation period. Since DAS measures seismic signals at intervals of several to tens of meters, signals from small events are recorded by sufficient channels to allow us to distinguish signal from noise.
Ambient noise levels
Although ambient noise levels were generally high along the first 21 km of cable north of the landing station, where water depths are less than 10 m with areas of coral reef (Fig. 2), they then decreased rapidly as water depth increased northward to about 1000 m. In the area of shallow reefs along the first 7 km of cable, noise levels were several times higher than along the segment from 7 to 21 km, even though water depths there were similar. The amplitudes of earthquake signals detected show similar trends (Fig. 3). These observations imply that the differences in noise levels do not reflect differences in the actual levels of ambient noise; rather, they represent differences in amplification factors due to soft surface soil or weak cable–seafloor coupling. Because the earthquake signal amplitudes recorded along the 7–21 km cable segment were much lower than those from the cable in deeper water beyond 21 km, we consider that the cable–seafloor coupling was relatively weak along the 7–21 km cable segment.
We computed power spectral density (PSD) hourly for channels 2000, 8000, and 14,000 during our entire observation period (Fig. 5), and Fig. S3 provides PSDs computed for other channels. PSDs plotted against cable length for selected frequencies show that noise levels between channels 11,500 and 13,400 were bimodal (Fig. S4), which we attribute to intermittent increases in strain amplitude (Fig. 2). These data highlight the considerably different noise levels for channels 0–3400 (0–7 km) and 3400–10,200 (7–21 km), which are also evident in Fig. 2. We note that the lower noise levels at 7–21 km may reflect the weak cable–seafloor coupling described above.
Noise levels were generally high at lower frequencies, but decreased considerably at higher frequencies for all channels (Figs. 5 and S3), similar to observations acquired using a seafloor cable deployed off Kamaishi, northeast Japan (Shinohara et al. 2022). The PSDs commonly show several peaks below 2 Hz. The power of the primary mode of microseisms was high at around 0.04–0.2 Hz (5–25 s) for channels on the shallow seafloor (<21 km from the landing station); this phenomenon has been attributed to the passing of ocean waves in shallow water (e.g., Cessaro 1994; Ardhuin et al. 2015) and has a considerable effect on channels in the areas of coral reefs in our study. In contrast, the secondary mode of microseisms appears at around 0.1–2 Hz (0.5–10 s) for channels in deeper water. This mode has been attributed to the action of oceanic waves in coastal and pelagic regions and is dominant for cable segments in the deeper water (Cessaro 1994; Nishida 2017).
Compared with onshore borehole strain-meter (BSM) data recorded in southern California (Barbour and Agnew 2011), the seafloor noise levels of our DAS observations are higher at frequencies below 2 Hz, even in regions of deep water (Fig. 5). This feature may be inherent to the DAS interrogators themselves (Shinohara et al. 2022). In contrast, the noise levels at greater than 1 Hz are comparable with, or lower than, those of BSM data for cable segments in deeper water and are similar to those obtained at Kamioka, central Japan, which is one of the quietest sites in the world (Araya et al. 2017). Although the cable coupling ratio with the seafloor is not well known, the noise levels obtained in this study were similar to those obtained by Shinohara et al. (2022) in deep water off Kamaishi. These observations indicate that ambient noise levels in deep water are very low and DAS observations under these conditions are suitable for seismic monitoring of volcanic activity.
We computed a running spectrum for a one-day record (8 February 2023) at channel 12,000 (Fig. S5) during the period of intermittent increases of strain amplitude. During strong oscillation, noise levels increased at around 0.5 Hz and several higher modes were evident. The peak frequency increased slightly during the oscillation, then recovered to the starting frequency when the oscillation ceased. The strain records are generally similar among the channels during the oscillation. We consider that the oscillation of the cable segment was caused by bottom currents (e.g., Williams et al. 2022). Ide et al. (2021) reported periodic cable strain changes of >20 micro-strains due to diurnal and semidiurnal tides. Although the periodicity of the strong oscillation in our records is not clear, ocean tides may have caused bottom currents and the resultant cable oscillations.