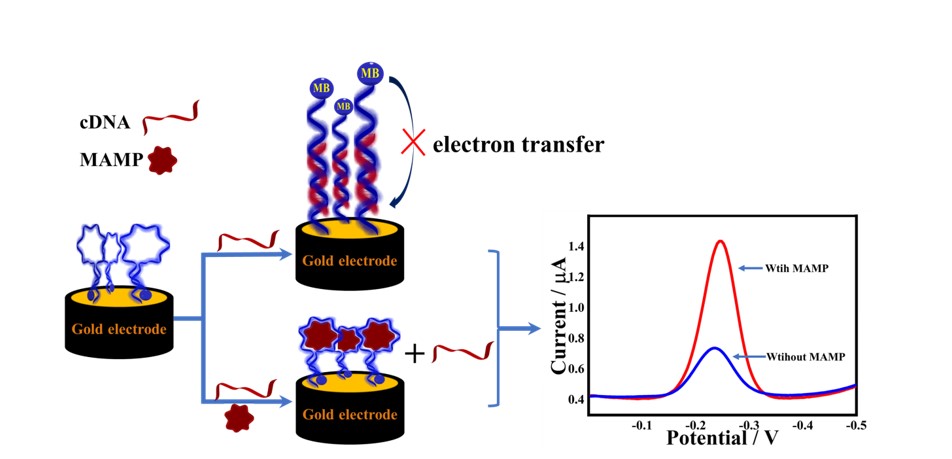
Principle of the electrochemical aptasensor for MAMP
In this experiment, a competitive binding strategy between cDNA and MAMP was used for the quantitative analysis of MAMP. After MB-modified Apt was immobilized on the gold electrode surface by Au-S bonding, the addition of MCH not only passivated the electrode by binding the blank active site, but also kept the Apt in an upright position under the effect of spatial resistance, which resulted in an aptamer-sensing interface with specific recognition ability. Before the incubation, the modified electrode (MB-Apt-S/GE) was scanned using SWV to obtain the corresponding peak current value, noted as ip initial. In the absence of the MAMP, the MB-Apt-S/GE was incubated with a buffer containing cDNA, which complementarily bound to the surface aptamer to form a rigid DNA double-stranded structure, keeping the MB away from the gold electrode surface. When MAMP and cDNA were present at the same time, they will compete for the binding of MB-Apt-S. As MB-Apt-S had strong affinity with MAMP, the specific recognition will form a stable complex and produce a hairpin structure. At this time, the distance between MB and gold electrode surface decreased so that the electron collision transfer rate accelerated. A larger electrochemical signal was generated and the current value was recorded as ip MAMP. The difference of SWV peak current before and after adding MAMP was used as the response current to achieve the electrochemical detection of MAMP (Scheme 1). Apt and cDNA were designed according to previous reports[27]. A 28-base specific recognition aptamer was used as the sensing element, which was obtained by truncating a long specific sequence recognition aptamer of MAMP.
Characterization of the electrochemical aptasensor
The fabrication procedure of the aptasensor was monitored by measurements of cyclic voltammetry (CV) and electrochemical impedance spectroscopy (EIS), respectively. In this part, the electrolyte solution was 10 mmol/L Tris-HCl buffer (pH 7.5) containing 0.1 mol/L KCl and 5 mmol/L K3[Fe(CN)6]/K4[Fe(CN)6] (1:1). CV measurements were conducted in the range from − 0.2V ~ 0.6 V at a scan rate of 50 mV/s. EIS measurements were performed in a frequency range of 0.1 Hz to 10 kHz with an amplitude of 250 mV. As shown in Fig. 1(A), a pair of distinct redox peaks for [Fe(CN)₆]3−/4− can be seen on the bare GE (curve a). The conductivity of the GE was decreased when MB-Apt-S incubated on the bare electrode (curve b), which should be caused by the poor conductivity of MB-Apt-S, indicating that MB-Apt-S was successfully modified on the GE surface. After passivating with MCH, the peak current decreased again (curve c) because of the MCH was successfully modified onto gold surface. The electrode preparation process was further verified by EIS, which usually consists of a half circle in the high frequency region and a straight line in the low region. The semicircles reflect the electron transfer process and the straight lines represent the diffusion process. As shown in Fig. 1(B), the diameter of the semicircle of MB-Apt-S/GE (curve b) was larger than that of the bare electrode (curve a), confirming that the MB-Apt-S/GE electron transfer process had a larger resistance. From the inset of Fig. 1(B), it can be seen that the semicircle diameter was larger when MB-Apt-S/GE was passivated by MCH, indicating an increased resistance to charge transfer. These results proved that the modified electrode was successfully prepared by the layer-by-layer modification method.
Feasibility validation experiments of modified electrode sensing
To verify the feasibility of the modified electrode, MB-Apt-S/GE was incubated in different buffers. The peak current values of MB were measured using SWV. As shown in Fig. 2, the current response (ip blank, 4.191 × 10− 7A) of the electrode incubated with the cDNA-only buffer solution was significantly lower (curve c) than that without incubation (curve b), indicating that the complementary binding of MB-Apt-S to cDNA kept the MB marker away from the electrode surface and reduced the peak current. When 200 nM MAMP was added to the cDNA solution, the peak signal current (ip MAMP, 8.238 × 10− 7A) (curve a) was higher than that of ip blank, indicating that the binding of the aptamer to the target occurred.
After the assay, the electrode was immersed in 5 mol/L NaCl solution for 20 minutes and then washed with double-distilled water for 3 minutes, in which case the affinity of the aptamer decreased significantly and the hydrogen bonding force was weakened[29, 30], and the cDNA and MAMP would be released. Although the current signal will be reduced at this point compared to the newly modified MB-Apt-S/GE, the modified electrode will still have a good signal response to MAMP and the modified electrode can be reused.
Optimization of experimental conditions
In order to improve the performance of the sensor, the experimental conditions were optimized. Firstly, the cDNA length was optimized and shown in Fig. 3(A). ip blank decreased with increasing length of incubated cDNA, which was due to the fact that the longer the cDNA length, the stronger the complementary binding, and when the length was more than 12 bases, the current value tended to stabilize and does not decrease further with increasing cDNA length. Under all conditions, the addition of MAMP caused an increase in the peak current ip MAMP, however, when the cDNA was very long, the aptamer bound too strong for MAMP to displace the cDNA, so ip MAMP tended to decrease. As shown in Fig. 3(B), MAMP addition will cause a change in the MB current response value, with the largest change in current (ip MAMP - ip blank) when measured using C14, and therefore C14 was chosen as the length-optimal complementary strand.
The effect of the MB-Apt-S to cDNA concentration ratio was also examined. In order to gain the biggest current change value, the cDNA concentration should be excessive and the MB-Apt-S to cDNA ratios of 1:1, 1:2, 1:3 and 1:4 was measured for comparison. As shown in Fig. 4(A), the ip blank decreases due to an increase in the complementary strand concentration. As can be seen in Fig. 4(B), the MB-Apt-S /cDNA ratio of 1:2 was chosen as the optimal condition for subsequent experiments.
Then, the effect of the concentration of the MB-Apt-S modification solution was investigated. As the concentration of the MB-Apt-S solution increased, the peak current value of the modified electrode in the blank solution will keep increasing. But when the MB-Apt-S on the electrode were too crowded, the MB will be repelled away from the electrode surface, which will lead to a decrease in the signal response. As shown in Fig. 5(A), the electrochemical response of 200 nmol/L MAMP was measured at different concentrations of the MB-Apt-S modification solutions ranging from 10.0 to 500 nmol/L. The current signal values reached the highest when the concentration was 100 nmol/L. Therefore, 100 nmol/L was chosen as the best MB-Apt-S modification solution’s concentration.
Finally, the effect of the MAMP incubation time was optimized. As shown in Fig. 5(B), the MAMP current responses gradually diminished with increasing of incubation time. The results showed that the binding ability of MB-Apt-S to cDNA increased with increasing incubation time, which was not conducive to the competitive binding reaction of MAMP, so the optimal incubation time was 5 minutes. Meanwhile, the effects of the modified electrode on the current response values of MAMP were compared at room temperature and 4 ℃ incubation temperature. The results showed that the low temperature was favorable for the binding of MAMP to MB-Apt-S.
Effect of CV scan rate
In order to obtain kinetic information of the modified electrode, the effect of scan rate on the electrode surface was investigated through CV. MB-Apt-S/GE was transferred to blank buffer (1×PBS) for scanning. As shown in Fig. 6, the redox peak currents increased with increasing scan rate and were proportional to the scan rate, and the corresponding linear equations were as follows:
Ipc (µA) = 0.5083 + 0.1521v (mV/s), (R2 = 0.9944)
Ipa (µA) = 0.2028–0.09631v (mV/s), (R2 = 0.9959)
The results indicated that the electrochemical process of MB-Apt-S on the electrode surface was an adsorption-controlled process, which was consistent with the typical behavior of the substance immobilized modification [31]. Figure 7 illustrates the possible mechanism of electrochemical oxidation of MAMP on the surface of MB-Apt-S/GE [32].
Detection of MAMP
The effect of the MAMP concentration on MB-Apt-S/GE was investigated under optimal experiment conditions to study the analytical detection performance of this modified electrode for MAMP. As shown in Fig. 8, the incremental values of MAMP peak currents on MB-Apt-S/GE were linearly related to the logarithmic values of its concentration in the range of 10.0 ~ 400 nmol/L, and the regression equation was:
ΔIp (nA) = -0.8684 + 1.804lgC (nmol/L), (R2 = 0.9928)
As shown in Fig. 8 (B), the linear equation range from 1.0 to 10 nmol/L was:
ΔIp (nA) = 0.2261 + 0.2875logC (nmol/L), (R2 = 0.9931)
The limit of detection (LOD, S/N = 3) was 0.88 nmol/L. The results indicate that this MB-Apt-S/GE can achieve rapid and sensitive quantitative analysis of MAMP.Fig. 8 (A) SWV curves of 1 to 500 nmol/L MAMP on MB-Apt-S/GE. (B) MB peak current increment versus MAMP concentration (inset shows calibration curve of MB peak current increment versus log cMAMP)
Interference, repeatability, stability and reproducibility studies
To assess the reproducibility of the modified electrode, the work electrode was used and the values of its current response signal in the supporting electrolyte before and after incubation were recorded. The results were shown in Fig. 9(A). Although the MB signal of the modified electrode was attenuated after regeneration, it still showed a good electrochemical response to MAMP. The relative standard deviation (RSD) for six measurements was 3.9%, which demonstrated a good reproducibility of the modified electrode. The anti-interference performance was then investigated. Figure 9(B) shown the change in current response of the modified electrode to 200 nmol/L MAMP after the addition of different multiples of interferents. The results showed that 100 times of the inorganic salt ions of K+, Na+, Cl−, NO3−, Zn2+, Fe3+ and 50 times of the inorganic salt ions of nicotine (Nico), cocaine (Coc), uric acid (UA) cysteine (Cys), glucose (Glu) and sucrose (Sac) did not interfere significantly with the 200 nmol/L MAMP assay, demonstrating a good anti-interference ability of the modified electrode. After storing the modified electrode in 1 × PBS (pH = 7.4) buffer solution at 4°C for 15 days, the current response value was 94.0% of the initial value, indicating that the electrode exhibited good stability. To evaluate the reproducibility of the modified electrode, two MB-Apt-S/GE were prepared under the same conditions using the same procedure, and three sets of parallel experiments were carried out, and the standard deviation of the current response was 2.3%, indicating that the modified electrode prepared by this method had good reproducibility.
Detection of MAMP in real sample
To further evaluate the value of the prepared electrochemical aptamer sensor for practical applications, the MAMP content in real samples was measured using a standard curve method. As body fluid samples from drug users are difficult to obtain, urine and saliva from healthy humans were used to simulate the real sample environment and quantitative MAMP was added for the assay. Prior to spiking, saliva and urine were filtered and processed by using a 0.45 µm microporous membrane, diluted and added to the MAMP standard solution. The concentration of the substance to be measured in the sample solution before and after spiking was determined and the results were shown in Table 2. It can be seen that the MAMP recoveries ranged from 96.3 to 107% with an RSD less than 6.6%, indicating that the sensor is of good practical value.
Table 2
the analysis results of MAMP in saliva and urine (n = 5)
| Samples | Added (nmol/L) | Found (nmol/L) | RSD (%, n = 5) | Recovery (%) |
| saliva | 0 30.0 40.0 50.0 | 0 30.3 38.6 49.5 | - 3.6 3.3 5.8 | - 101 96.7 99.0 |
| urine | 0 30.0 40.0 50.0 | 0 31.9 38.5 48.1 | - 4.5 6.6 5.9 | - 107 96.3 96.3 |
Table 3 shows previously reported analytical determinations for MAMP, the detection range and LOD of this sensor is comparable to several other methods [33–39]. Those results indicated that this reagentless approach achieved nano-molar detection of MAMP in biological sample, which provided a rapid, sensitive and useful tool for the police to detect drugs on the spot quickly and conveniently.
Table 3
Comparison of analytical performance of different MAMP sensors.
| Method | Modifier | Range(µM) | LOD(nM) | Samples | Ref. |
| Voltammetric (DPV) | PVDF-PEI/Anti-METH/GCE | 2.0–50 ng/mL | 0.007 ng/mL | Tear, sweat | [33] |
| electrochemical-surface plasmon resonance (EC-SPR) | MDEA/DA/SPR | 100-1000000 | 57,59 | 10%FBA, urine | [34] |
| Voltammetric (FFT-SWV) | MIP/MWCNTs-CPE | 0.01–100 | 0.83 | Serum, urine | [35] |
| Voltammetric (SWV) | CeO2NP/rGO/GCE | 25-166.6 | 8.7×10³ | Plasma | [36] |
| Voltammetric (DPV) | 1-butyl-3-methylimidazolium bis (trifluoromethylsulfonyl) imide (BMIM TFSI) | 5.0-1000 ng/mL | 0.56 ng/mL | Saliva | [37] |
| Electrochemical aptamer-based sensor | graphite SPE | 0.02-20 | 20 | Saliva, serum, urine | [38] |
| Voltammetric (SWV) | graphite SPE | 50-2500 | 16.66×10³ | Seized sample | [39] |
| Voltammetric (SWV) | Apt-Ⅰ/GE | 0.001–0.01, 0.01–0.4 | 0.88 | Serum, urine | This work |