Modelling approach
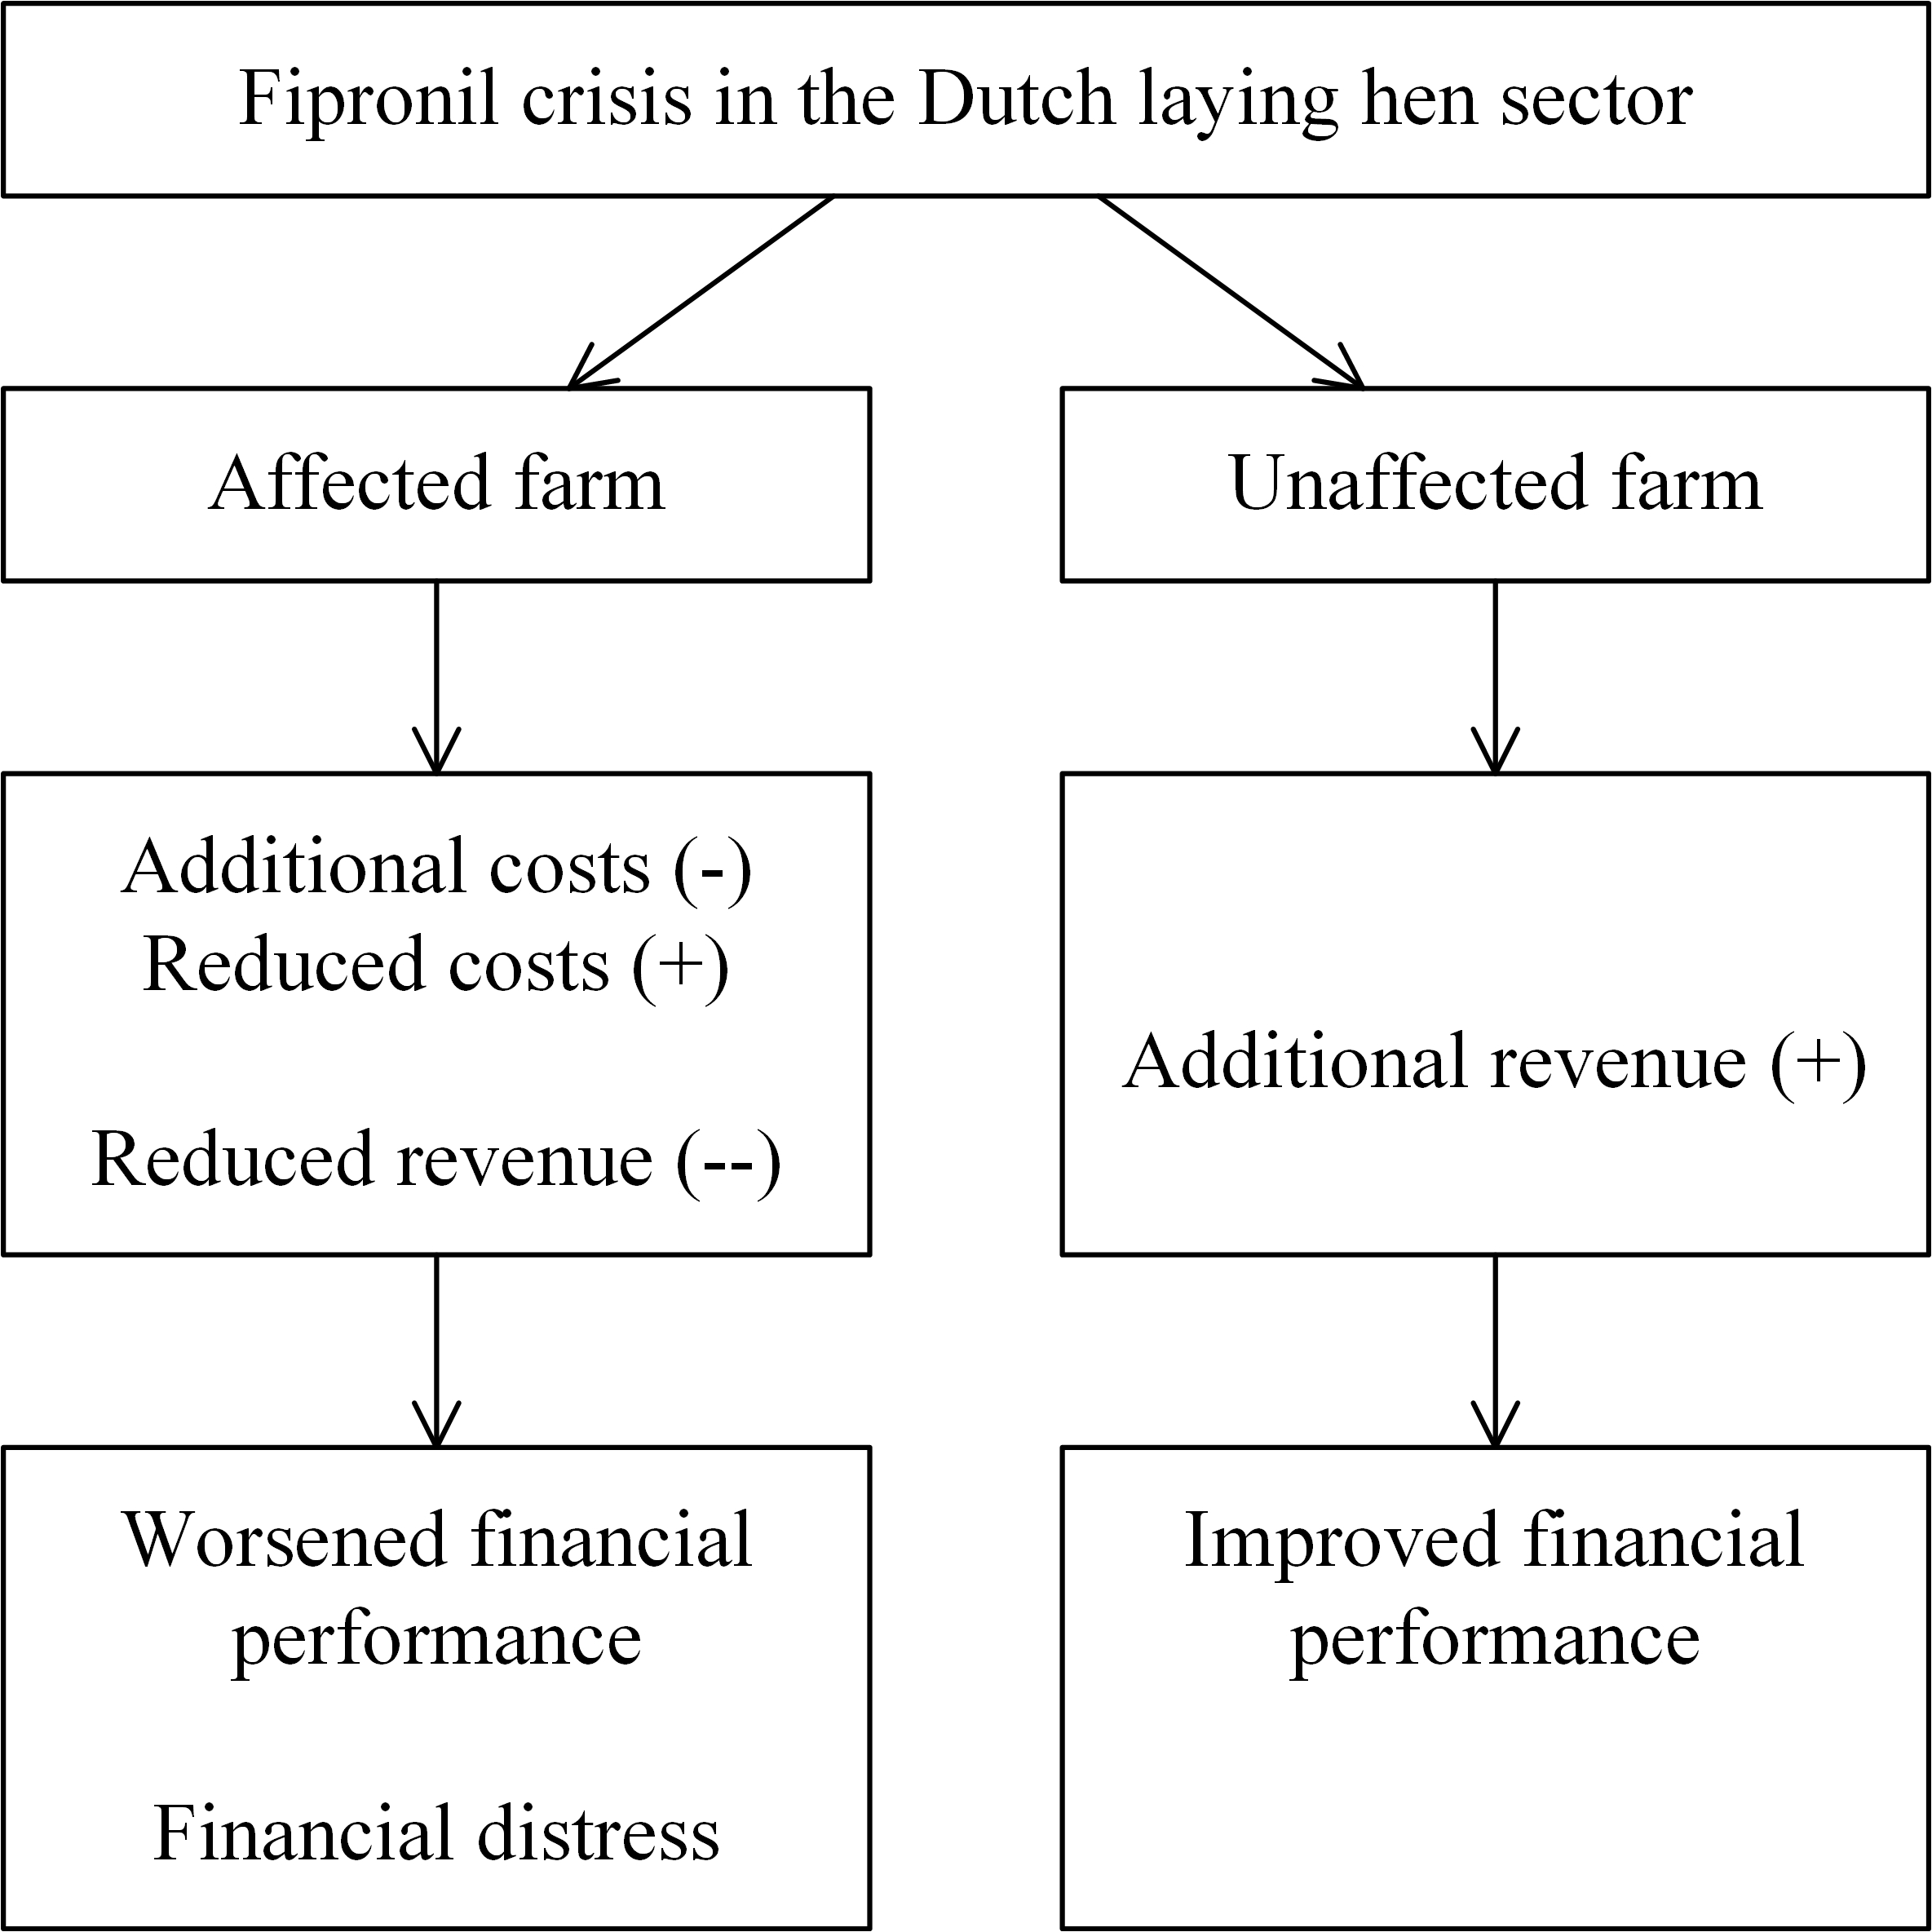
A normative modelling approach is taken, as laid out in Figure 1, using financial statements and a partial budget. Farm-economic consequences are estimated in the context of the Dutch laying hen sector, which is dominated by family farms. The first step is to create a baseline by generating an income statement of a laying hen farm representing a ‘normal year’. The income statement is a ‘report of revenue and expenses ending with an estimate of net farm income’ and ‘provides an estimate of the value of products and services produced during an accounting period and the costs of the resources used to produce them’ [7].
Insert Figure 1 about here.
We use a partial budget framework [7] in step two to estimate changes in farm income in a ‘normal’ year as a result of the fipronil crisis. We answer the following four questions:
- What new or additional costs occurred [due to the Dutch fipronil contamination]?
- What costs were reduced or eliminated [...]?
- What new or additional revenue were received [...]?
- What revenue were forgone [...]?
Partial budgeting is a form of marginal analysis as we assume that a fipronil contamination does not affect other decision-making aspects of the farm, such as the depreciation of a poultry house or the debt repayment schedule. The focus is on incremental costs and revenue. While in principle all four categories of the partial budget apply to both contamination states, for an unaffected laying hen farm only the category of additional revenue (question 3) is relevant. Outcomes of the partial budget model are used in step three and result in two updated income statements in addition to the baseline; one reports the income of an unaffected farm, the other of an affected farm. We analyse the impact of the fipronil crisis on financial performance using two indicators. First, we calculate the net operating result, which is ‘a criterion of profitability (also known in the sector as rentability) and thus indicates the remuneration for management and risk’ [8]. The net operating result represents the income available to provide a return to the production factors of capital (equity), labour and management of the owner(s). Second, we calculate the earnings before interest, taxes, depreciation, and amortization (EBITDA). The latter is often used as a proxy for operating cash flow to measure the cash available to meet financial obligations [9].
Data availability
Mainly two sources of data are used: farm accountancy data of Dutch laying hen farms publicly available from Wageningen Economic Research [10] via the Agro & Food portal (www.agrimatie.nl) and a commonly used reference guide (KWIN) that contains all sorts of quantitative base values that advisors, farmers, students or researchers use to perform financial analyses [11]. The ‘Agrimatie’ database is mainly used to create the income statement baseline (step 1, Figure 1, and Table 2 ‘normal year’). The KWIN guide is mainly used to calculate the different incremental cost and revenue factors in the partial budget model (step 2, Figure 1, and Table 1). Some other references used for input values are a report that was prepared for the Dutch Ministry of Agriculture, Nature and Food Quality by Horne et al. [12] and a report prepared by the Poultry Expertise Center (PEC), which is a public-private partnership in the Dutch poultry sector between companies, government bodies, and educational institutions [13].
Assumptions and delimitation
Economic consequences of a fipronil contamination depend on a range of factors that we cannot all take into account. Our perspective is the individual laying hen farm, and not the egg supply chain. Most of our data consist of averages. We therefore work with a flock size of 50 000 hens [10]. We estimate incremental revenue and costs for the most adopted (60%) housing system in 2017, which is the ‘barn’, a floor housing system in which hens can move freely, as opposed to the cage system in which hens are confined in an ‘enriched cage’. In the barn system, hens have no outdoor access as opposed to the ‘free-range’ and ‘organic’ housing system [14].
Insert Figure 2 about here.
The income statements are made up for the year 2017, while for the partial budget we consider five months (Figure 2). The first contaminated fipronil eggs were reported by the end of July in Belgium [15], and soon thereafter in the Netherlands. Farmers who treated their housing system with fipronil to control red mite infestation were temporarily shut down, and consequently, no eggs, hens, or manure could leave the farm. Mainly two measures at farm-level were suggested to become free from fipronil: culling or forced moulting. The latter strategy is rational to take if the flock is still early in its egg production cycle. However, moulting often was not effective to get the hens free from fipronil making culling still needed [12]. Hence, we base incremental costs and revenue on a culling strategy.
Concerning depreciation of the flock, culling implies that the old flock is more quickly depreciated. The flock is assumed to have an egg production period of 68 weeks, starting January 1, 2017. For the treatment and reporting of depreciation, we follow Poppe [8] and regard depreciation as a fixed cost.
Insert Figure 3 about here.
Concerning egg prices, we use the average price over the first six months of 2017 (€ 7.8/100 eggs) and the average price of the last four months of 2017 (€ 10.3/100 eggs) to calculate additional and reduced revenue from selling eggs for the farm being affected and unaffected. Figure 3 provides an overview of monthly egg prices from 2013 – 2017, the first four years as monthly averages. In the first quarter, the monthly egg prices in 2017 were below the four-year average (2013 – 2016), while in the second quarter this was the opposite. However, since we express the impact on the operating result in a year, the monthly variation is less important for our calculations. Based on the egg price series data, a price level of € 7.8/100 eggs well represents the price level in a ‘normal year’.
Additional file 1 can be accessed to examine the input values and verify the calculations made for the partial budget and income statements.