Characteristics of the study population
There were 1032 T2D and 1522 non-T2D subjects. The mean age of patients with T2D was 57.2 (SD: 13.8) years and the mean age of subjects without was 46.4 (13.7) years. Of them, 53.2% of T2D and 74.3% of non-T2D were males. Patients with T2D had a mean HbA1c of 9.60% (SD, 2.38%). Patients with T2D were older and had higher SBP, triglyceride, tyrosine, asparagine and asparagine to aspartate ratio than subjects without T2D. Levels of HDL-C, LDL-C and aspartate were lower in T2D than in non-T2D. BMI was similar between T2D and non-T2D. The prevalence of diabetes complications and drug use were shown in Table 1. (Table 1)
Table 1. Clinical and biochemical characteristics of participants according to T2D
|
Characteristics
|
Non-T2D
|
T2D
|
P-value
|
|
No. of subjects
|
1522
|
1032
|
|
|
Age, years
|
46.4±13.7
|
57.2±13.8
|
<.0001
|
|
≥50 years old
|
640 (42.1)
|
785 (76.1)
|
<.0001
|
|
Male sex
|
1131 (74.3)
|
549 (53.2)
|
<.0001
|
|
BMI, kg/m2
|
25.4±3.5
|
25.3±3.9
|
0.3338
|
|
BMI < 18.5
|
23 (1.5)
|
27 (2.6)
|
0.2012
|
|
BMI ≥18.5 and <24
|
504 (33.1)
|
354 (34.3)
|
|
|
BMI ≥24 and <28
|
653 (42.9)
|
430 (41.7)
|
|
|
BMI ≥ 28
|
342(22.5)
|
221 (21.4)
|
|
|
SBP, mmHg
|
130.9±17.2
|
140.4±24.0
|
<.0001
|
|
HDL-C, mmol/L
|
1.55±0.35
|
1.08±0.35
|
<.0001
|
|
<1.00 in male or <1.30 in female
|
123 (8.1)
|
785 (76.1)
|
<.0001
|
|
LDL-C, mmol/L
|
3.06±0.70
|
2.89±1.01
|
<.0001
|
|
LDL-C >2.60 mmol/L
|
1127 (74.1)
|
434 (42.1)
|
<.0001
|
|
Triglyceride, mmol/L
|
1.51 (1.02-2.35)
|
1.67 (1.11-2.38)
|
0.0126
|
|
Triglyceride >1.70
|
644 (42.8)
|
361 (48.5)
|
0.0097
|
|
HbA1c, %
|
|
9.60 (2.38)
|
|
|
Asparagine, μmol/L
|
70.68 (59.77-84.12)
|
74.85 (61.98-89.50)
|
<.0001
|
|
>88, μmol/L
|
303 (19.9)
|
280 (27.1)
|
<.0001
|
|
Aspartate, μmol/L
|
42.54 (29.67-58.01)
|
28.37 (20.91-37.56)
|
<.0001
|
|
<65, μmol/L
|
1275 (83.8)
|
1014 (98.3)
|
<.0001
|
|
Asparagine: aspartate
|
1.72 (1.26-2.37)
|
2.60 (1.99-3.55)
|
<.0001
|
|
≤1.5 μmol/L
|
578 (38.0)
|
87 (8.4)
|
<.0001
|
|
>1.5 μmol/L
|
944 (62.0)
|
945 (91.6)
|
|
|
Macrovascular complications
|
|
|
|
|
Prior CAD
|
|
210 (20.4)
|
|
|
Prior stroke
|
|
199 (19.3)
|
|
|
Microvascular complications
|
|
|
|
|
Diabetic retinopathy
|
|
162 (15.7)
|
|
|
Diabetic nephropathy
|
|
187 (18.1)
|
|
|
Diabetes medications
|
|
|
|
|
Oral antidiabetic drugs
|
|
564 (55.1)
|
|
|
Insulin
|
|
770 (74.8)
|
|
|
Statins
|
|
369 (35.9)
|
|
|
Other lipid-lowering drugs
|
|
23 (2.2)
|
|
|
ACEIs
|
|
135 (13.1)
|
|
|
ARBs
|
|
134 (13.0)
|
|
|
Other antihypertensive drugs
|
|
309 (29.9)
|
|
Abbreviations: T2D, type 2 diabetes; BMI, body mass index; SBP, Systolic blood pressure; HDL-C, high-density lipoprotein cholesterol; LDL-C, low-density lipoprotein cholesterol; HbA1c, glycated hemoglobin; CAD, coronary artery disease; ACEI, Angiotensin - converting enzyme inhibitors; ARB, Angiotensin receptor blockers.
Data are means ± standard deviation (SD) or median (interquartile range [IQR]) or n (%).
P values were derived from independent-samples Student t test for normally distributed variables, Mann-Whitney U test for skewed distributions, Chi-square test (or fisher test if appropriate) for categorical variables.
Addictive interaction of asparagine to aspartate ratio with age and sex for T2D
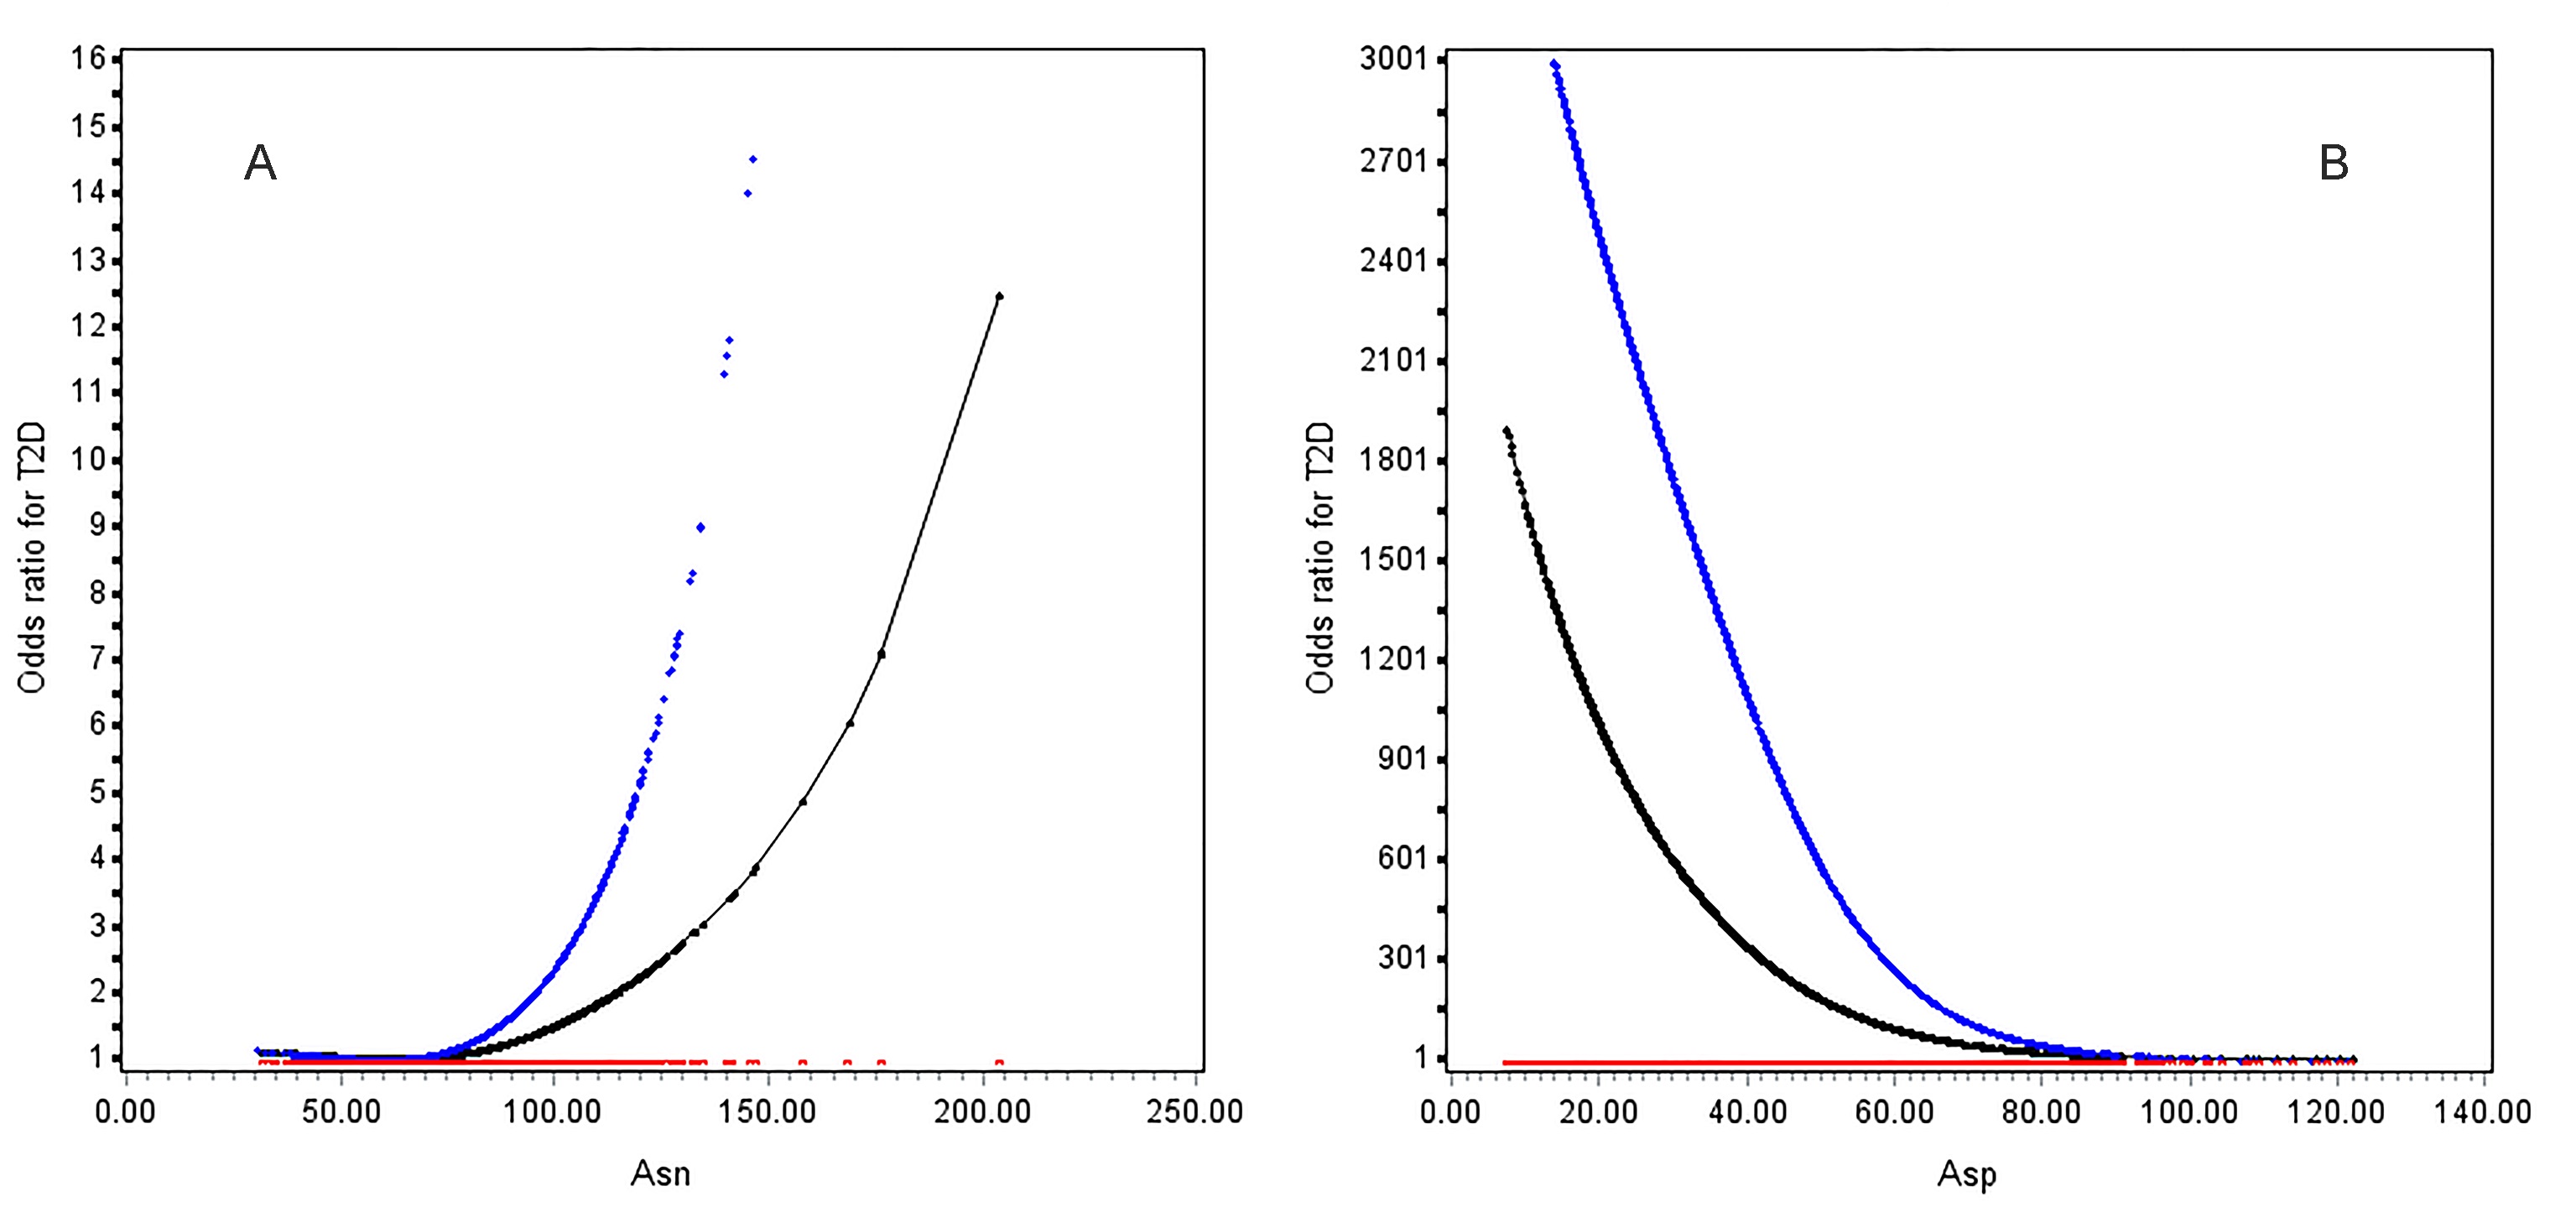
Age was associated with T2D in a J-shape relationship (Figure 1). The risk of T2D rapidly increased from 50 years upwards. OR (95%CI) of age ≥ 50 vs. < 50 years was 3.96 (2.99-5.24) in multivariable analysis (Table 2); Asparagine was positively while aspartate was inversely associated with increased T2D risk non-linearly (figure S1). Exposure to high asparagine or low aspartate led to 2.38-fold (95%CI, 1.77-3.21) and 6.33-fold (4.54-8.82) risk of diabetes compared to their counterparts, respectively (table 2); Asparagine to aspartate ratio was associated with increased risk of T2D and at 1.5 upwards, the two curves in patients aged ≥50 years and < 50 years went apart (figure 2A) and became unparallel in both males and females (figure 2B). OR (95%CI) of high vs. low asparagine to aspartate ratio for T2D was 7.00 (5.27-9.30) in univariable analysis and 7.99 (5.50-11.6) in multivariable analysis. Female had 1.82-fold risk of male counterparts (Table 2).
Table 2. Interactive effects of asparagine and aspartate homeostasis with sex and age for T2D risk
|
|
Univariable model
|
|
|
Multivariable model
|
|
|
|
OR (95% CI)
|
P-value
|
|
OR (95% CI)
|
P-value
|
|
Asn > 88 vs. ≤ 88, μmol/L
|
1.69 (1.38-2.08)
|
<0.0001
|
|
2.38 (1.77-3.21)
|
<0.0001
|
|
Asp < 65 vs. ≥ 65, μmol/L
|
11.7 (6.49-21.0)
|
<0.0001
|
|
6.33 (4.54-8.82)
|
<0.0001
|
|
Asn: Asp >1.5 vs. ≤ 1.5
|
7.00 (5.27-9.30)
|
<0.0001
|
|
7.99 (5.50-11.6)
|
<0.0001
|
|
Age ≥ 50 vs. < 50 years old
|
4.62 (3.79-5.64)
|
<0.0001
|
|
3.96 (2.99-5.24)
|
<0.0001
|
|
Female vs. male
|
2.55 (2.12-3.06)
|
<0.0001
|
|
1.82 (1.38-2.42)
|
<0.0001
|
|
Additive interaction model of asparagine to aspartate ratio and age a
|
|
Asn: Asp ≤1.5 & age < 50 years old
|
Reference
|
|
|
Reference
|
|
|
Asn: Asp ≤1.5 & age ≥ 50 years old
|
4.99 (2.60-9.60)
|
<0.0001
|
|
3.43 (1.61-7.29)
|
0.0014
|
|
Asn: Asp >1.5 & age < 50 years old
|
7.60 (4.16-13.9)
|
<0.0001
|
|
7.10 (3.60-14.0)
|
<0.0001
|
|
Asn: Asp >1.5 & age ≥ 50 years old
|
37.0 (20.5-66.9)
|
<0.0001
|
|
28.7 (14.6-56.3)
|
<0.0001
|
|
Interaction measure
|
Estimates
|
|
|
Estimates
|
|
|
RERI
|
25.4 (10.4-40.5)
|
|
|
19.2 (6.02-32.3)
|
|
|
AP
|
0.69 (0.62-0.76)
|
|
|
0.67 (0.57-0.77)
|
|
|
S
|
3.40 (2.64-4.39)
|
|
|
3.25 (2.32-4.55)
|
|
|
Additive interaction model of asparagine to aspartate ratio and sex b
|
|
Asn: Asp ≤1.5 & male
|
Reference
|
|
|
Reference
|
|
|
Asn: Asp ≤1.5 & female
|
2.09 (1.22-3.56)
|
0.0070
|
|
1.49 (0.76-2.93)
|
0.2676
|
|
Asn: Asp >1.5 & male
|
6.46 (4.34-9.62)
|
<.0001
|
|
7.19 (4.41-11.7)
|
<.0001
|
|
Asn: Asp >1.5 & female
|
21.2 (14.0-32.2)
|
<.0001
|
|
13.6 (8.10-22.9)
|
<.0001
|
|
Interaction measure
|
Estimates
|
|
|
Estimates
|
|
|
RERI
|
13.7 (7.48-19.9)
|
|
|
5.95 (1.60-10.3)
|
|
|
AP
|
0.64 (0.56-0.73)
|
|
|
0.44 (0.26-0.62)
|
|
|
S
|
3.09 (2.35-4.05)
|
|
|
1.89 (1.32-2.71)
|
|
Abbreviations: T2D, type 2 diabetes; Asn, asparagine; Asp, aspartate, OR, odds ratio; CI, confidence interval; RERI, risk due to interaction; AP, attributable proportion due to interaction; S, synergy index;
Multivariable analysis adjusted for body mass index (<18.5, 18.5~24.0, 24.0~28.0 and ≥28.0 kg/m2), systolic blood pressure (<140 and ≥140 mmHg), low-density lipoprotein cholesterol (<2.60 and ≥2.60 mmol/L) , high-density lipoprotein cholesterol (<1.00 mmol/L in male or <1.30 mmol/L in female as low level and ≥1.00 in male or ≥1.30 in female as high level), triglyceride (<1.70 mmol/L and ≥1.70 mmol/L) and sex in a or age (<50 and ≥50 years old) in b;
Significant elative excess risk due to interaction (RERI) >0, attributable proportion due to interaction (AP) >0 or synergy index (S) >1 indicates a significant additive interaction.
Using low asparagine to aspartate ratio and < 50 years of age as the reference, the OR was 3.43 (95% CI: 1.61-7.29) for individuals who were ≥50 years of age and had a low asparagine to aspartate ratio; and 7.10 (95% CI: 3.60-14.0) for individuals who were <50 years of age and had a high asparagine to aspartate ratio, after adjusting for confounders. Coexistence of older age and high asparagine to aspartate ratio sharply increased the effect size to 28.7 (95%CI: 14.6-56.3), with significant additive interaction (RERI: 19.2, 95%CI: 6.02-32.3; AR: 0.67, 0.57-0.77; S: 3.25, 2.32-4.55). (Table 2)
Similarly, using low asparagine to aspartate ratio and male as the reference and in multivariable analysis, the OR was 1.49 (95% CI: 0.76-2.93) in patients who were female and had a low asparagine to aspartate ratio; and 7.19 (95% CI: 4.41-11.7) in patients who were male and had a high asparagine to aspartate ratio. Being female and having a high asparagine to aspartate ratio had the highest OR, i.e., 13.6 (95% CI: 8.10-22.9). The additive interaction was significant (RERI: 5.95, 95%CI: 1.60-10.3; AR: 0.44, 0.26-0.62; S: 1.89, 1.32-2.71) (Table 2).
Second-order interaction of high asparagine to aspartate ratio and coexistence of female sex and older than 50 years old
There was a significant second-order additive interaction between high asparagine to aspartate ratio and coexistence of female gender and ≥50 years of age for risk of T2D (Table 3). Coexistence of female gender and ≥50 years of age greatly amplified the OR for T2D from 7.99 (5.50-11.6) to 34.4 (20.5-57.5). The additive interaction was highly significant (RERI: 26.1, 95% CI 11.0-41.2; AP: 0.76, 0.66-0.86; and S:4.58, 95% CI: 2.96-7.08) in multivariable analysis.
Table 3. Secondary interaction of age and sex with asparagine and aspartate homeostasis for T2D
|
|
OR (95% CI)
|
P-value
|
|
Univariable additive interaction model
|
|
|
|
Female and > 50 years of age =no plus Asn: Asp ≤1.5
|
reference
|
|
|
Female and >50 years of age =yes plus Asn: Asp ≤1.5
|
4.53 (2.57-7.98)
|
<.0001
|
|
Female and > 50 years of age=no plus Asn: Asp >1.5
|
6.76 (4.70-9.71)
|
<.0001
|
|
Female and >50 years of age=yes plus Asn: Asp >1.5
|
52.9 (34.4-81.2)
|
<.0001
|
|
Interaction measure
|
Estimates
|
|
|
RERI
|
42.6 (22.7-62.5)
|
|
|
AP
|
0.81 (0.74-0.87)
|
|
|
S
|
5.58 (3.90-8.00)
|
|
|
Multivariable additive interaction model
|
|
|
|
Female and > 50 years of age =no plus Asn: Asp ≤1.5
|
reference
|
|
|
Female and >50 years of age =yes plus Asn: Asp ≤1.5
|
2.78 (1.35-5.71)
|
0.0053
|
|
Female and > 50 years of age=no plus Asn: Asp >1.5
|
6.50 (4.24-9.95)
|
<.0001
|
|
Female and >50 years of age=yes plus Asn: Asp >1.5
|
34.4 (20.5-57.5)
|
<.0001
|
|
Interaction measure
|
Estimates
|
|
|
RERI
|
26.1 (11.0-41.2)
|
|
|
AP
|
0.76 (0.66-0.86)
|
|
|
S
|
4.58 (2.96-7.08)
|
|
Abbreviations: T2D, type 2 diabetes; OR, odds ratio; CI, confidence interval; RERI, risk due to interaction; AP, attributable proportion due to interaction; S, synergy index;
Multivariable analysis adjusted for body mass index (<18.5, 18.5~24.0, 24.0~28.0 and ≥28.0 kg/m2), systolic blood pressure (<140 and ≥140 mmHg), low-density lipoprotein cholesterol (<2.60 and ≥2.60 mmol/L) , high-density lipoprotein cholesterol (<1.00 mmol/L in male or <1.30 mmol/L in female as low level and ≥1.00 in male or ≥1.30 in female as high level) and triglyceride (<1.70 mmol/L and ≥1.70 mmol/L); Significant elative excess risk due to interaction (RERI) >0, attributable proportion due to interaction (AP) >0 or synergy index (S) >1 indicates a significant additive interaction.
Sensitive analysis
Excluding patients with diabetes complications or under anti-diabetic medications only slightly changed effects of asparagine to aspartate ratio on diabetes. The addictive interaction of asparagine to aspartate ratio and sex on T2D was significant (table S1).
Females increased T2D risk only in group with ≥50 years of age (OR, 2.35; 95%CI, 1.69-3.28); in male gender, OR (95%CI) of age ≥ 50 vs. < 50 years was 2.64 (1.92-3.62). In female gender, OR (95%CI) of age ≥ 50 vs. < 50 years was 6.65 (3.95-11.2). (table S2)