3.1 Gut microbiome structure shifted in aGVHD murine model
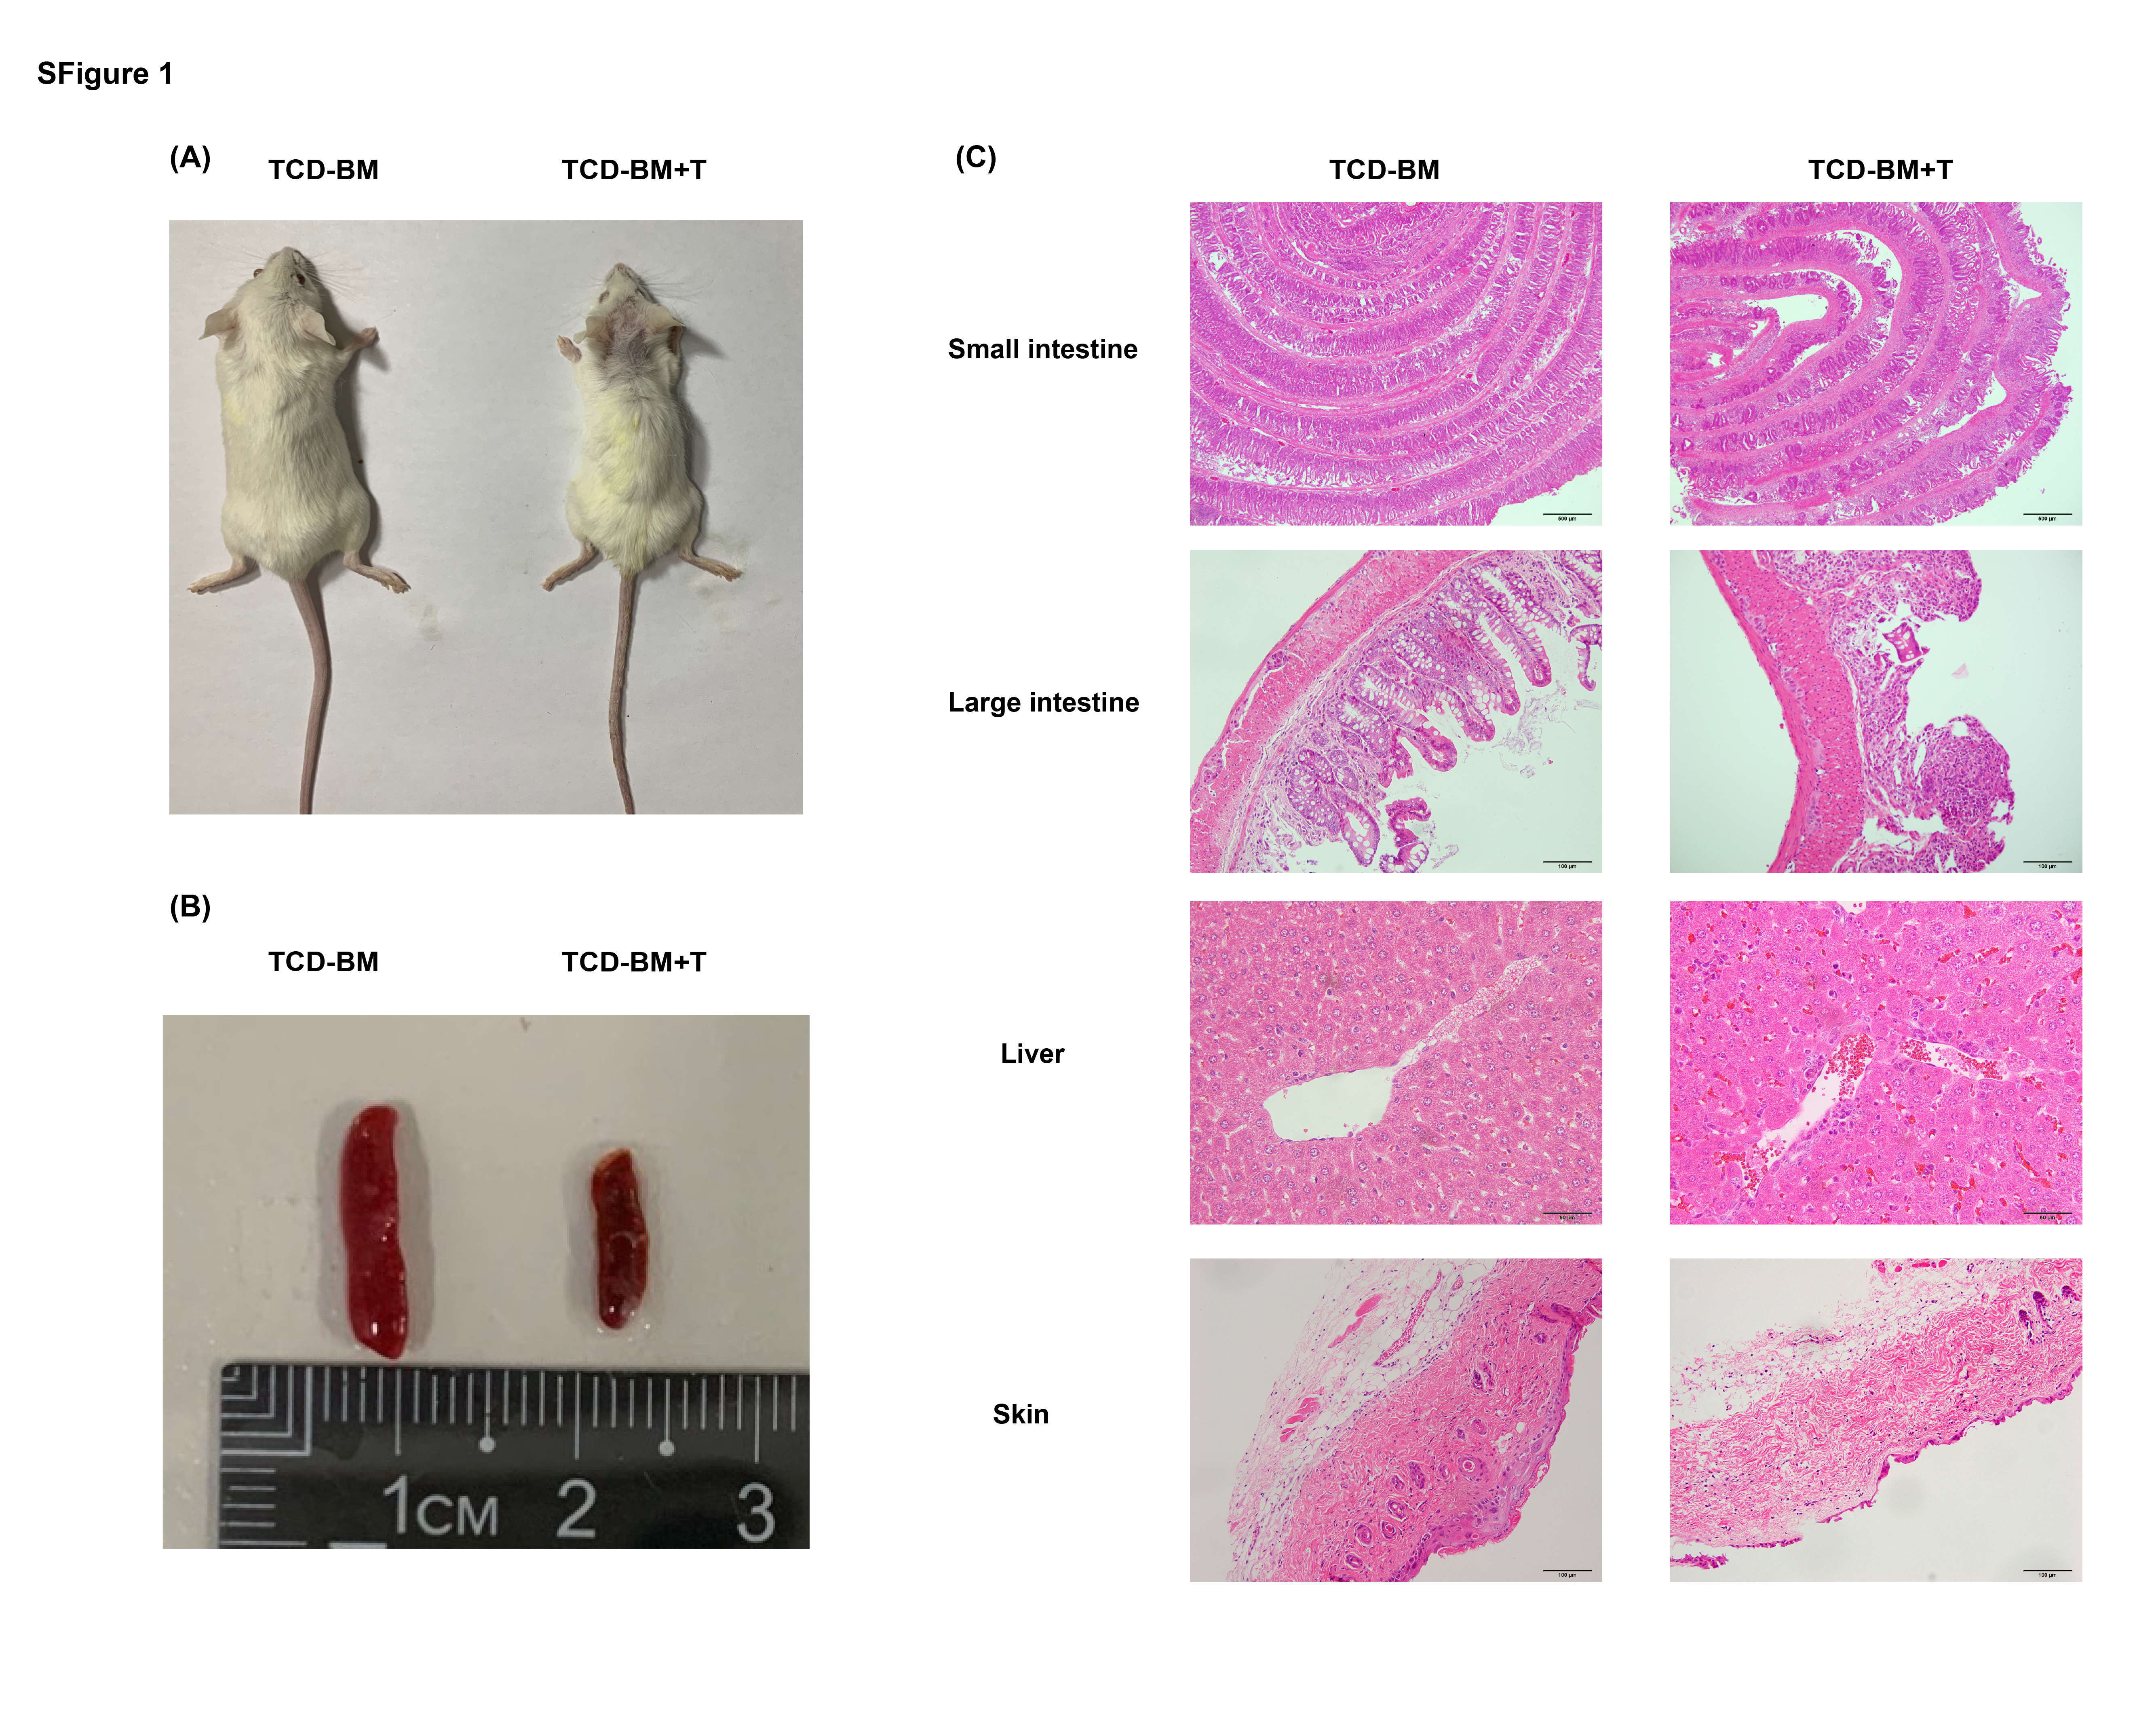
To determine whether aGVHD affects the parameters of gut environment, we initially used a well-established C57BL/6 (H-2Kb) into a BALB/c (H-2Kd) major histocompability complex (MHC) mismatch model (Fig. 1A). [34] TCD-BM + T cells group showed severe aGVHD symptoms including shortened survival time, rapid weight loss, severe diarrhea and injury in multiple organs including liver, intestine and skin (Fig. 1B-E and Supplementary Fig.S1). We wondered if the changes of bacterial flora diversity were associated with occurrence and development of aGVHD. Fecal microbiome was detected on day 14 and 28 after allo-HSCT. Although it is hard to obtain conspicuous differences on phylum levels, we did observe some changes between TCD-BM and TCD-BM + T cells recipients from the fecal microbial 16S rDNA gene sequencing data. Firmicutes, Bacteroidetes, Verrucomicrobia and Proteobacteria were the top four dominant components of the fecal microbes (Fig. 1G, H). Firmicutes, accounting for the largest proportion in the microbiota compositions, was decreased in TCD-BM + T cells group, while the other three phylum levels were upregulated. These variation trends remained constant across the whole progression of aGVHD.
Notably, we obtained some significant changes in genus level. The altered floras predominantly belonged to Firmicutes phylum. One of the most abundant genus, Lachnospiraceae_unclassified, maintained a high proportion in TCD-BM group but decreased in TCD-BM + T cells group (the mean of TCD-BM and TCD-BM + T cells groups, day14: 54.96% and 9.45%, p༜0.05; day 28: 38.28% and 11.90%, p༜0.05). Additionally, the consistent and significant differences in fold change on day 14 (p༜0.05) and 28 (p༜0.05) made the tendency even more convincing (Fig. 1I, J, Supplementary Table 1). The other microbiota belonging to Firmicutes were upregulated in TCD-BM + T cells group, such as Blautia, Clostridium XI, Clostridium XIVa (p༜0.05 on day 14) and Enterococcus (p༜0.05 on day 28). Other altered genera such as Proteus, belonging to Proteobacteria, and high-occupied Bacteroides, belonging to Bacteroidetes, were also upregulated in TCD-BM + T cells group. Another Bacteroidetes component Alistipes (p༜0.05 on day 28) was downregulated in TCD-BM + T cells recipients. All the tendencies were consistent, which suggested that the gut microbiome composition exhibited remarkable changes along with the occurrence and development of aGVHD.
3.2 Gut metabolome revealed dramatic reduction of tyrosine and related metabolites in aGVHD mice
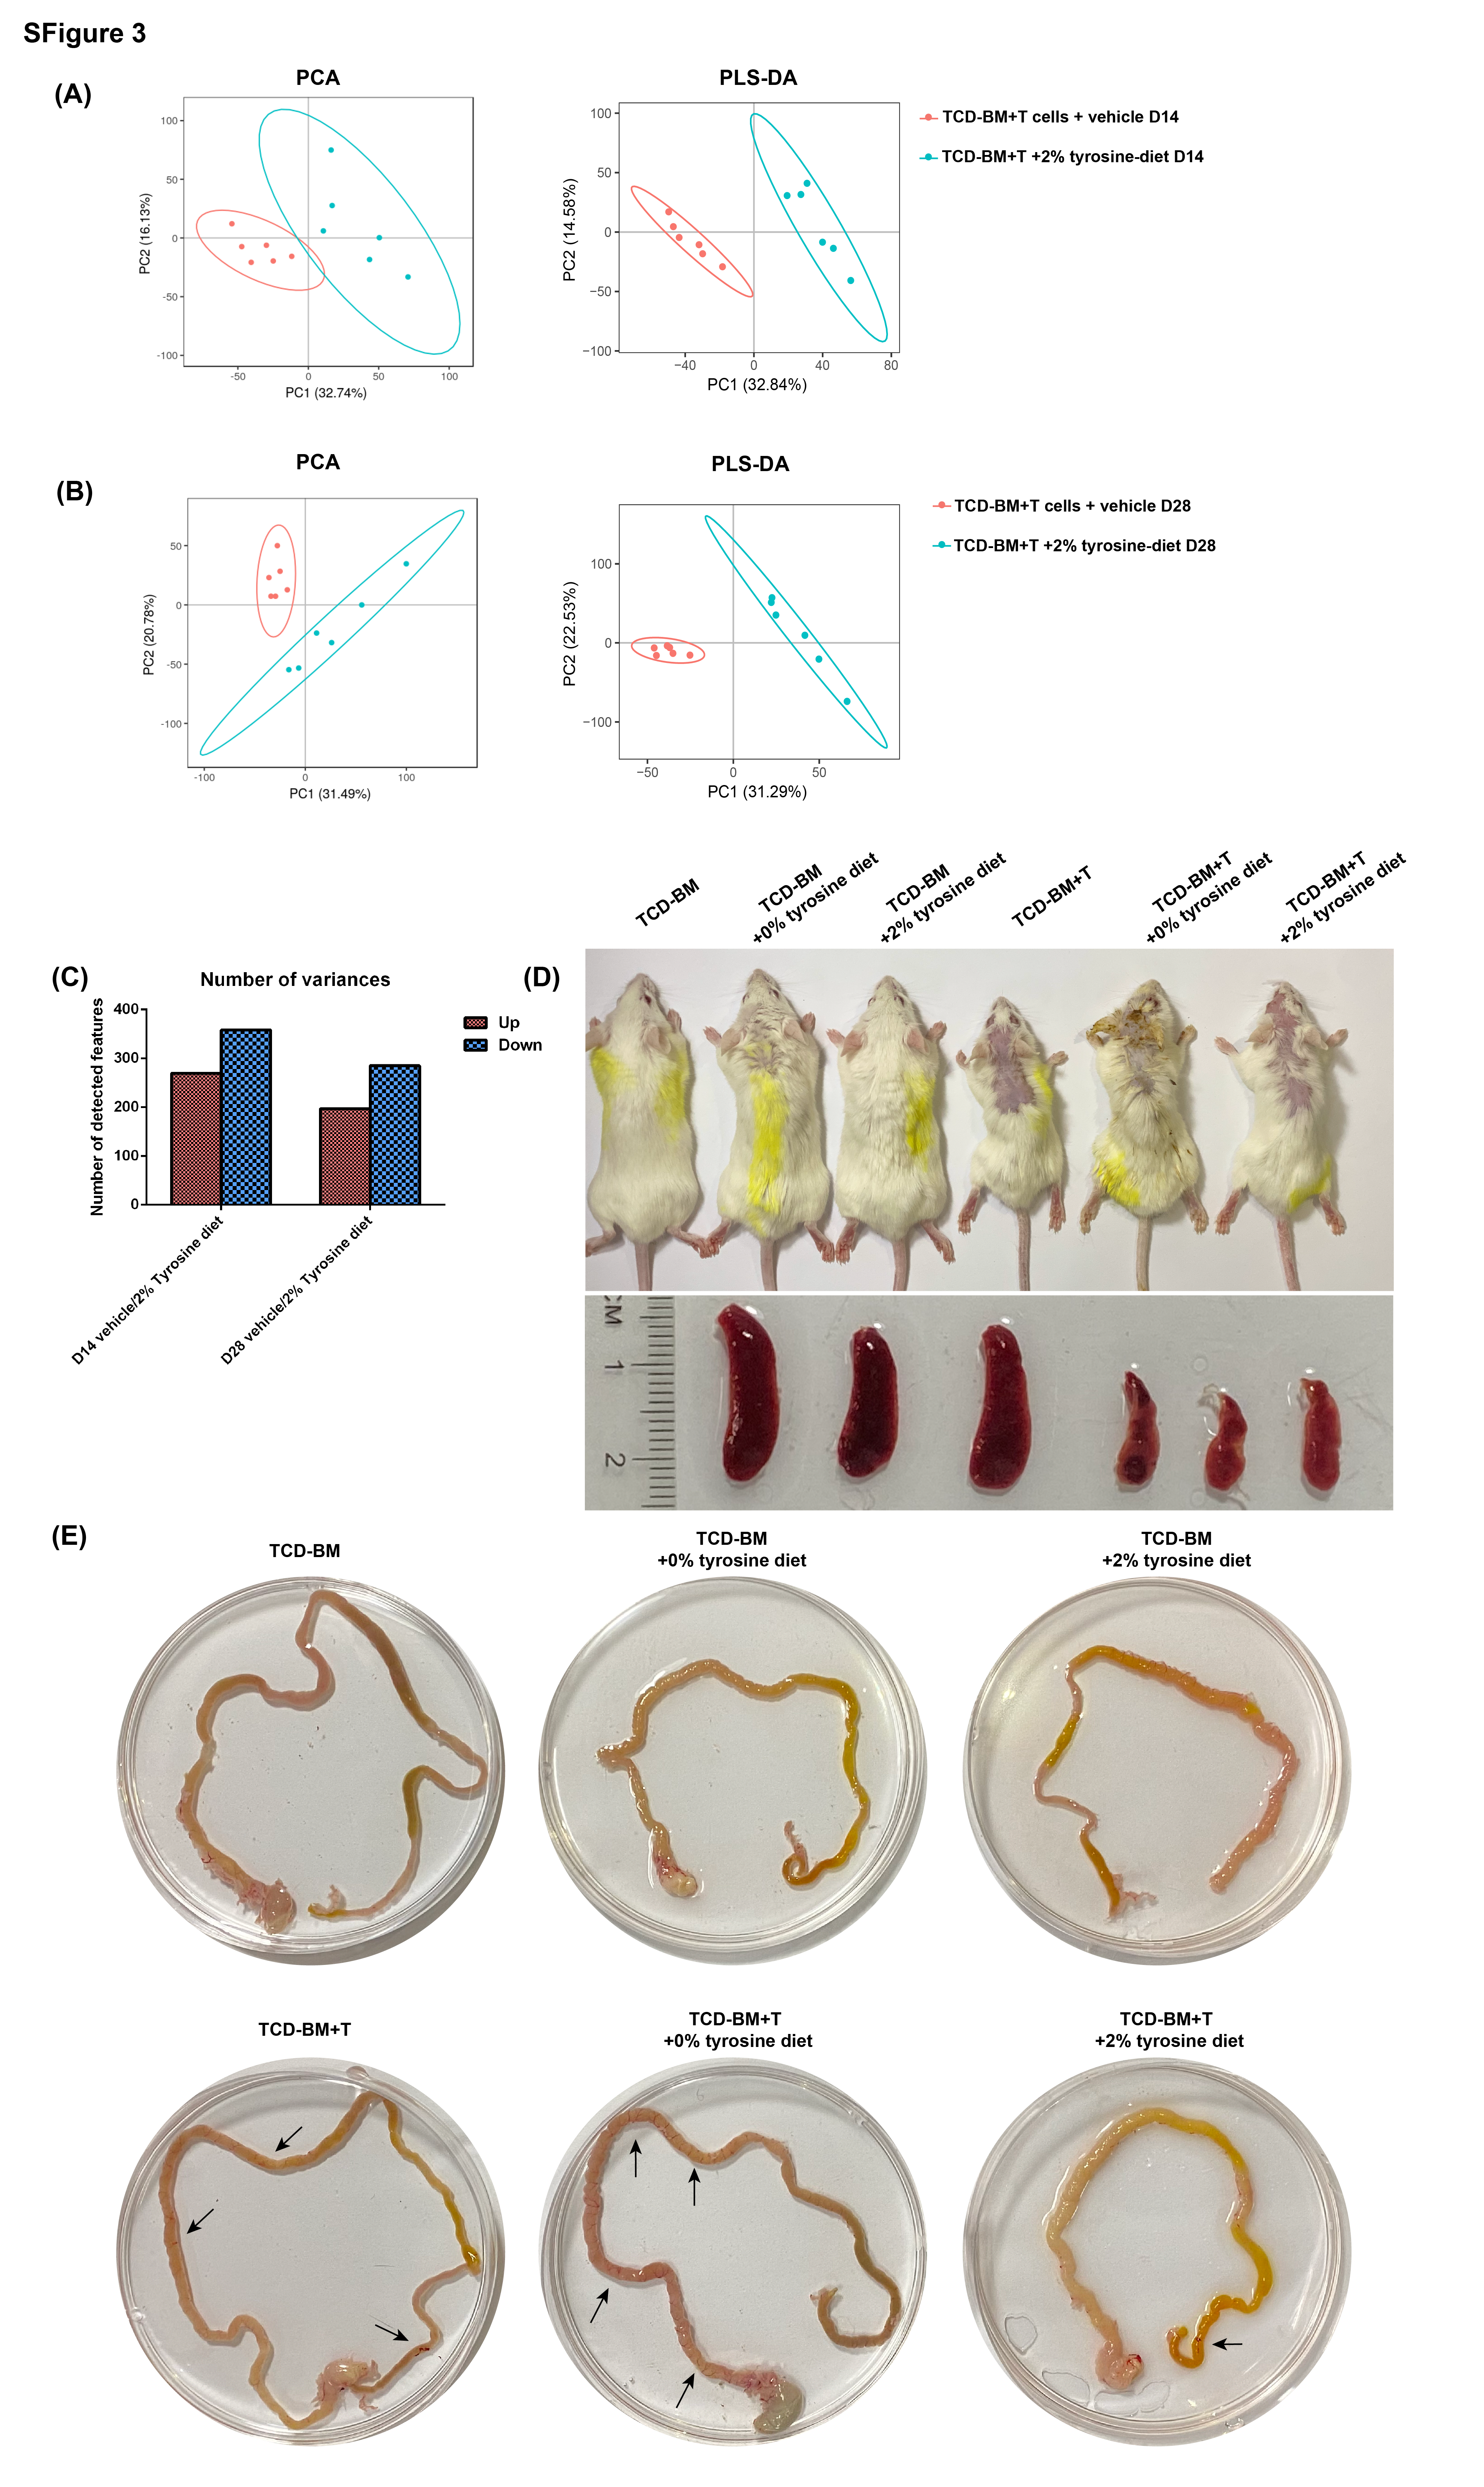
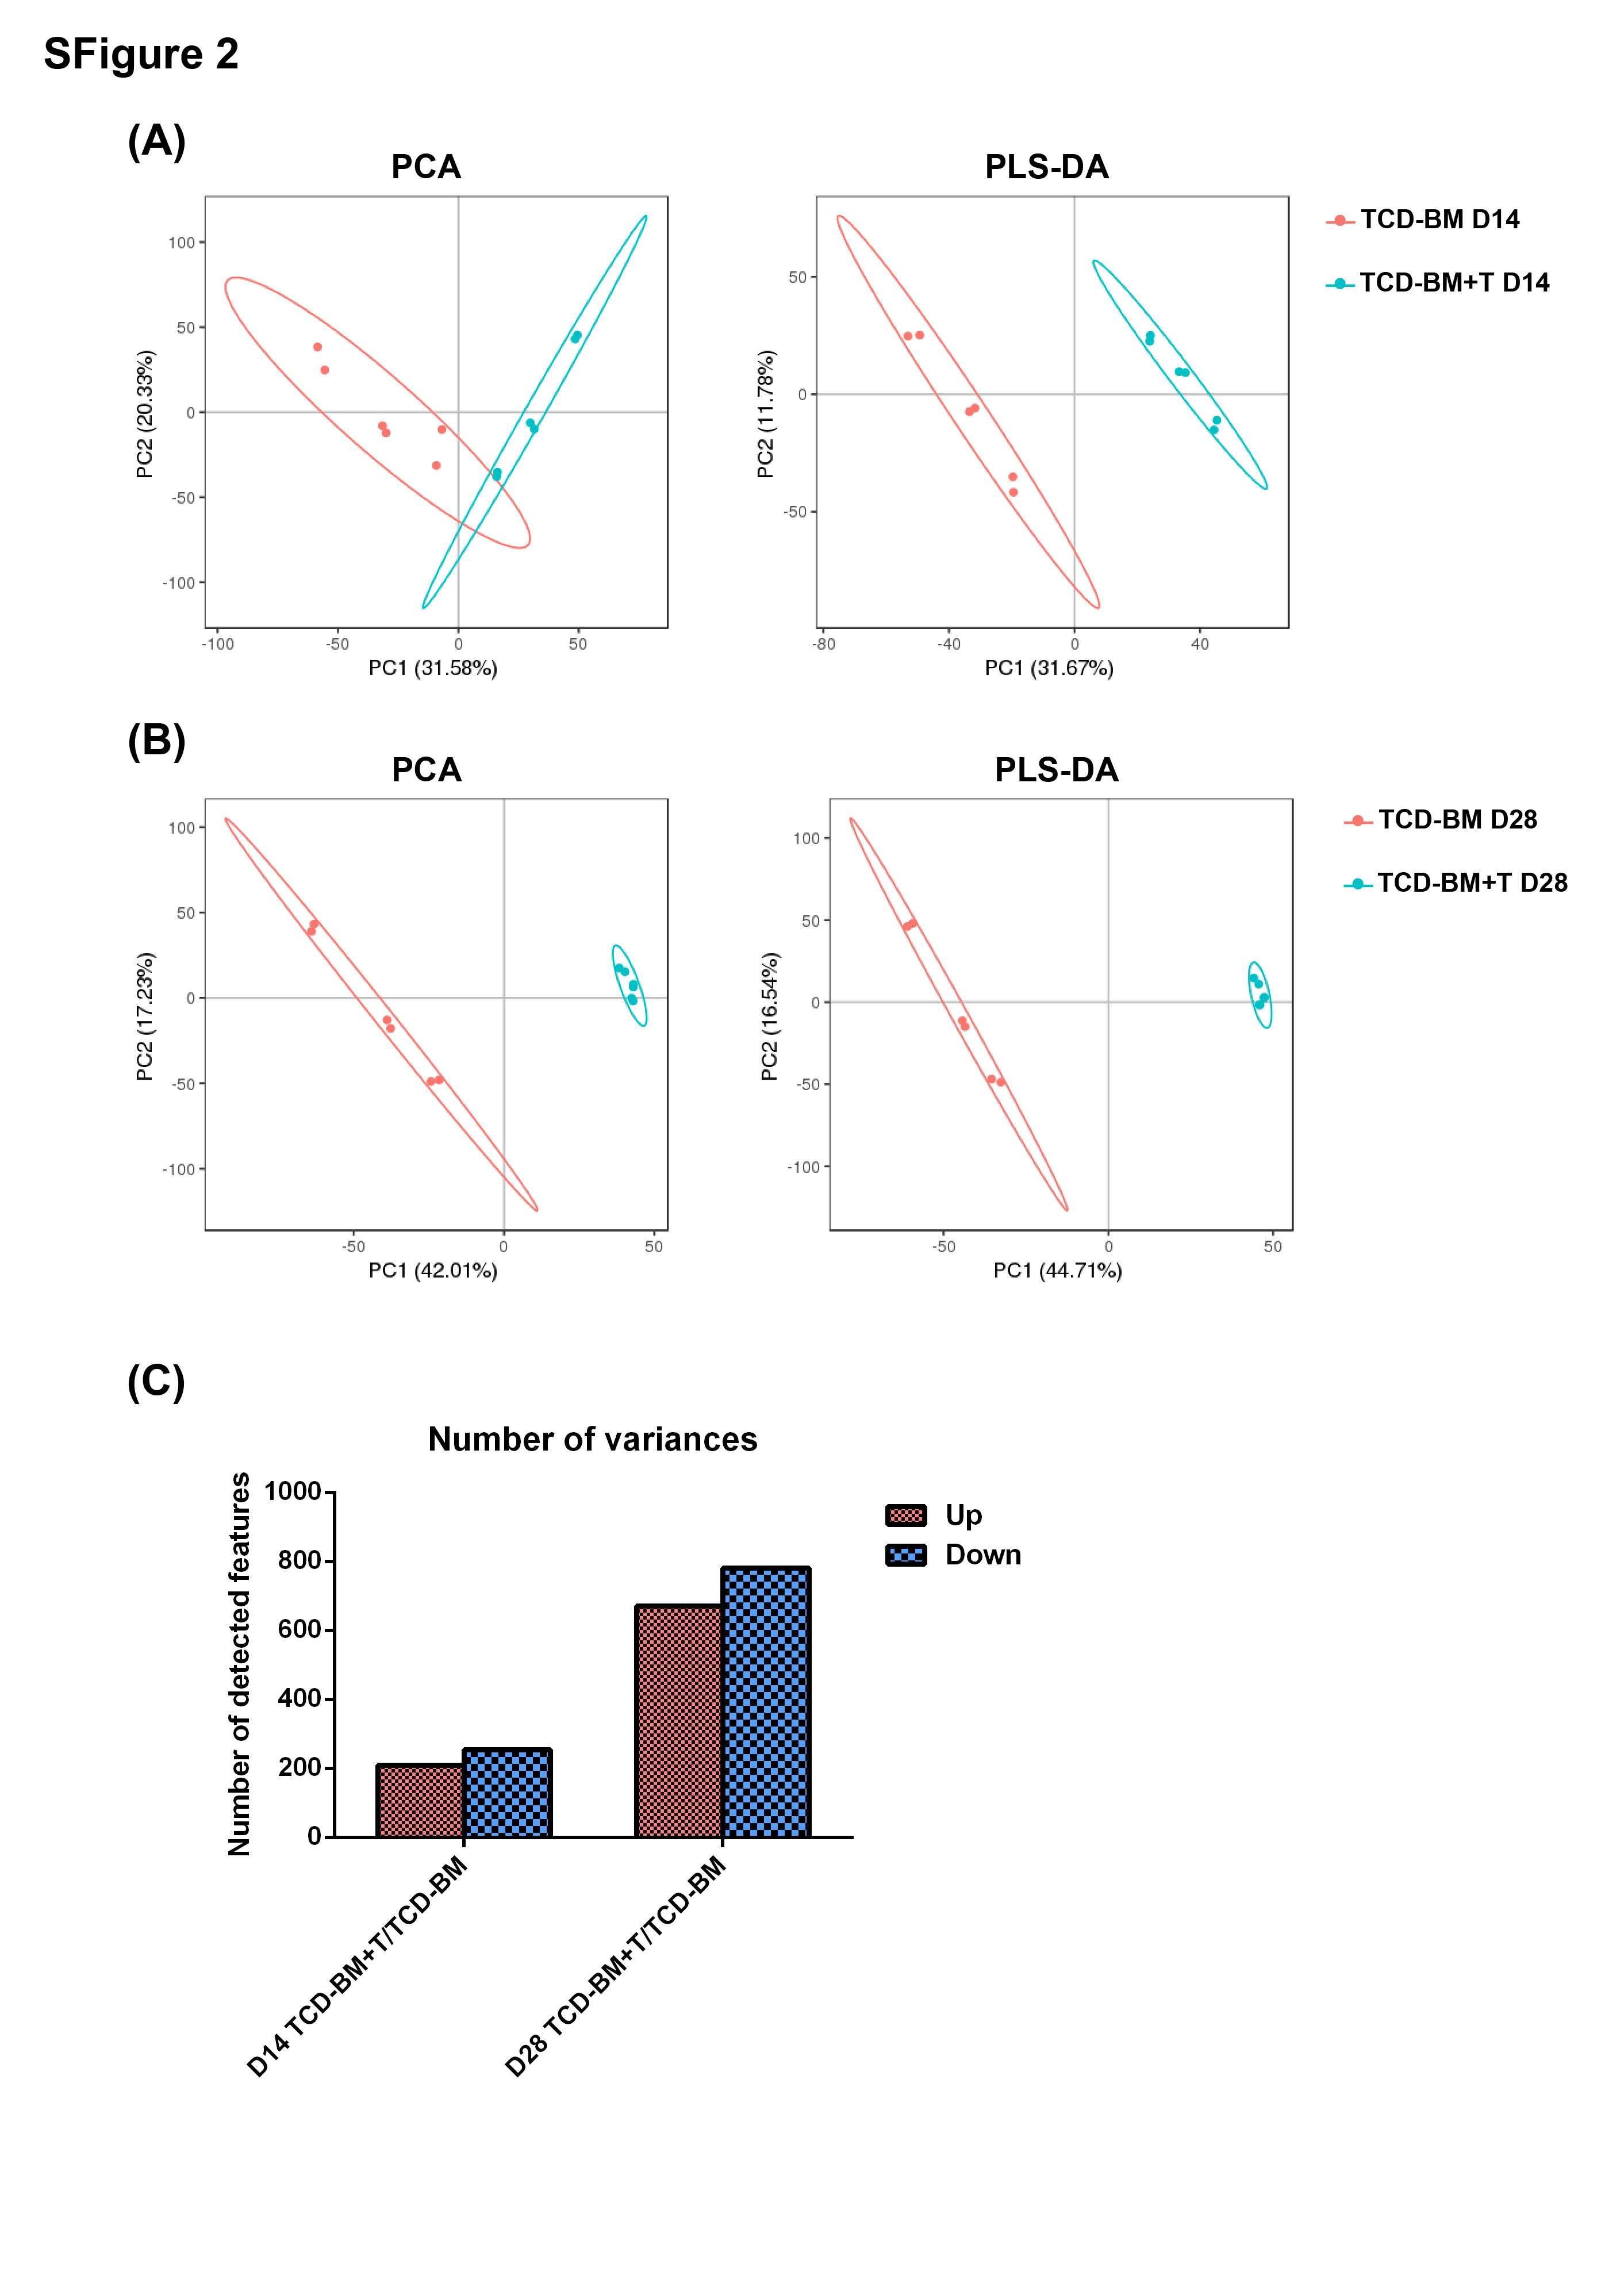
As microbiota alteration in aGVHD has been extensively explored, some studies stated that the microbiome structure strongly influences the metabolite profiles in multiple disease. [35, 36] We then followed the differences in the fecal metabolome after BMT. To confirm the implication of these metabolites at aGVHD onset, principal component analysis (PCA) was used to confirm whether aGVHD could be discriminated in multivariate analysis (Supplementary Fig.S2A, B). In the partial least squares-discriminant analysis (PLS-DA), the PLS-DA score plots indicated the discrepancies between TCD-BM and TCD-BM + T cells groups were reliable and suggested the rejection reactions leading to significant biochemical changes (Supplementary Fig.S2A,B). Based on pairwise comparisons of different metabolites between two groups and different aGVHD development stages, both of the two groups’ fecal metabolic profiles displayed depression at the early stage on day 14. However, the infertile situation was improved on day 28, which was corresponded to the reconstruction of bone marrow after the irradiation (Supplementary Fig.S2C).
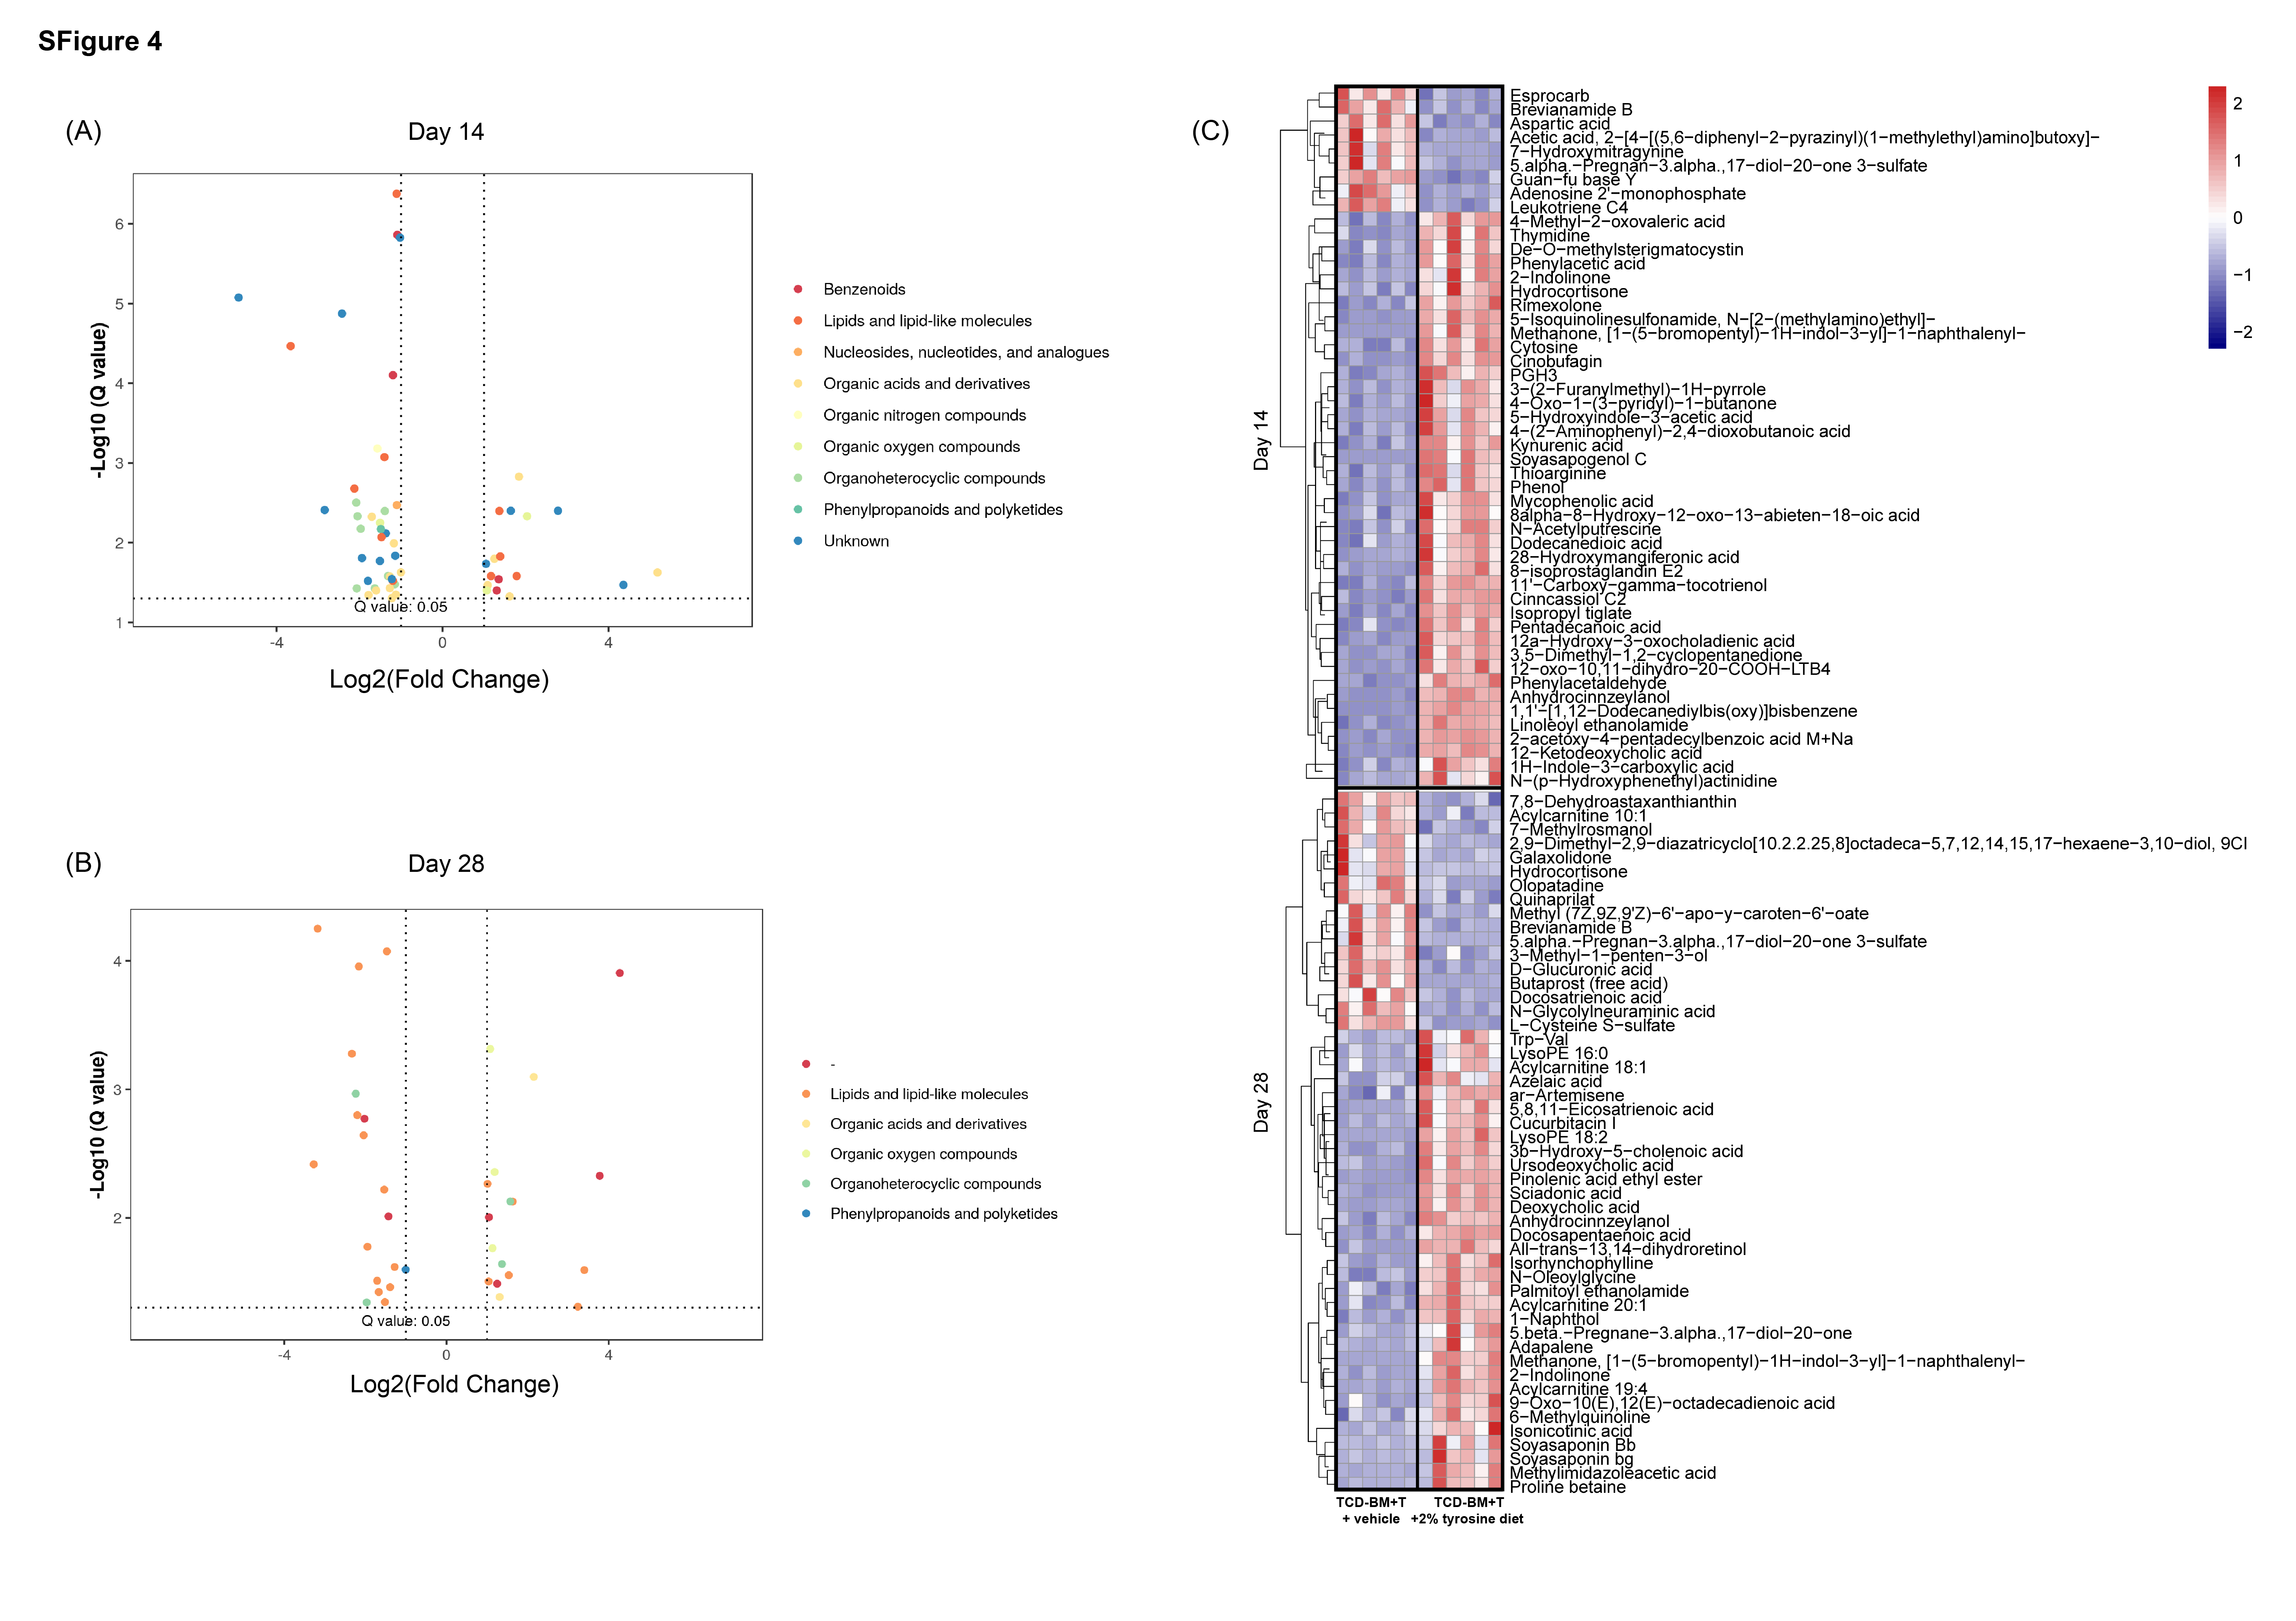
Metabolites with putative biological relevance were identified by comparison of the amount of each metabolite between TCD-BM and TCD-BM + T cells groups on day 14 (Fig. 2A) and 28 (Fig. 2B). Compared with transfusing TCD-BM only, TCD-BM + T cells groups were mainly characterized by a significant decrease in the amounts of lipid and lipid-like molecules, especially physalin P, acylcarnitine and 8-isoprostaglandin E2. Organic acids and derivatives also showed a declined trend in TCD-BM + T cells group, especially dihydrocaffeic acid 3-sulfate and tyrosine (Fig. 2C, Supplementary Table 2). Later, KEGG analysis was performed to analyze the pathways with all the significant different metabolites. According to the KEEG results, several amino acid related pathways attracted our attention. The pathways of phenylalanine, tyrosine and tryptophan biosynthesis ranked on the top (Fig. 2D). As recent discoveries have underscored that changes in the microbiota modulate the host immune system by modulating tryptophan metabolism, [37] we wandered whether another metabolite bears resemblance to it in the same pathway. Strikingly, the following several pathways, such as ubiquinone and other terpenoid-quinone biosynthesis and aminoacyl-tRNA biosynthesis, shared the same metabolite, tyrosine. Thus, we found that not only tyrosine but also the metabolites interacting with tyrosine demonstrating an overall downtrend in TCD-BM + T cells group. While tyrosine was remarkably diminished on day 14 (p < 0.01) and 28(p < 0.01) (Fig. 2E; Supplementary Table 3), L-Aspartic acid, L-Glutamic acid and S-Adenosylhomocysteine became significant (p < 0.01) on day 28 as the heatmap showed (Fig. 2F; Supplementary Table 3).
To study the correlations of the host microbiota-metabolomes system, we performed a spearman correlation analysis of tyrosine related metabolites and altered microbiota to explore the internal connections. In general, tyrosine located in the central of correlation network in both comparisons, and bacteria belonging to Firmicutes were closest related to selected metabolites (Fig. 2G, H). The components of the network in TCD-BM + T cells and TCD-BM groups were smaller and more scattered on day 14 than day 28. Still, we were able to detect the tyrosine-related metabolites correlated inversely with Clostridium XIVa, Blautia and Enterococcus on day 14 and 28. Interestingly, we found that all of genera in the network belonged to Firmicutes on day 28, which implied that this phylum might play a prominent role in aGVHD development. Collectively, these results indicate that the low levels of tyrosine in gut likely correlated with aGVHD occurrence and development.
3.3 Tyrosine supplement partially ameliorated aGVHD phenotype
Our results demonstrated that tyrosine declined in the gut accompanying with microbiota alteration in aGVHD. Subsequently, we reckoned whether tyrosine replenishment could have a positive effect on alleviation for aGVHD and further affect the microbiome structure and metabolite profiles. To test this, we supplied TCD-BM and TCD-BM + T cells group with 2% tyrosine diet that was higher than normal but within safety content and 0% tyrosine diet as the deprivation group respectively. Administration of tyrosine resulted in extension of total survival time, significant reduction of weight loss and decrease in aGVHD clinical scores in the early period of aGVHD (Fig. 3A-C), especially slighter diarrhea, and better physical status (Supplementary Fig.S3D). Notably, the TCD-BM + T cells + 2% tyrosine diet group displayed lower intestinal and skin pathology scores with improved intestinal epithelial structure, kept microvilli and tight junctions intact and more complete skin structure on day 14 after BMT (Fig. 3D, E). However, these advantages became weaker at the later stage of aGVHD, as shown that the weight variances and clinical scores of TCD-BM + T cells + 2% tyrosine diet group approached to TCD-BM + T cells + vehicle diet groups near the end of day 40. When mice with aGVHD were deprived from tyrosine by given 0% tyrosine diet, they displayed even worse survival rate and clinical scores than TCD-BM + T cells + vehicle diet groups (day 30, p༜0.01) .
As mice that had received TCD-BM only did not present any signs of aGVHD, deprived or extra tyrosine-diet had no impact on their survival rate until the end (Fig. 3A). In comparison, TCD-BM + 0% tyrosine diet group exhibited delayed weight regain and slight aGVHD symptoms at initial stage after BMT. The histopathologic analysis also displayed mild lesions on intestine and skin on day 14 (Fig. 3D, E). Above all, these results implied additional tyrosine diets only played a role in aGVHD status and influenced the early stage after allo-HSCT.
3.4 Tyrosine supplement amended gut microbiome and metabolome
Since we already observed the roles of tyrosine supplement in ameliorating aGVHD, we further verified its effects on gut environment. From the fecal microbiome analysis, we found that, after the tyrosine intervention, it is hardly to summarize the regularity of phylum variances. When phylum did not differ between the groups on day 14, Firmicutes persisted at low level in TCD-BM + T cells + 2% tyrosine diet group (p < 0.05) on day 28, while Bacteroidetes (p < 0.05) and Verrucomicrobia showed higher levels. (Fig. 4A, B). However, through the analysis of genera level, we supposed that tyrosine treatment could not only ameliorate aGVHD symptoms, but also restore the gut microflora to aGVHD-free condition. After 2% tyrosine supplement, the abundance of Lachnospiraceae_unclassified increased (p < 0.05, on day 28) and the fold changes of Bacteroides (p < 0.05, on day 14), Clostridium XI (p < 0.01, on day 28), Clostridium XIVa (p < 0.05, on day 14) and Enterococcus decreased (Fig. 4C, D; Supplementary Table 4). Notably, some microbiota that was insignificant in the comparison between TCD-BM and TCD-BM + T cells groups became striking after tyrosine intervention. For instance, not only the proportion (p < 0.05) but also the fold change (p < 0.01) of Barnesiella remarkably increased in TCD-BM + T cells + 2% tyrosine diet group on day 14. Although Escherichia only possessed a small fraction in all aGVHD groups, it reduced after 2% tyrosine intervention on day 14 (p < 0.01), whereas the opposite trend was observed on day 28 (p < 0.05). Besides, there was a sudden amplification of Lactobacillus on day 28 (TCD-BM + T cells + vehicle and TCD-BM + T cells + 2% tyrosine diet group: 37.48% and 15.34%, p < 0.01), which significant downregulated in 2% tyrosine diet group (p < 0.05).
The PCA and PLS-DA revealed grander different metabolites between TCD-BM + T cells with vehicle diet and 2% tyrosine diet groups (Supplementary Fig.S3A, B; Supplementary Table 5). From comparison statistics, we found the number of differential metabolites on day 14 was larger than that of day 28 (Supplementary Fig.S3C). Still, most of the different metabolites belong to the superclass of lipids and lipid-like molecules following by organheterocyclic compounds and organic acids and derivatives (Supplementary Fig.S4A-C; Supplementary Table 5). The fecal metabolomic profile showed the TCD-BM + T cells with 2% tyrosine diet group maintained high levels of tyrosine on day 14 (p < 0.01), moreover, its related metabolites including L-Glutamic acid, oxalacetic acid, S-Adenosylhomocysteine and homogentisic acid also showed upward trends (Fig. 4E; Supplementary Table 6). Yet, these differences disappeared on day 28 in accordance with the unsatisfied clinical and microbiota changes (Fig. 4F; Supplementary Table 6). Together, these data exemplified that the replenishment of tyrosine could ameliorate aGVHD at the early stage, at the same time, change the structure of the gut microbiota and the fecal metabolic phenotype.
The larger network components displayed in the comparison of TCD-BM + T cells with vehicle diet and 2% tyrosine diet groups. On day 14, L-Aspartic acid was positively connected with Escherichia and Akkermansia. Another attractive network node, tyramine, a monoamine compound and trace amine derived from tyrosine, was positively correlated with Bacteroides, Escherichia and Clostridium_sensu_stricto. (Fig. 4G). At the same time, Bacteroides negatively connected with tyrosine and S-Adenosylhomocysteine. The oxalacetic acid also displayed a positive correlation with Mucispirillum, but which only occupied a small proportion. Just as the treatment of tyrosine did not meet the expectation on day 28, the correlation network showed that tyrosine faded out of the center at the later stage of aGVHD. As there was only negative correlation between tyrosine and Firmicutes microbiota on day 28, S-Adenosylhomocysteine became the central node of five microbiota including correlated positively with Lactobacillus, Clostridium_XI and inversely with Blautia. (Fig. 4H). In all, we still believed that there was a close correlation between the gut microbiota and tyrosine in aGVHD models.