Prophylactic calcitriol soaking exerted dose-dependent anti-mycobacterium effects in adult zebrafish
Calcitriol has been reported to have therapeutic effect against mycobacterium infection[22, 23]. To determine if this effect is prophylactic and dose-dependent, one-month old (30 days post fertilization, dpf) adult zebrafish were firstly treated with calcitriol soaking for one month, then were challenged with M. marinum through tail vein injection (at 60 dpf), and were monitored for another half a month (61–75 dpf) (Fig. 1a). At the time point of 75 dpf, the body weight of M. marinum challenged zebrafish was significantly decreased (Fig. 1b, P < 0.001). Low-dose (25 µg/L) and moderate-dose (250 µg/L) calcitriol soaking has no significant effect to the weight loss induced by M. marinum, while high-dose (2500 µg/L) calcitriol soaking markedly recovered the weight loss (Fig. 2a, P < 0.05). Corresponding to this finding, the bacterial load in M. marinum challenged zebrafish was reduced by high-dose calcitriol soaking (Fig. 1c, P < 0.0001), and by low-dose calcitriol soaking (with no statistical significance), but seemed to be not affected by moderate-dose calcitriol soaking (Fig. 1c). These results suggested that prophylactic calcitriol soaking exerts dose-dependent effects on body weight and bacterial load in M. marinum challenged adult zebrafish, with significantly recovered weight loss by high-dose calcitriol and reduced the bacterial load by low-/high-dose calcitriol, but both seemed not be affected by moderate-dose calcitriol.
Prophylactic calcitriol soaking induced dose-dependent anti-inflammatory effects in M. marinum infected adult zebrafish
To further determine the effects of prophylactic calcitriol soaking to the inflammatory level of M. marinum challenged zebrafish, we measured the relative expression levels of three major inflammatory factors, including IL-1β, TNF-α and IFN-γ (Figure 1 d-f). Significant elevated IL-1β (Figure 1d, P < 0.01) and IFN-γ (Figure 1e, P < 0.01) were observed in M. marinum challenged zebrafish, while TNF-α was also elevated (Figure 1f, with no statistical significance comparing to the control group). IFN-γ (Figure 1e) and TNF-α (Figure 1f) were significantly down-regulated by low-dose or high-dose calcitriol, while IL-1β was significantly down-regulated by high-dose calcitriol (Figure 1d, P < 0.01) rather than low-dose calcitriol (Figure 1d, P > 0.05). Interestingly, moderate-dose calcitriol seemed to have no significant effect on the levels of IFN-γ (Figure 1e, P > 0.05) and TNF-α (Figure 1f, P > 0.05), and even up-regulated the elevated level of IL-1β (Figure 1d, P < 0.05). When comparing among the three doses of calcitriol, moderate-dose calcitriol significantly up-regulated the levels of IL-1β (Figure 1d, P < 0.01) and TNF-α (Figure 1f, P < 0.01). These results demonstrated that prophylactic calcitriol soaking exerted dose-dependent anti-inflammatory effects in M. marinum challenged zebrafish, with low- and high-dose calcitriol significantly down-regulating the elevated inflammatory levels but moderate-dose calcitriol exerting pro-inflammatory effects in an opposite direction.
Prophylactic calcitriol soaking induced metabolomic shift in M. marinum infected adult zebrafish
Because moderate-dose prophylactic calcitriol soaking exerted pro-inflammatory effects and no marked effect to the weight loss and the bacterial load in M. marinum challenged zebrafish in contrast to low- and high-dose calcitriol soaking, we performed 1H-NMR metabolomic profiling to investigate the potential underlying mechanism. Scatter plot of PCA (Fig. 2a) demonstrated that the metabolome of M. marinum challenged zebrafish with prophylactic calcitriol soaking were clearly separated, suggesting that metabolomic shifts occurred in response to different dose of calcitriol. To further evaluate the metabolomic shift, we performed OPLS-DA among the M. marinum challenged zebrafishes receiving low-/moderate-/high-dose of prophylactic calcitriol soaking. From the scatter plot of OPLS-DA among the three dose groups (Fig. 2b, Q2 = 0.77, indicating that the OPLS-DA model explained 77.0% of sample variation), moderate-dose calcitriol group was far away from low-dose and high-dose calcitriol groups along the X-axis (explained 66.7% of the variation in the independent variable X (R2X = 0.677)), and clustered together along the Y-axis (explained 83.3% of the variation in the categorical variable Y (R2Y = 0.833)). While low-dose group and high-dose calcitriol group was also separated with a relatively high with-in group variation (Y-axis) in high-dose calcitriol group. These results suggested that larger metabolic shift occurred in moderated-dose calcitriol group than in high-dose calcitriol group of M. marinum challenged zebrafish.
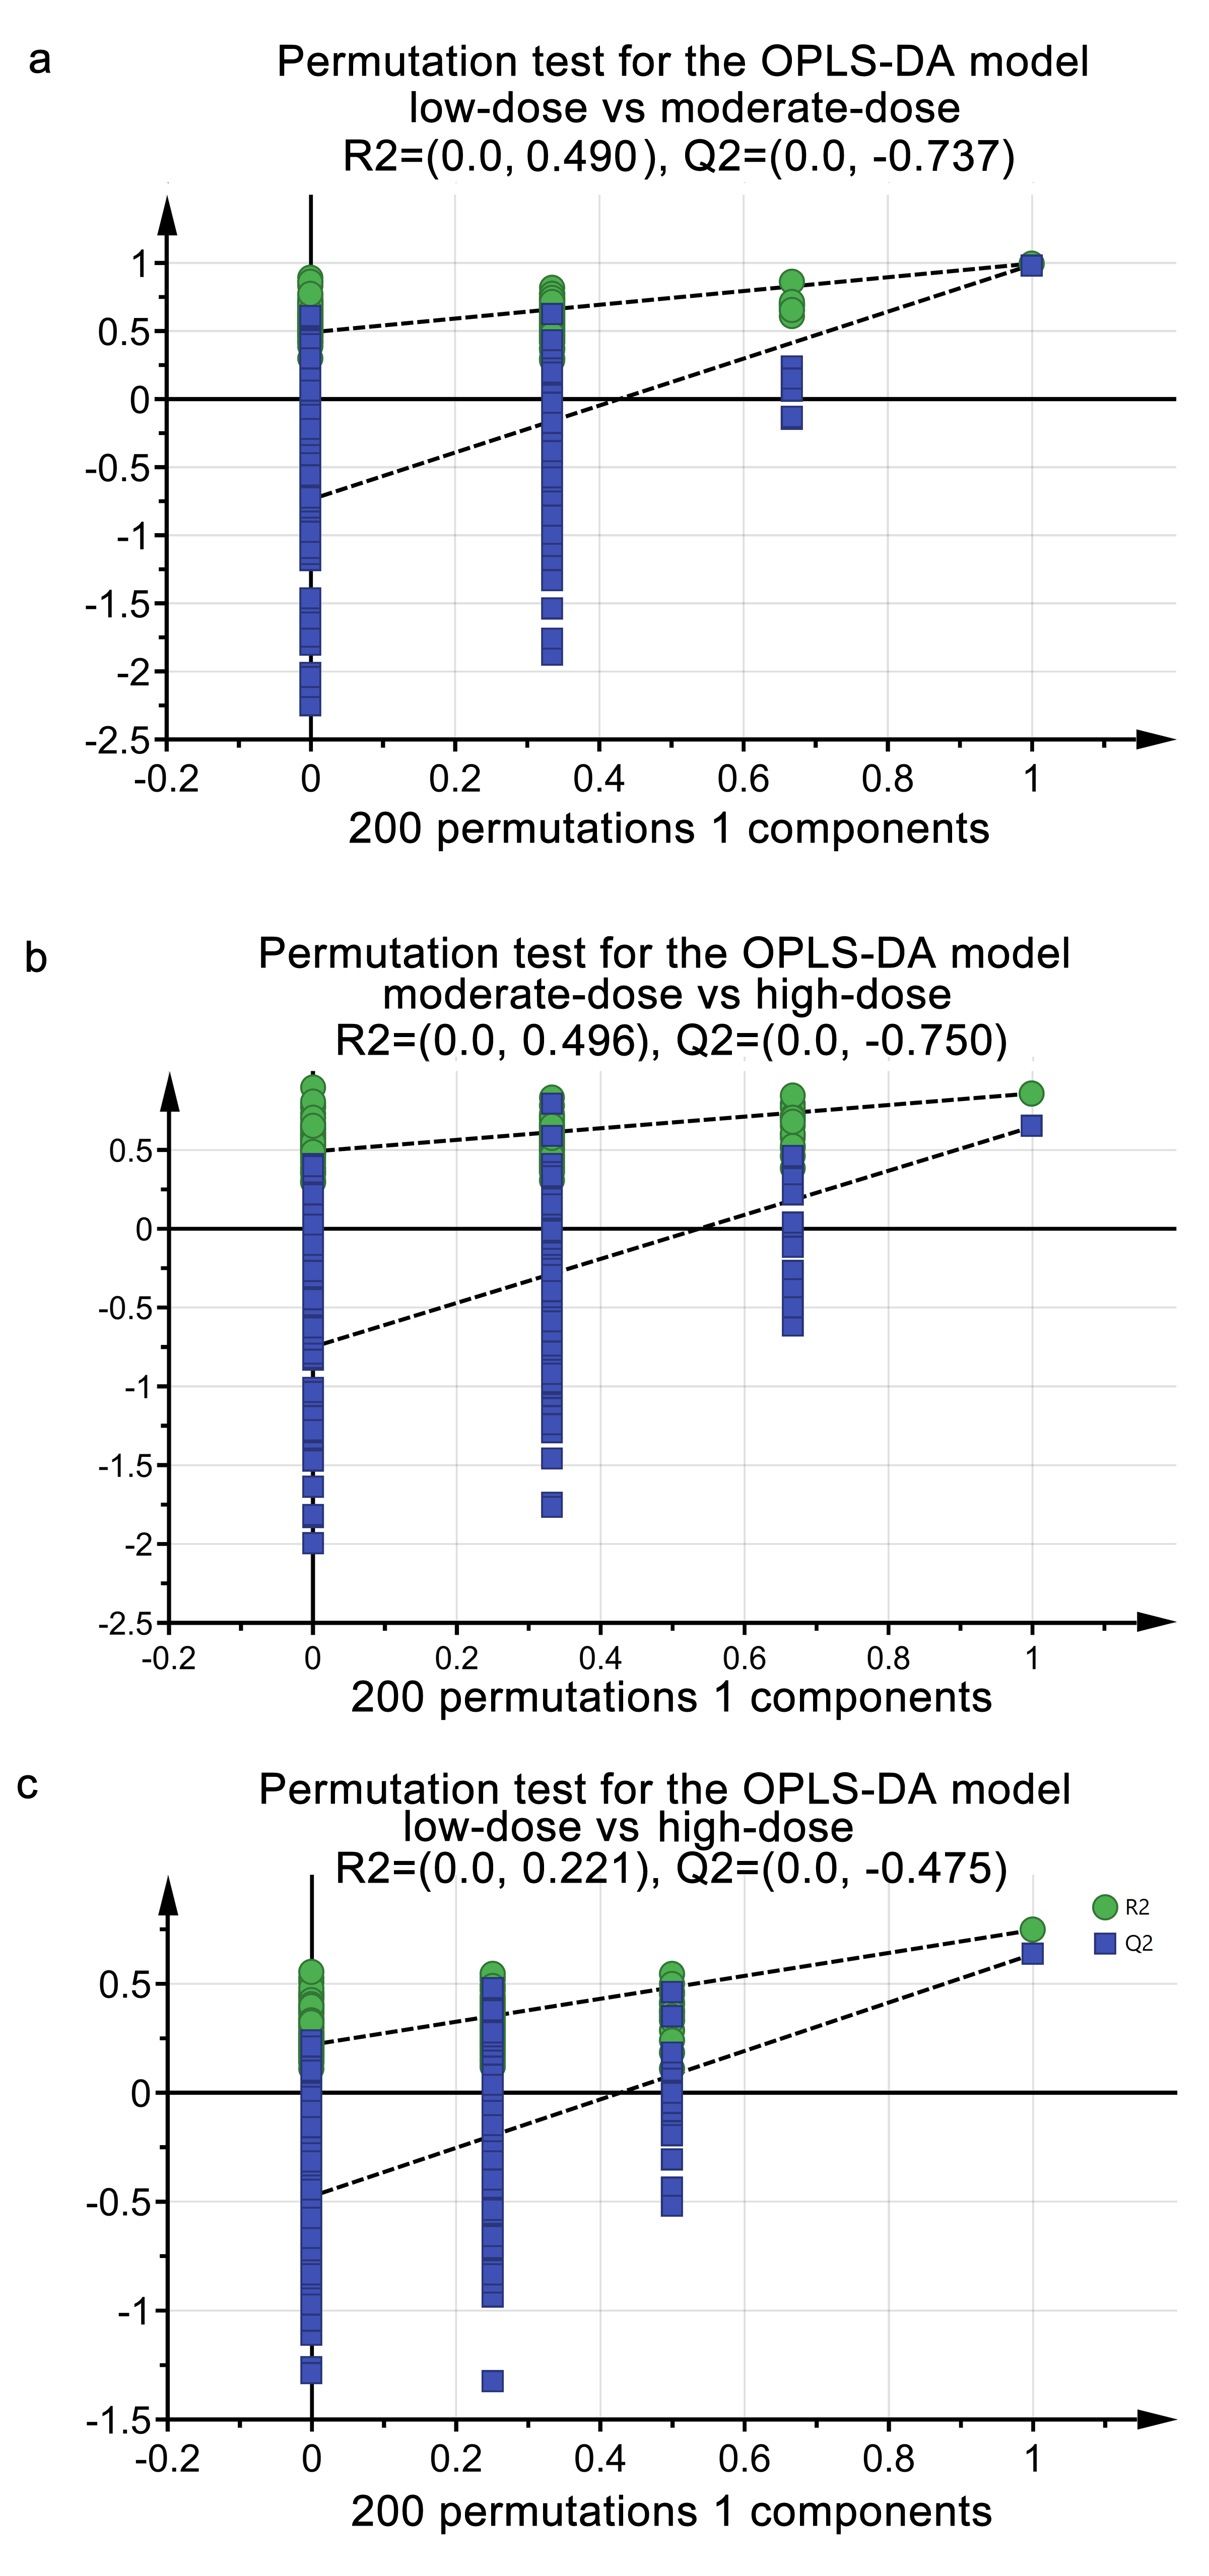
To determine the metabolites contributing to the metabolomic shift among different dose of calcitriol, we performed pair-wised OPLS-DA (Fig. 2c, e, g validated by 200-step permutation tests in Figure S1 a-c) and S-plot analysis (Fig. 2d, f, h). A total of 895 1H-NMR features were profiled, from which 692 features were retained after removal of features with minus relative abundances in over half of the sample. Eight one features with altered between-group abundances among the three groups of calcitriol soaking were obtained, which met the criteria that VIP ≥ 1 and fdr-adjusted P < 0.05 in an independent t-test. Totally 29 metabolites from the 81 features with altered between-group abundances were structurally identified (Table 1), among which the abundances of 22 metabolites (Fig. 3) were down-regulated and the abundance of methylguanidine was up-regulated from low-dose across moderate-dose to high dose calcitriol, the abundances of 7 metabolites were up-regulated by moderate-dose calcitriol but down-regulated by high-dose calcitriol (Fig. 3, marked with an asterisk behind the metabolite name). These results suggested that a larger part of 22 metabolites with altered abundances were strictly in response to dose-gradient prophylactic calcitriol soaking, while a smaller part of 7 metabolites were co-varied with the bacterial load and inflammatory factors.
Table 1
Altered metabolites in M. marinum challenged zebrafish receiving prophylactic soaking
|
Metabolite
|
Chemical shift
|
VIP
|
p[1]
|
p(corr)[1]
|
P-Value
|
fdr-adjusted P-Value
|
|
N-Acetyl-L-alanine
|
1.315d, 2.000s
|
2.18
|
-0.09
|
-0.87
|
5.31E-03
|
9.21E-03
|
|
Palmitoylcarnitine
|
2.69d, 3.20s, 3.70d, 3.83m, 5.58dt
|
1.02
|
-0.04
|
-0.76
|
2.79E-02
|
3.02E-02
|
|
Putrescine
|
1.754m, 3.040t
|
3.83
|
-0.16
|
-0.78
|
1.69E-02
|
2.09E-02
|
|
L-Histidine
|
3.16dd, 3.98dd, 7.09d, 7.90d
|
1.13
|
-0.05
|
-0.74
|
4.87E-03
|
8.74E-03
|
|
D-Glucuronic acid
|
3.290t, 4.085d, 4.649d, 5.250d
|
4.17
|
-0.17
|
-0.93
|
1.53E-03
|
5.89E-03
|
|
Methylguanidine
|
2.833s, 3.366s
|
17.60
|
0.72
|
0.84
|
7.58E-03
|
1.23E-02
|
|
Taurine
|
3.250t, 3.417t
|
2.88
|
-0.12
|
-0.90
|
2.91E-03
|
7.30E-03
|
|
3-Methylxanthine
|
3.510s, 8.020s
|
1.74
|
-0.07
|
-0.76
|
2.59E-02
|
2.87E-02
|
|
L-Threonine
|
1.316d, 3.575d
|
1.48
|
-0.06
|
-0.82
|
2.95E-03
|
7.30E-03
|
|
N-Acetylneuraminic acid
|
2.009m, 2.045s, 3.718m, 3.752t, 4.019t
|
1.36
|
-0.06
|
-0.85
|
3.75E-03
|
7.50E-03
|
|
Mannitol
|
3.649dd, 3.771d, 3.841dd
|
1.47
|
-0.06
|
-0.94
|
2.57E-04
|
2.70E-03
|
|
Dimethylglycine
|
2.910s, 3.710s
|
1.37
|
-0.06
|
-0.78
|
1.37E-02
|
1.87E-02
|
|
Propionylglycine
|
1.113t, 2.300q, 3.745d
|
1.69
|
-0.07
|
-0.78
|
1.49E-02
|
1.93E-02
|
|
Guanidoacetic acid
|
3.780s
|
1.53
|
-0.06
|
-0.73
|
1.17E-02
|
1.69E-02
|
|
L-Allothreonine
|
1.195d, 3.835d
|
1.93
|
-0.08
|
-0.94
|
6.28E-04
|
5.08E-03
|
|
N-Acetylgalactosamine
|
2.05d, 3.875d, 3.910d, 3.995d, 4.117m, 5.225d
|
1.30
|
-0.05
|
-0.87
|
1.70E-03
|
5.89E-03
|
|
Betaine
|
3.250s, 3.890s
|
1.83
|
-0.08
|
-0.81
|
1.84E-02
|
2.12E-02
|
|
7-Methylxanthine
|
3.91d, 7.84d
|
1.90
|
-0.08
|
-0.82
|
8.09E-03
|
1.28E-02
|
|
2-Hydroxybutyric acid
|
0.886t, 1.641m, 3.990dd
|
1.33
|
-0.05
|
-0.79
|
2.53E-03
|
7.30E-03
|
|
Caffeine
|
3.410s, 3.590s, 4.000s
|
1.25
|
-0.05
|
-0.83
|
1.32E-04
|
2.70E-03
|
|
FAD
|
2.32s, 2.39s, 4.06m, 5.82d, 7.54s, 7.85s, 8.30s
|
1.58
|
-0.06
|
-0.94
|
5.05E-05
|
2.63E-03
|
|
Carnosine
|
2.672q, 3.216t, 7.052s, 8.015s
|
1.62
|
-0.07
|
-0.82
|
1.45E-02
|
1.93E-02
|
|
Deoxyuridine
|
3.845dd, 4.052m, 5.895d, 6.287t, 7.850d
|
1.62
|
-0.07
|
-0.81
|
3.63E-03
|
7.50E-03
|
|
Hypoxanthine
|
8.170s, 8.200s
|
1.11
|
-0.05
|
-0.79
|
2.69E-03
|
7.30E-03
|
|
Tryptamine
|
3.170t, 3.337t, 7.320s, 7.545d, 7.695d
|
1.05
|
-0.05
|
-0.69
|
4.11E-02
|
4.90E-02
|
|
Choline
|
3.189s, 4.056m
|
2.98
|
-0.12
|
-0.65
|
4.15E-02
|
2.99E-01
|
|
Glycerophosphocholine
|
3.200s, 3.637m, 4.305m
|
5.71
|
-0.23
|
-0.89
|
9.30E-03
|
1.49E-01
|
|
p-Hydroxyphenylacetic acid
|
3.440s, 6.850d, 7.150d
|
2.17
|
-0.09
|
-0.90
|
9.60E-03
|
1.49E-01
|
|
Creatine
|
3.020s, 3.920s
|
2.91
|
-0.12
|
-0.72
|
1.50E-02
|
1.79E-01
|
|
p[1], covariance coefficient calculated with the principle component 1 of the OPLS-DA model. FAD, Flavin adenine dinucleotide.
|
|
p(corr)[1], correlation coefficient calculated with the principle component 1 of the OPLS-DA model. fdr: false discovery rate.
|
|
s: single-peak. d, double peak. t, triplet peak. q, quarter peak. m, multiple peaks.
|
Prophylactic calcitriol soaking induced metabolomic shift was associated with its anti-mycobacterium/anti-inflammatory effects
Because the altered metabolites contributing to the metabolic shift induced by prophylactic calcitriol soaking in M. marinum challenged zebrafish co-varied with the dose-gradients of calcitriol or inflammatory factors, we performed spearman rank correlation analysis to confirm the associations among the altered metabolites, the weight loss, the bacterial load, and the inflammatory factors. The spearman rank correlation matrix (Figure 4a, Table S1-S2) exhibited that TNF-α was positively correlated with Dimethylglycine (ρ =0.60, P < 0.01); the body weight was positively correlated with Methylguanidine (ρ =0.70, P < 0.01) and negatively correlated with L-Allothreonine, Mannitol, N-Acetylgalactosamine, Hypoxanthine, L-Histidine, Creatine, N-Acetylneuraminic acid, Betaine, D-Glucuronic acid, Palmitoylcarnitine, 2-Hydroxybutyric acid, Putrescine, L-threonine, and Guanidoacetic acid (ρ < -0.532, P < 0.01); the bacterial load was negatively correlated with most of the altered metabolites (P < 0.05) with lower correlation coefficient (the absolute ρ value less than 0.53). Among the altered metabolites, Methylguanidine was negatively correlated with most metabolites, the above TNF-α/body weight/bacterial load associated metabolites were positively correlated with each other (Figure 4a, Table S1-S2, ρ > 0.532, P < 0.01). These results demonstrated that the metabolites contributing to the metabolic shift by prophylactic calcitriol soaking in M. marinum challenged zebrafish correlated with each other and with the phenotypes.
Glycine, serine and threonine metabolism was correlated with prophylactic calcitriol soaking and its anti-mycobacterium/anti-inflammatory effects
To further infer the underlying pathways of the altered metabolites, we performed pathway analysis by using the module implemented in the MetaboAnalyst web portal (Fig. 4b-c). Pathway analysis from the 22 altered metabolites co-varied with the dose-gradients of calcitriol (Fig. 4b) suggested that three pathways were significantly altered, including glycine, serine and threonine metabolism (hypergeometric test, P = 9.32E-5), beta-alanine metabolism (hypergeometric test, P = 0.029), and histidine metabolism (hypergeometric test, P = 0.021). Pathway analysis from the 7 altered metabolites co-varied with bacterial load and inflammatory factors (Fig. 4c) suggested that glycine, serine and threonine metabolism was significantly altered (hypergeometric test, P = 0.0049). Glycine, serine, and threonine metabolism was predicted by both group of metabolites, with 4 metabolites (Betaine, L-Threonine, L-Allothreonine, and Guanidoacetic acid, Fig. 4d, name in pink) co-varied with the dose gradients of calcitriol and 3 metabolites (Choline, Dimethylglycine, and Creatine, Fig. 4d, name in blue) co-varied with the bacterial load and the inflammatory factors. These results indicated that alteration in glycine, serine and threonine metabolism was induced by prophylactic calcitriol soaking and was in response to the dose-dependent anti-mycobacterium and anti-inflammatory effects, suggesting a potential role of the pathway in host-microbe interactions.