Reagents
The following reagents were used in this study: recombinant human GDF-15/MIC-1 (Cat. No. 120-28c; PeproTech, NJ, USA); lipopolysaccharides (Cat. No. 2631 and 4391; Sigma-Aldrich, St Louis, MO, USA); GDF15 Antibody (H-2) (sc-515675; Santa Cruz Biotechnology Inc., Shanghai, China ); mouse GDF15, cTn-I, MDA, and BNP assay kits (Elabscience, Wuhan, China); Iron Colorimetric Assay
Kit was obtained from APPLYGEN company (Beijing, China). FerroOrange (F374), and FerroGreen (M489) (Dojindo Laboratories, Kumamoto, Japan); primary antibodies against GDF15 (27455-1-AP), SLC7A11 (26864-1-AP), and GAPDH (10494–1-AP) (Proteintech Group, Inc., Rosemont, IL, USA); primary antibodies against COX2 (12282S), p-STAT3 (9145S), STAT3 (12640S), p-JAK2 (4406S), JAK2 (3230S) and MitoTracker Green FM (9074P) (Cell Signaling Technology, Boston, MA, USA); primary antibodies against GPX4 (AB125066), and SOCS1 (AB280886) (Abcam, Cambridge, MA, USA); goat anti-mouse (ZB-2305), goat anti-rabbit (ZB-2301), and rabbit anti-goat (ZB-2306) secondary antibodies (ZSGB Biotechnology, Beijing, China).
Animal Model and Treatment
C57BL/6 male mice (8 weeks old), weighing approximately 25 g, were obtained from the Experimental Animal Center of the Air Force Military Medical University. The mice were conditioned in-house for 1 week after arrival with tap water and a commercial diet available ad libitum. All animals were housed in cages with a 12 h light/dark cycle at 25°C.
In the first experiment, mice were randomly assigned to five groups (n = 15 for each group): (a) Con; (b) Con + GDF15; (c) Sepsis; (d) Sepsis + GDF15 (GDF15, 0.1 mg/kg/d); and (e) Sepsis + Ab-GDF15 (Ab-GDF15, 40 µg/mouse/d). GDF15 and Ab-GDF15 doses were designed as previously described [20]. The sepsis model was established by intraperitoneal injection of 10 mg/kg of LPS [6]. In the Con + GDF15 and GDF15 groups, GDF15 was administered via tail vein injection for 3 consecutive days before modeling. In the Ab-GDF15 group, Ab-GDF15 was administered via intraperitoneal injection for 3 consecutive days before modeling. The other groups received the same volume of saline.
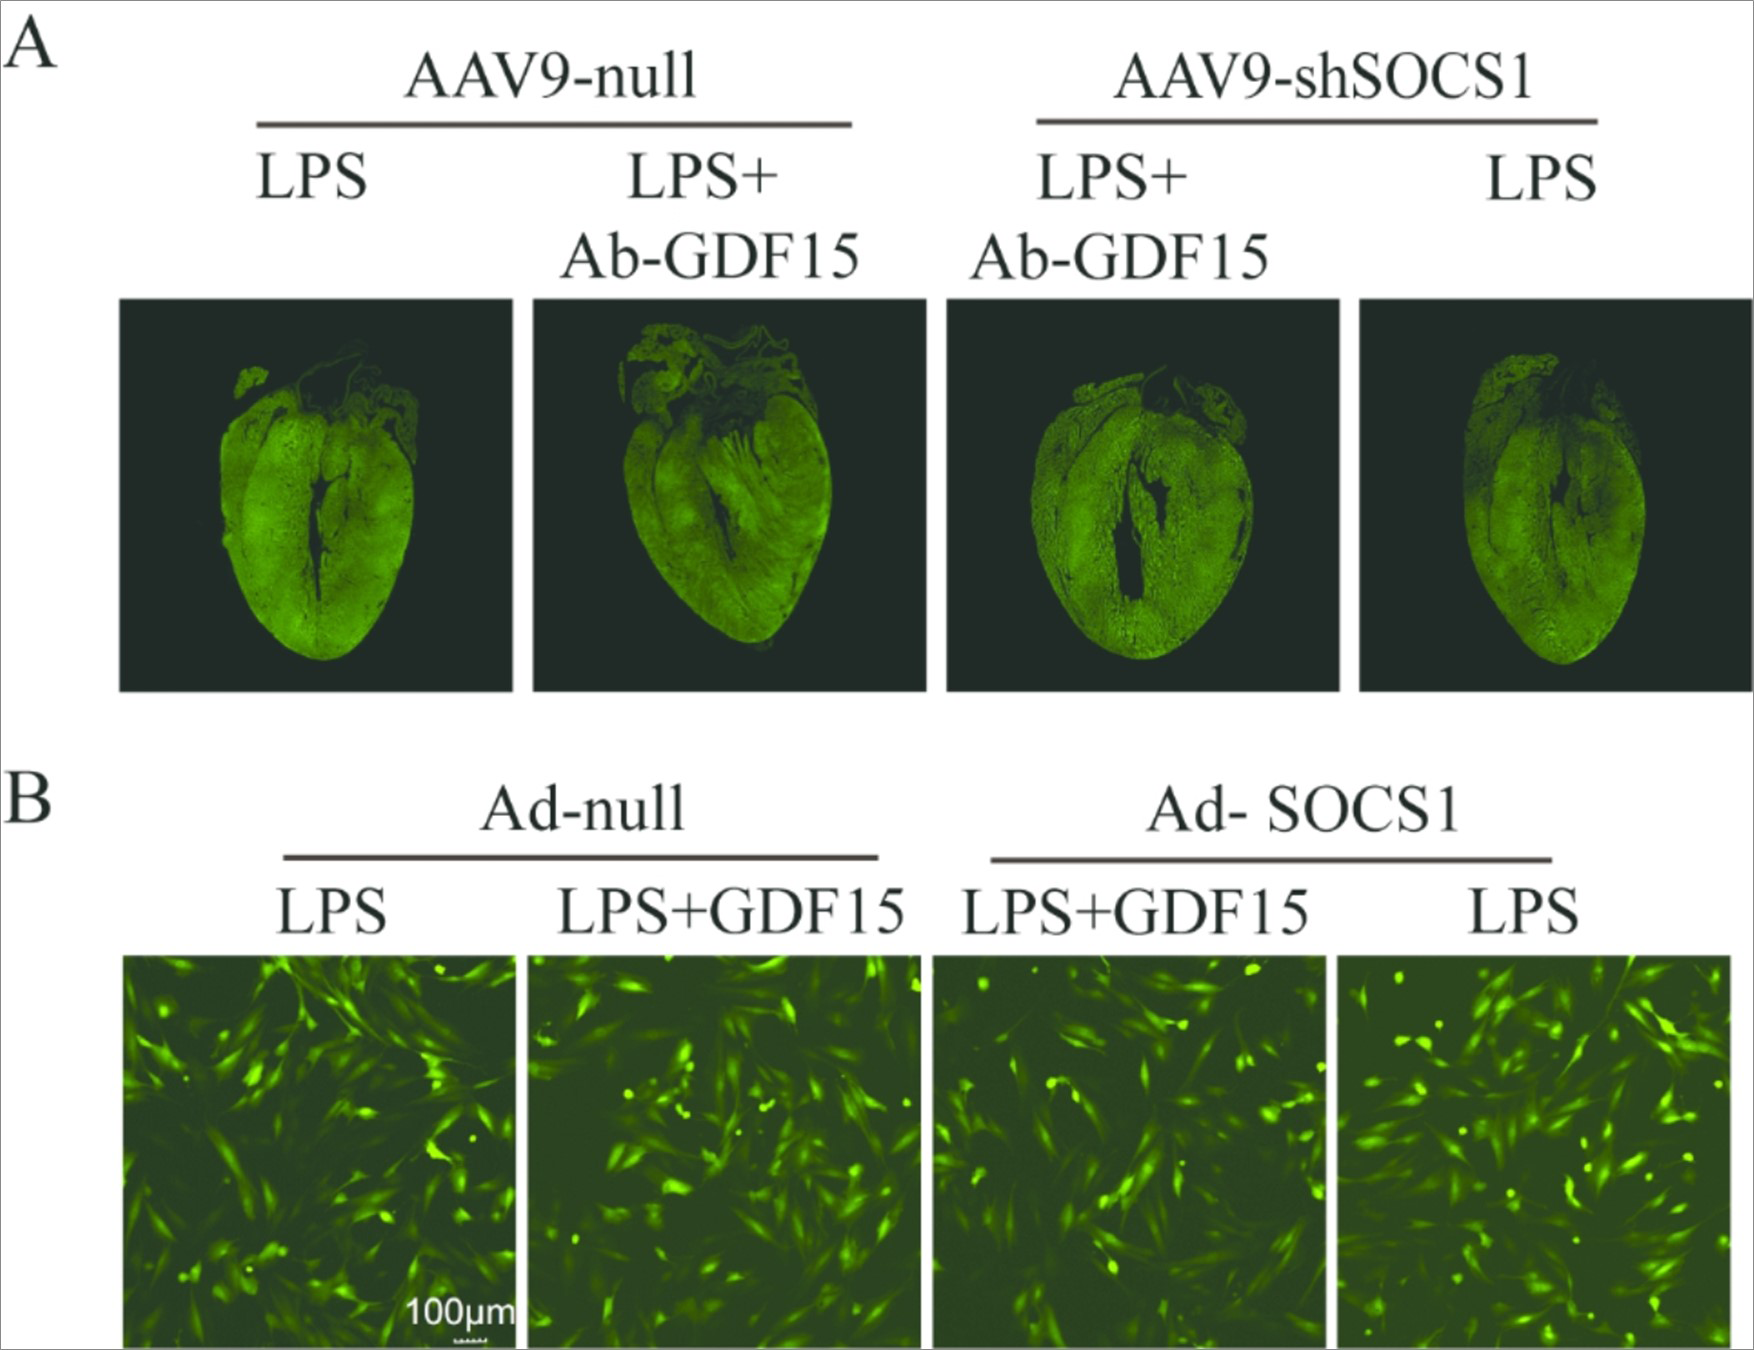
For the second experiment, mice were randomly assigned to four groups : (a) Sepsis + AAV9-null, (b) Sepsis + Ab-GDF15 + AAV9-null, (c) Sepsis + Ab-GDF15 + AAV9-shSOCS1, and (d) Sepsis + AAV9-shSOCS1. AAV9 vectors were synthesized by Hanbio (Shanghai, China). AAV9-CTNT-null and AAV9-CTNT-shSOCS1 concentrations were 1.8×10¹² vg/mL. Three weeks before modeling, each mouse was administered 100 vl of a virus carrying a cardiac troponin T (cTnT) promoter via tail vein injection.
Cell Culture and Treatment
Primary cardiomyocytes were extracted from the myocardium of 1- to 2-day-old SD rats [21]. Cells were cultured in DMEM/F12 complete medium supplemented with 10% fetal bovine serum and 1% penicillin/streptomycin at 37 °C and 5% CO2. Primary cardiomyocytes were cultured in serum-free media for 6 h before treatment. To simulate injury conditions in vitro, LPS (10 µg/mL) [22, 23] was used to stimulate cardiomyocytes for 12 h after culturing in serum-free media. The first experiment was divided into four treatment groups: (a) PBS; (b) GDF15 with PBS (PBS + GDF15); (c) LPS; and (d) GDF15 with LPS (LPS + GDF15). The GDF15 concentration was 100 ng/mL [20]. To explore the specific molecular mechanism of the protective effect of GDF15 on the myocardium of septic mice, follow-up experiments were conducted with the following treatment groups: (a) LPS + Ad-null; (b)LPS + GDF15 + Ad-null; (c) LPS + GDF15 + Ad-SOCS1; and (d) LPS + Ad-SOCS1. Adenoviruses were synthesized by HanBio Therapeutics. The cardiomyocyte multiplicity of infection was 100.
Echocardiographic Assessment
Twelve hours after LPS injection, the mice were anesthetized and underwent transthoracic echocardiography to evaluate their cardiac function, as described previously [23]. M-mode echocardiograms were performed using a VisualSonics 2100 echocardiograph (FUJIFILM VisualSonics, Toronto, ON, Canada) equipped with a 30-MHz transducer. Subsequently, the cardiac function parameters, including LVEF and LVFS et al, were calculated using Vevo LAB 3.1.0 software (FUJIFILM VisualSonics).
HE Staining
As previously reported [24], mice cardiomyocytes were fixed in 4% paraformaldehyde for 72 h and then paraffin embedded. The heart tissue was cut into 5-µm thick slices and stained with HE to observe changes in the myocardial structure. Sections were observed under a light microscope (Olympus FV1000, Olympus Life Science, Tokyo, Japan).
Immunofluorescence Staining
Immunofluorescence experiments were performed for molecular localization, qualitative, and semi-quantitative analyses. After sections underwent deparaffinization and antigen retrieval, a circle was drawn. After serum blocking, the primary antibody was added and incubated overnight at 4 ℃, away from light. Sections were incubated with the secondary antibody and then DAPI to mark the nuclei. Finally, the slide was sealed for microscopic examination and photography (Olympus FV1000).
Immunohistochemical Staining
Cardiac tissues were paraffin embedded and incubated overnight at 37°C. The sections were then deparaffinized, incubated with 3% hydrogen peroxide for 15 min, microwave heated, and naturally cooled for 40 min. Samples were incubated with anti-4-HNE, followed by the secondary antibody and DAPI. The slide was sealed for microscopic examination and photography (Olympus FV1000).
Measurement of ROS
Fresh heart tissue was immediately frozen and sliced at -80 ℃, followed by the addition of tissue autofluorescence quenching agent. The frozen sections were incubated with the ROS fluorescent probe at 37°C for 30 min, the nuclei were stained with DAPI, and the sections were sealed. Myocardial ROS levels were measured and quantified using fluorescence microscopy [25].
Serum Markers of Myocardial Injury
To determine changes in serum markers of myocardial injury, cTnI and BNP levels were assessed using ELISA kits. The ratio for cTnI and BNP serum dilutions were based on previous reports [7, 26]. Values were measured by spectrophotometric analysis using a Spectramax M5 instrument (Molecular Devices).
Quantitative Real-Time PCR (Qrt-PCR)
Total RNA was extracted from tissues using the TRIzol reagent (Invitrogen, Carlsbad, California, USA) and reverse-transcribed to cDNA using the PrimeScript RT reagent kit (Takara Bio, Otsu, Japan). PCR was performed using TB Green Premix Ex Taq II (Takara Bio) and analyzed using an ABI 7300 system (Applied Biosystems). mRNA abundances of target genes were normalized to β-actin level and calculated using the standard 2−△△Ct method. The primer sequences were as follows:
SOCS1: F5’-GTCCTGCCGCCAGATGAG-3’, R5’-GAGACAGAGGCAGTGAGCC-3’
HAMP: F5’-AGGGCAGACATTGCGATACC-3’, R5’-GCAACAGATACCACACTGGGA-3’
IFNG: F5’-AGACAATCAGGCCATCAGCAA-3’, R5’-GTGGGTTGTTGACCTCAAACT-3’
CNTF: F5’-TTTAGGGGATGGCTTTCGCA-3’, R5’-AGGCCTTGATGTTTTACATAAGATT-3’
GAPDH: F5'-TGTTCCTACCCCCAATGTGT-3', R5'-CCCTGTTGCTGTAGCCGTAT-3'
Detection of Intracellular Iron
To measure intracellular ferrous content, primary cardiomyocytes were seeded in laser confocal dishes and washed thrice with serum-free medium after adherence. The cells were treated with LPS or GDF15 and Ad-SOCS1 for 12 h. After washing thrice, 200 nM MitoTracker was added, and the cells were incubated for 20 min in the dark. After washing thrice, a 1 µmol/L working solution of FerroOrange was added and incubated at 37 ℃ and 5% CO2 in the dark, followed by nuclear staining with DAPI after 30 min. Finally, cells were observed under light excitation [27, 28]. Primary cardiomyocytes were stained with FerroGreen following a similar procedure, except 1 mmol/L of FerroGreen working solution was used [28].
Western Blotting
Proteins were extracted from tissue and cell samples by RIPA buffer homogenization, separated by 10% sodium dodecyl sulfate-polyacrylamide (SDS-PAGE) gel electrophoresis, and transferred onto polyvinylidene fluoride (PVDF) membranes. Membranes were incubated with primary antibodies at 4°C overnight using a 5% skim milk blocking solution at room temperature for 2 h. Next, the membrane was rinsed with TBST and incubated at room temperature with a horseradish peroxidase (HRP)-conjugated secondary antibody for 2 h. Finally, protein bands were visualized by enhanced chemiluminescence (Millipore, Billerica, MA, USA) using the ChemiDoc Imaging System (Bio-Rad Laboratories, Hercules, CA, USA). The target protein density was analyzed using Image Lab software (Bio-Rad Laboratories).
RNA Sequence Analysis
After cardiomyocytes from the Sepsis and Sepsis + Ab-GDF15 groups were collected, the total myocardial RNA was extracted using TRIzol reagent (#15596018; Life Technologies, Jiang Su, China). The sample RNA was quantified, and RNA sequencing was performed with three replicates per group. The total library construction and sequencing were performed by Baiqu Company (Shanghai, China). A difference multiple fold change (FC) of ≥2 was used as the change threshold, with a q-value of 1 and p-value < 0.05. Groups were compared for differentially expressed genes using gene, GO enrichment, and Kyoto Encyclopedia of Genes and Genomes (KEGG) pathway enrichment analyses.
Cell Viability
The cell viability was determined using CCK-8. After centrifugation, approximately 7 000 cells/well were inoculated in a 96-well plate. The CCK-8 (10 µL/well) reagent was added to the medium at the specified time. After incubation for 1 h, the cell viability was determined by measuring the absorbance at 450 nm using the SpectraMax M5 instrument (Molecular Devices, CA, USA). Experiments were repeated in triplicate [29].
Statistical Analysis
Data were analyzed and plotted using GraphPad Prism software (version 9.5.1). Continuous variables are expressed as mean ± standard error of the mean, with at least 6 mice in vivo and 3 independent experiments in vitro. Differences between groups were analyzed using one-way analysis of variance, followed by Tukey’s post-hoc test for multiple comparisons. P-values < 0.05 were considered statistically significant.