Subjects recruitment
The 2012 revised Atlanta classification stratified the clinical severity of AP patients into three categories: mild AP (MAP), moderately severe AP (MSAP), and severe AP (SAP) [3]. All the patients with a diagnosis of AP based on the 2012 Revised Atlanta Classification and admitted to Peking Union Medical College Hospital, Beijing, China were eligible for inclusion if they were enrolled within 48 hours of the onset of symptoms. A total of three MAP, three MSAP, and three SAP patients were included. None of AP patients had been treated in other hospitals before admission.
Healthy control population
The healthy control population (HCR) were three healthy volunteers (community workers and students) identified from Peking Union Medical College Hospital. They were age, gender and BMI matched to the patient population and selected after the completion of the patient study. We used the same definition of the HCR group with our previous work [9].
Exclusion criteria
AP patients and HCR were excluded if they took antibiotics, probiotics, Chinese herbs, steroids, and other substances that may affect the structure of the flora in up to eight weeks prior to sampling. Other exclusion criteria referred to patients with a history of immunodeficiency, allergy, asthma, celiac disease, colorectal cancer, diabetes, HIV, inflammatory bowel disease, irritable bowel syndrome, gastroenteritis, necrotizing enterocolitis, and arthritis [7].
Written informed consent was obtained from each participant. The institutional review boards of Peking Union Medical College Hospital approved this study (No. JS 1826).
Sample collection
Stool samples are generally considered the reference standard. However, they are not practical to obtain in patients with AP, since they are often afflicted by reduced gastrointestinal motility [12]. Thus, rectal swabs are commonly used instead, as previously described [13]. In this study, microbial DNA was extracted from fecal samples obtained through the rectal swab immediately after admission. All individuals should have an empty stomach (did not eat for 12 hours) before sample collection. The sample of healthy volunteers was collected in the morning. The timing of the rectal swab sampling of AP patients was within 24 hours after disease onset in all individuals. Detailed processes of sample collection were described elsewhere [9].
DNA extraction, library construction and metagenomics sequencing
DNA for metagenomics was extracted from fecal samples by using the E.Z.N.A.® DNA Kit (Omega Bio-tek, Norcross, GA, U.S.) according to the manufacturer’s protocols. The DNA concentration and purity were quantified with TBS-380 and NanoDrop2000, respectively. DNA quality was examined with the 1% agarose gels electrophoresis system. DNA was fragmented to an average size of about 300 bp using Covaris M220 (Gene Company Limited, China) for paired-end library construction. The paired-end library was prepared by using TruSeqTM DNA Sample Prep Kit (Illumina, San Diego, CA, USA). Adapters containing the full complement of sequencing primer hybridization sites were ligated to the Blunt-end fragments. Paired-end sequencing was performed on Illumina HiSeq4000 platform (Illumina Inc., San Diego, CA, USA) at Majorbio Bio-Pharm Technology Co., Ltd. (Shanghai, China) using HiSeq 3000/4000 PE Cluster Kit and HiSeq 3000/4000 SBS Kits according to the manufacturer’s instructions (www.illumina.com). All the raw metagenomics datasets have been deposited into NCBI Sequence Read Achieve database.
Sequence quality control and genome assembly
3’ and 5’ end was stripped using SeqPrep (https://github.com/jstjohn/SeqPrep). Low-quality reads (length<50 bp or with a quality value <20 or having N bases) were removed by Sickle (https://github.com/najoshi/sickle). Reads were aligned to the human genome (version 38) by BWA (http://bio-bwa.sourceforge.net) and any hit associated with the reads and their mated reads were removed. De bruijn-graph-based assembler SOAPdenovo (http://soap.genomics.org.cn) (version 1.06) was used to assemble short reads. K-mers, varying from 1/3~2/3 of reads length were tested for each sample. Scaffolds with a length over 500bp were retained for statistical tests; we evaluated the quality and quantity of scaffolds generated by each assembly and finally chose the best K-mer which yielded the minimum scaffold number and the maximum value of N50 and N90. Then, scaffolds with a length over 500 bp were extracted and broken into contigs without gaps. Contigs were used for further gene prediction and annotation. Open reading frames (ORFs) from each metagenomic sample were predicted using MetaGene (http://metagene.cb.k.u-tokyo.ac.jp/). The predicted ORFs with length being or over 100 bp were retrieved and translated to amino acid sequences using the NCBI translation table (http://www.ncbi.nlm.nih.gov/Taxonomy/taxonomyhome.html/index.cgi?chapter=tgencodes SG1). All sequences from gene sets with a 95% sequence identity (90% coverage) were clustered as the non-redundant gene catalog by the CD-HIT (http://www.bioinformatics.org/cd-hit/). Reads after quality control were mapped to the representative genes with 95% identities using SOAPaligner (http://soap.genomics.org.cn/), and gene abundance in each sample was evaluated.
Differences analysis in microbiota composition
The linear discriminant analysis (LDA) Effect Size (LEfSe) was used to support high-dimensional group comparisons to find biological relevant characteristics. First, the non-parametric factorial kruskal-wallis sum-rank test was used to detect features with significant differential abundance between groups, with biological consistency investigated among subgroups using the Wilcoxon rank-sum test. Finally, the above-obtained data were used for LDA model analysis to rank the relative abundance difference with respect to groups. The significance for each test was set to 0.05.
Analysis of microbiome functional composition
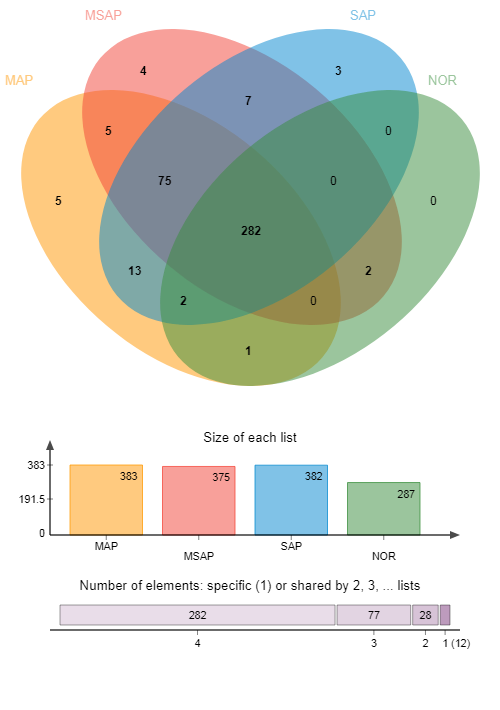
The Venn diagram can be used to count the number of common and unique functions in multiple groups of samples. The relationship diagram of Circos samples and function is a visual circle diagram describing the corresponding relationship between samples and function, which not only reflects the composition ratio of dominant function of each sample, but also reflects the distribution ratio of each dominant function among different samples. In MAP, MSAP, and SAP, Venn diagram and Circos diagram were respectively used to analyze the functional composition of microbiota and the relationship between samples and microbiota functional composition by using R language.
Species annotation of microbiome in the amino acid sequence of non-redundant (NR) proteins database
The NR gene set was compared with the NR database using DIAMOND (http://ab.inf.uni-tuebingen.de/software/diamond/) software to obtain through taxonomic information in the NR database. The species abundance was calculated and counted in various taxonomic level including the Domain, Kingdom, Phylum, Class, Order, Family, Genus and Species to build corresponding taxonomic level abundance of spectrum (abundance profile).
Functional annotation of microbiome in the clusters of orthologous groups of proteins (COG) database
BLASTP (http://blast.ncbi.nlm.nih.gov/Blast.cgi) (Version 2.2.28+) was employed for taxonomic annotations by aligning non-redundant gene catalogs against NCBI NR database with an e-value cutoff of 1e-5. Cluster of orthologous groups of proteins (COG) for the ORFs annotation was performed using BLASTP against eggNOG database (v4.5) with an e-value cutoff of 1e-5.
Functional annotation of microbiome in the kyoto encyclopedia of genes and genomes (KEGG) database
The KEGG pathway annotation was conducted using BLASTP search (http://blast.ncbi.nlm.nih.gov/Blast.cgi) (Version 2.2.28+) against the KEGG (http://www.genome.jp/keeg/) with an e-value cutoff of 1e-5.
Functional annotation of microbiome in the carbohydrate active enzymes (CAZy) database
According to the similarity of amino acid sequence, carbohydrate active enzyme from different species can be divided into carbohydrates glycoside hydrolase (GHs), glycosyl transferase (GTs), polysaccharide lyase (PLs), carbohydrate esterases (CEs), carbohydrate binding modules (CBMs), auxiliary activities (AAs) and other six major protein families. Carbohydrate-active enzymes annotation was conducted using hmmscan (http://hmmer.janelia.org/search/hmmscan) against CAZy database V5.0 (http://www.cazy.org/) with an e-value cutoff of 1e-5.
Functional annotation of microbiome in the Antibiotic Resistance Genes Database (ARDB)
The ARDB (http://ardb.cbcb.umd.edu/) database includes bacterial resistance genes from different environmental sources (such as the intestinal tract), and their resistance spectra, mechanism of action, ontology and other annotation information, providing research basis for the study of drug action. Functional annotation was conducted using BLASTP search (Version 2.2.28+) against ARDB database (http://ardb.cbcb.umd.edu/) with an e-value cutoff of 1e-5.
Functional annotation of microbiome in the comprehensive antibiotic resistance database (CARD)
CARD (http://arpcard. Mcmaster.ca) database contains a wide range of antibiotic resistance-related reference genes from a variety of organisms, genomes and plasmids, which can be used to guide the study of antibiotic resistance mechanisms in human and animal flora groups. Functional annotation was conducted using BLASTP search (Version 2.2.28+) against CARD database (http://ardb.cbcb.umd.edu/) with an e-value cutoff of 1e-5.
Functional annotation of microbiome in the virulence factor database (VFDB)
The VFDB (http://www.mgc.ac.cn/VFs/) is a comprehensive integrated network database for pathogen virulence factor information management. Functional annotation was conducted using BLASTP search (Version 2.2.28+) against VFDB database (http://www.mgc.ac.cn/VFs/) with an e-value cutoff of 1e-5.
Analysis of microbiotafunctional composition difference
Based on the functional composition abundance data, relevant analysis methods were used to detect the functional composition diversity of microbial communities. In this study, the significance test was used to screen different functional compositions of microbiota in MAP, MSAP, and SAP. Detailed screening process was as follows: 1) Wilcoxon rank-sum test was used to test the average rank of the two groups of samples and determine whether there were differences in the distribution of the two samples; 2) multiple inspection and correction method for P value (FDR) was applied; 3) double tail test was used to specify the type of confidence interval desired; 4) Welch T test was used to calculate the confidence interval (confidence: 0.95); 5) The screening criteria is p<0.05.