Ethics statement
This study was approved by the Veterinary Ethical Review Committee at the University of Edinburgh, (reference 64/15). The vaccination program was approved by the Municipal Council of Negombo and the Commissioner.
Study area
Negombo is the biggest city in the Gampaha District, located in the western coast of Sri Lanka. Negombo also constitutes one of the biggest hubs of the country, with a population of 142,136 inhabitants [20].
Mission Rabies 2016 vaccination campaign: period and course of the campaign
A pilot D2D campaign in 2015 was used to demonstrate the feasibility and effectiveness of working protocols. The 2016 campaign was performed between June and September, and covered most of the city, whose area was divided into 33 wards (figure 1), denominated with numbers 1 to 34 and missing number 21. Based on previous information regarding ownership levels from the 2015 pilot campaign [18] and reports from another municipality in Gampaha District [21], a SP stage was included in the campaign. A total of 146 static vaccination points were set up daily in different areas of the city (figure 1), from June 15th to September 1st, giving coloured collars to the animals administered vaccination (Nobivac® Rabies, MSD Animal Health). The SP efforts were complemented by a D2D stage, from September 12th to 28th, in which the staff members covered the entire area of each working zone, vaccinating and marking (with paint and/or a collar) any dogs found on the street and knocking on household doors to offer vaccination to owned dogs. Free-roaming dogs which did not approach the teams willingly were caught using lightweight Balinese-style nets, and restrained securely. All staff members involved in the vaccination process were trained to do so causing the minimum distress to the animals. A survey to assess the vaccination coverage was performed from September 13th to 29th, recording the presence or absence of paint marks and collars on any dogs seen while travelling on every traversable road of each ward using a tuk tuk. Surveys were usually carried the day after the D2D vaccination, otherwise surveys were carried out maximum 2 days after. In 2 wards where the coverage results were below 70%, the vaccination teams were sent for a second round of D2D vaccination and subsequent survey. Survey entries gathered in wards 13, 24, 25, 26, 27, 28, 29, 30 and 34 were collected by a different surveyor, since the original surveying supervisor was not available. Due to the lack of training, entries from these 9 wards were not included in the coverage assessment. Field data during all stages was collected using the Mission Rabies App [22], a web-based platform created for simple management and streamlined entry of field data. The app collected global positioning system (GPS) coordinates and timestamps for each dog vaccinated automatically and offered a path-tracking tool allowing the staff to check their spatial coverage in real time. The app also requested additional relevant data of the dog such as sex, age, health status or neuter status in addition to other information such as the team responsible for the vaccination, the provider of any previous vaccine, and the opinion of owners on matters such as neutering procedures and the reason why they did not bring their dog to a SP.
Data sources
Collection tools and data collected: Field data collected using the Mission Rabies App [22] was compiled into datasets and used for this study. A shapefile containing the specifics of the polygons used by Mission Rabies to divide Negombo in the 33 wards was also provided.
Other sources: Data regarding additional geospatial variables for the regression analysis was obtained from publicly available sources. Weather data for Negombo during the campaign was obtained from the World Weather Online database [23], averaging the tri-hourly measurements for temperature and precipitation during the working hours (6:00-15:00) for each day of the SP campaign. A raster file depicting population density in 2015 (100m resolution) was obtained from WorldPop [24] and used to extract population density at each D2D entry coordinates. Since the raster did not cover the entirety of the working area, entries located outside of the raster’s data grid were applied a buffer averaging the values found in a 550m radius. In the absence of suitable poverty geodata for Negombo, a raster file depicting the number of underweight children under five years old (in the year 2000) with a 2.5-minute resolution was obtained from the Socioeconomic Data and Applications Center [25]. Hunger data for each D2D entry coordinate was extracted from the raster and used as proxy data for poverty. A shapefile containing land types (in 2012) based on the national 7-class classification scheme was obtained from the World Bank Group [26] and used to determine land type for every D2D entry coordinate. The R package ggmap [27] was used to plot all maps, using background tiling sourced from Stamen Design (using data by OpenStreetMap [28]), available under CC BY 3.0 license.
Data analysis
Data manipulation and analysis was performed using the R statistical software environment version 3.4.3. [29]. The use of specific R packages for particular purposes is detailed below:
Identification and management of GPS outliers: The GPS data was checked to detect any erroneous entries caused by coordinate inaccuracy by automated recording systems [30]. These inaccuracies were mostly represented by coordinates ending up outside the visited ward, or in the ocean. These were considered to occur at random, and a system for outlier coordinate detection was created. This system was irrelevant for the SP stage since coordinates for all the vaccination points were known. For the D2D locations, due to the lack of reference coordinates, this discrimination was performed by spatial clustering. Using the dbscan function from the fpc package [31], clusters of vaccination coordinates were determined. The function required 2 parameters to be specified in advance: the size of the epsilon neighbourhood was set at 0.005, and the minimum number of neighbours was set to 3. Clusters containing less than 20% of the total points for a given day and team responsible were considered outliers. The detection system was complemented by a visual screening of the coordinates. At the end of the process, 836 entries were marked as outliers and not included in the regression analysis due to the need for spatial accuracy, however they were included in the vaccination coverage analysis after adjusting their ward according to Mission Rabies working schedules. The assumption that the outliers occurred at random was checked by comparing the distribution of the variables included in the regression model between the outlier non-outlier entries.
Estimation of coverage by ward: Vaccination coverages for each ward were calculated based on the number of dogs marked with a collar or paint sighted during the survey out of the total number of dogs sighted. The 95% binomial confidence interval (CI) was calculated using the binom.test function from base R [29], which carries out an exact binomial test. The over function from the rgeos package [32] was used to match the coordinates from the data with the ward shapefile, which was imported using the rgdal package [33].
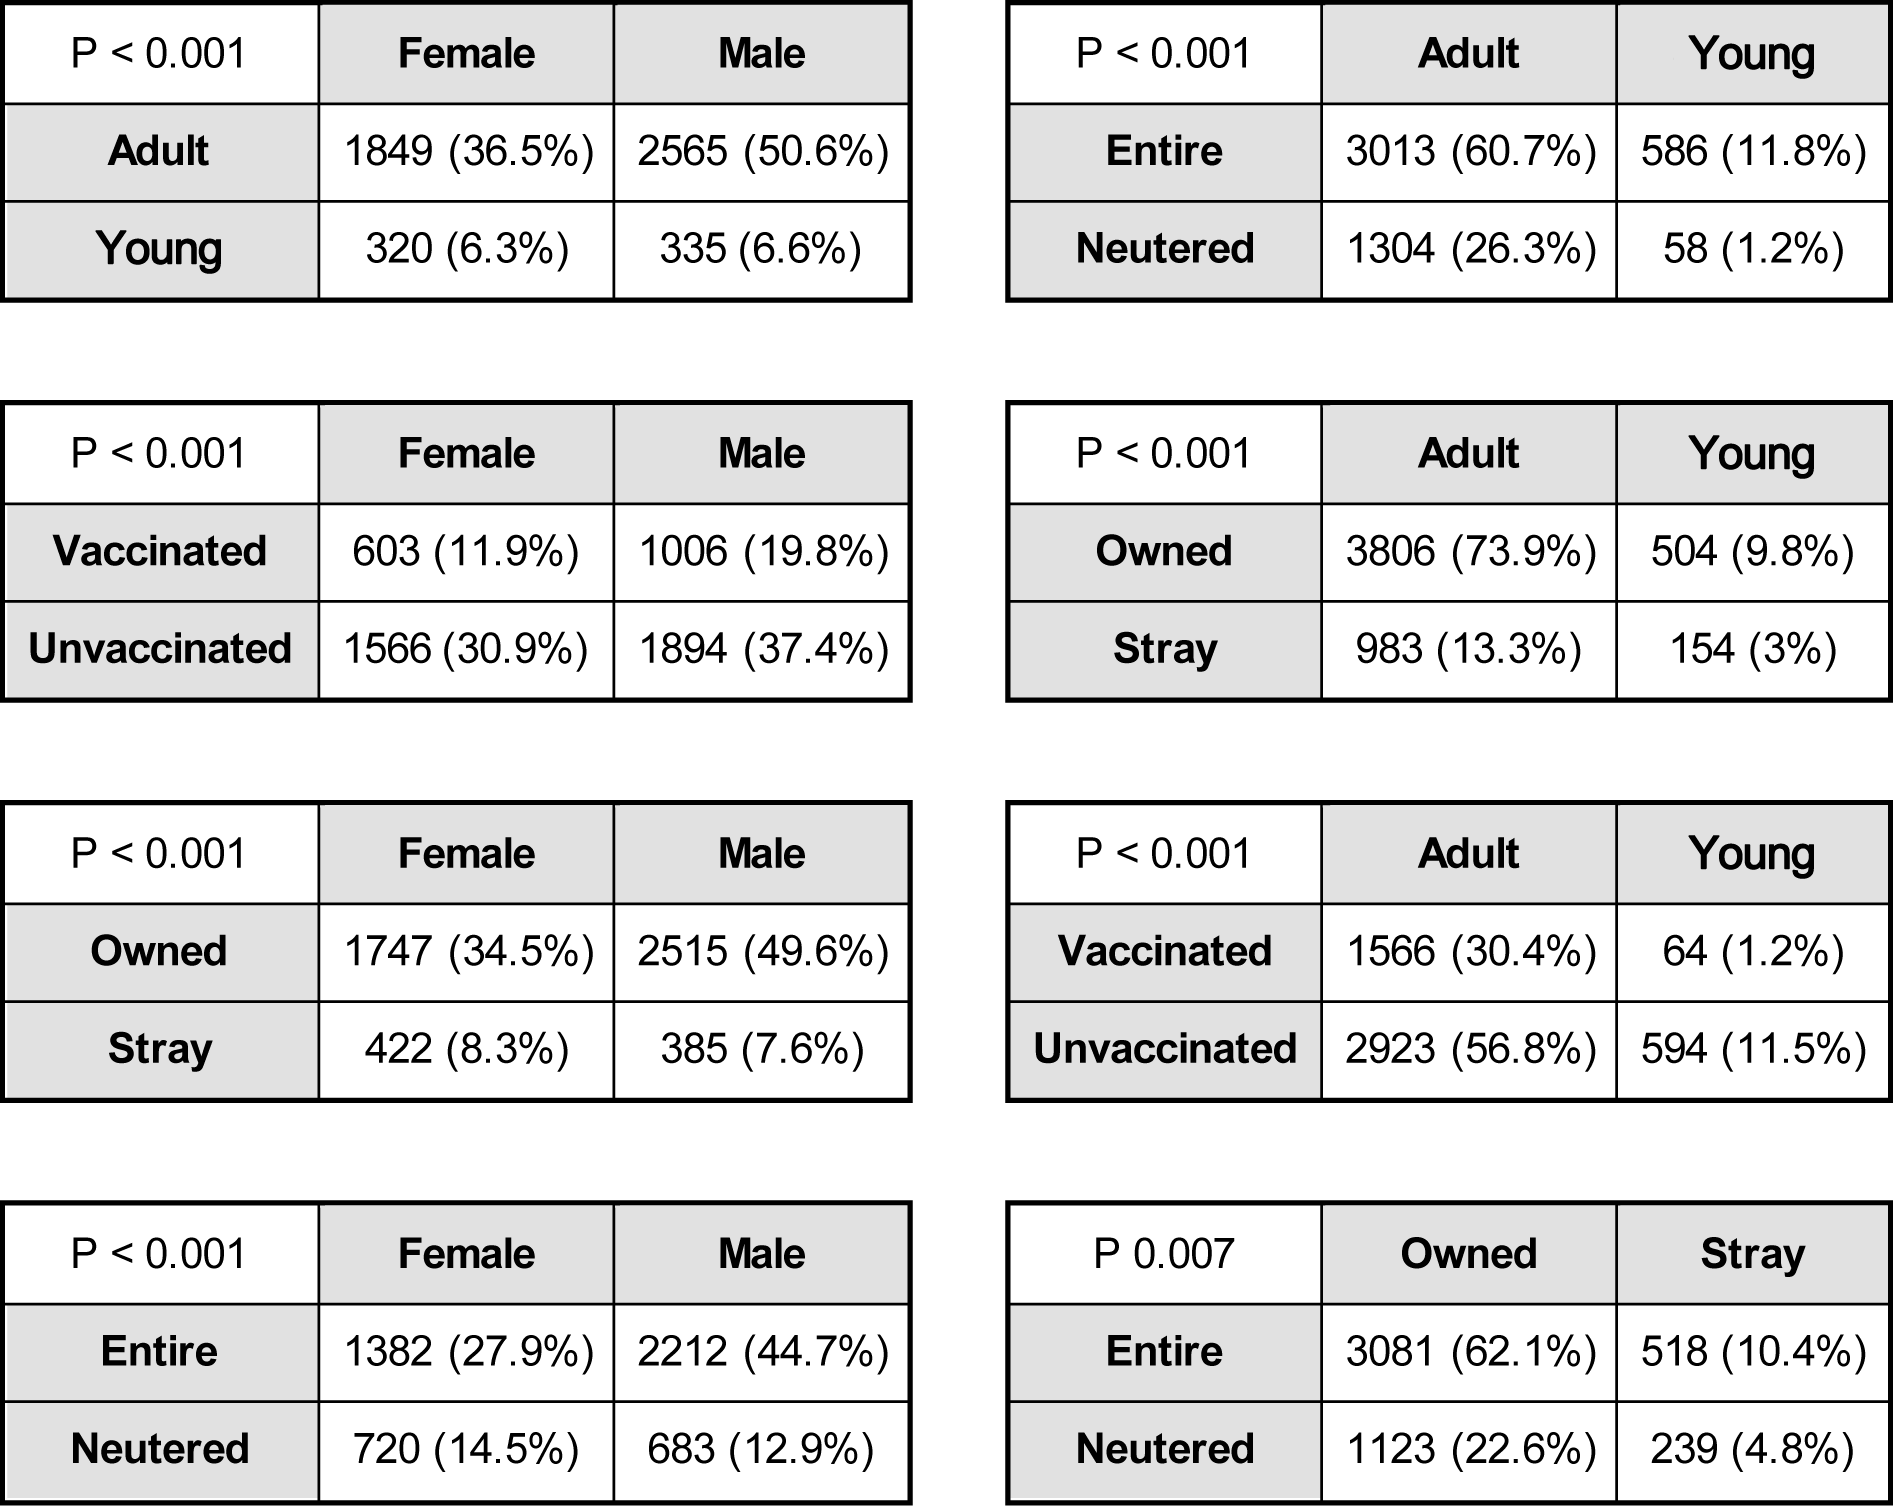
Analysis of dog demographics: The dog population in Negombo was estimated using the Chapman estimator [34] for mark and recapture. The dog population density was calculated using the area for the Mission Rabies working zone (30 km2). The 95% CI for the population size was calculated using the ciChapman function from the recapr package [35], with the default bootstrap method. Data obtained from the D2D stage was used to study the dog demographics on sex, age, ownership and neuter status of the dogs, as it contained information on both the owned and stray populations. In order to determine any relationship between the dog-related variables (sex, age, ownership status, vaccination status and neuter status), the Chi-Squared Test for Independence was used, with a significance level (α) of 0.05. In cases where any of the expected frequencies were lower than 5, the Fisher’s Exact Test was used instead.
Analysis of owner opinions on neutering and failure to attend SP: The answers given by the owners when asked “are you opposed to dog sterilization, and if so why?” and “why didn’t you attend to the SP campaign?” are compiled into a frequency table. Infrequent answers are included under the “Other” category.
Development of the logistic regression model: A logistic regression model analysing the effect of several dog-related and geospatial factors on attendance of owners to SP was built using the glm (generalised linear model) function. Attendance of a dog to SP was defined as the outcome variable, supplied as TRUE/FALSE. For the model, only entries regarding owned dogs found during the D2D stage were considered (4,310 entries), filtering out any coordinate outliers (675 entries). The RANN package [36] was used to determine the closest static vaccination point from each owner’s household. Packages rgdal [33] and raster [37] were used to manipulate shapefiles and raster files, respectively. The linearity of continuous predictive variables was tested using the Box-Tidwell Transformation test [38], and variables “distance to SP” and “precipitation” were transformed into categorical variables as linearity could not be assumed. “Distance to SP” was divided into four quantiles: [2.1 - 126], (126 - 194], (194 - 279] and (279 – 1,100] (distance in metres), whereas the “precipitation” variable was categorized into slight (< 0.5 mm/h), moderate (0.5-4 mm/h), and heavy (>4 mm/h) precipitation, according to the United Kingdom meteorological office [39]. In order to increase the counts of young animals, “juvenile” and “puppy” dogs were merged into “young”, as opposed to “adult” dogs (over one year of age).
Best model selection: A series of different models were built by a mixture of forward and backwards selection using combinations of the relevant explanatory variables and their interactions. After filtering unowned dogs and outlier entries, the dataset was composed of 3,635 entries. To determine the performance of the proposed regression models, this data was randomly partitioned into “training” and “testing” subsets, in a 7:3 ratio, using the vtreat package [40]. This partition allowed to generate the model from the “training” subset, and test its predictive power on the “testing” subset using the caret package [41]. To aid the variable selection process, 5-fold cross validation was used [42], partitioning the “training” data into 5 sets. This process produced goodness of fit estimations (area under the receiving operator curve (AUC)) averaged from the 5 sequential analyses, that allowed for the comparison of the different models in order to select the best. This decision was taken based on two parameters: the AUC, and the Akaike information criterion (AIC) [43]. Once the best model was chosen, its predictive power was determined using the initial “testing” subset by estimating the AUC using the package ROCR [44]. Using the final model, ward and vaccination team were included as random effects through mixed-effects regression. Since their influence on the odds ratios was negligible and for the sake of simplicity, the fixed effects model was chosen.