Clinical characteristics of study participants
None of the patients reported sensor-related problems, such as skin peeling and skin irritation, to warrant dropout/withdrawal from the study. Table 1 lists the clinical characteristics of the study subjects. They comprised 53 subjects (22 males, 31 females). Of these, 23 formed the non-diabetic control group (5 males and 18 females), with a mean age of 43.5±16.5 years (range, 19-88) and BMI of 22.0±3.3 kg/m2. The diabetic group consisted of 30 patients (17 males, 13 females) with a mean age of 68.5±7.4 years (range, 51-79) and BMI of 24.1±3.9 kg/m2, HbA1c of 6.7±0.6% (range, 5.7-7.7), and disease duration of 14.7±11.5 years (range, 1.3-43.0). For the diabetic group, 70% of the patients were using DPP-4 inhibitors and 50% were on biguanides. Among the study group, 6 were insulin users, with 3 using the long-acting basal insulin only, 1 using a mixture formulation of long-acting basal insulin and rapid-acting bolus insulin, and 2 using intensive insulin therapy.
Comparison of the diabetic and control groups
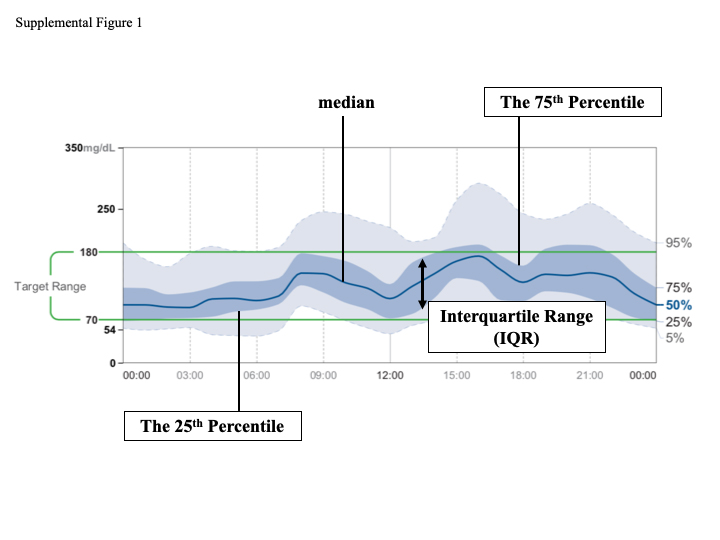
The FGM data of the diabetic group and control group are shown in Supplemental Table. The average IQR (AIQR) was 17.3±4.3 mg/dl for the control group, and significantly higher for the diabetic group (30.1±11.7 mg/dl, p<0.001). The TBR/TIR/TAR were 2.7±5.3/96.1±5.5/1.3±2.1% in the control group and 1.6±2.4/85.8±12.8/12.6±12.5% in the diabetes group. The TIR was significantly lower (p<0.001), while TAR was significantly higher (p<0.001) in the diabetic group. There were no notable differences between the two groups with respect to the minimum, TBR, and LBGI.
Correlation between AIQR and CGM index in the diabetic group
Table 2 summarizes the results of analysis of the correlation between AIQR and CGM metrics in the diabetic group. The AIQR correlated negatively (r=-0.840, p<0.001, Figure 1) with TIR, and positively with maximum, SD, CV, MODD, HGBI, and TAR (p<0.001, each). However, there was no correlation between AIQR and the hypoglycemia indexes of minimum, LBGI, and TBR. Analysis of the data of all 20 patients with hypoglycemia showed a significant correlation between AIQR and TBR (p=0.032, r=0.481).
Comparison of AIQR according to TIR achievement in the diabetic group
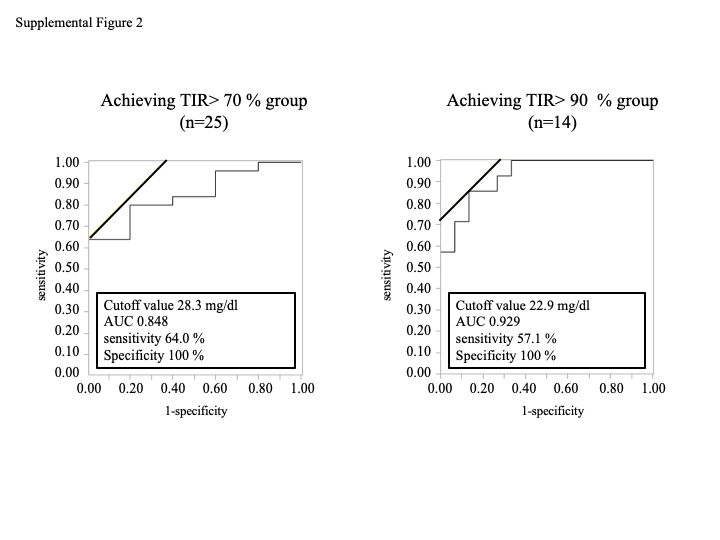
We compared the AIQR of the diabetic group based on the achievement of TIR>70% and TIR>90% (Table 3). The analysis showed 25 patients achieved TIR>70% and 5 patients that did not, while 14 patients achieved TIR>90% and 16 did not. The AIQR of the group that achieved TIR>70% was significantly lower (27.6±9.1 mg/dL) than that of the group that did not (42.2±16.3 mg/dL, p=0.017). Similarly, the AIQR of the group that achieved TIR>90% was significantly lower (22.6±4.8 mg/dL) than that of the group that did not (36.7±12.6 mg/dL, p<0.001).
To evaluate the AIQR cutoff values for the groups that achieved TIR>70% and TIR>90%, ROC curves were generated and the areas under the curves (AUC) were computed. ROC curve analysis showed an AIQR cutoff value of 28.3 mg/dL (AUC=0.848, 95%CI 0.621-0.950) for the group that achieved TIR>70%, and 22.9 mg/dl (AUC=0.929, 95%CI 0.778-0.980) for the group that achieved TIR>90% (Supplemental Figure 2).
Next, we used an AIQR of 28.3 mg/dL as the cutoff value and compared the data with TIR. The TIR was 94.1±4.3% in the AIQR<28.3 mg/dL group and 76.4±12.7% (p<0.001) in the AIQR ≥28.3 mg/dL group. On the other hand, using an AIQR of 22.9 mg/dL as the cutoff value, the TIR were 97.0±2.6% and 82.4±12.7% (p=0.001) for the AIQR<22.9 and ≥22.9 mg/dL groups, respectively (Figure 2).
Comparison of the hypoglycemia and non-hypoglycemia subgroups
Table 4 shows the results of comparison of CGM metrics in the presence of hypoglycemia. Hypoglycemia was noted in 20 of the 30 patients of the diabetic group, and the hypoglycemia indexes of TBR and LGBI were significantly higher in the hypoglycemia group than the non-hypoglycemia group (p<0.001, each). However, there was no notable difference in AIQR in the presence of hypoglycemia. AG, GMI, and TAR were all significantly higher in the non-hypoglycemia group (p=0.005, p=0.005, p=0.037).