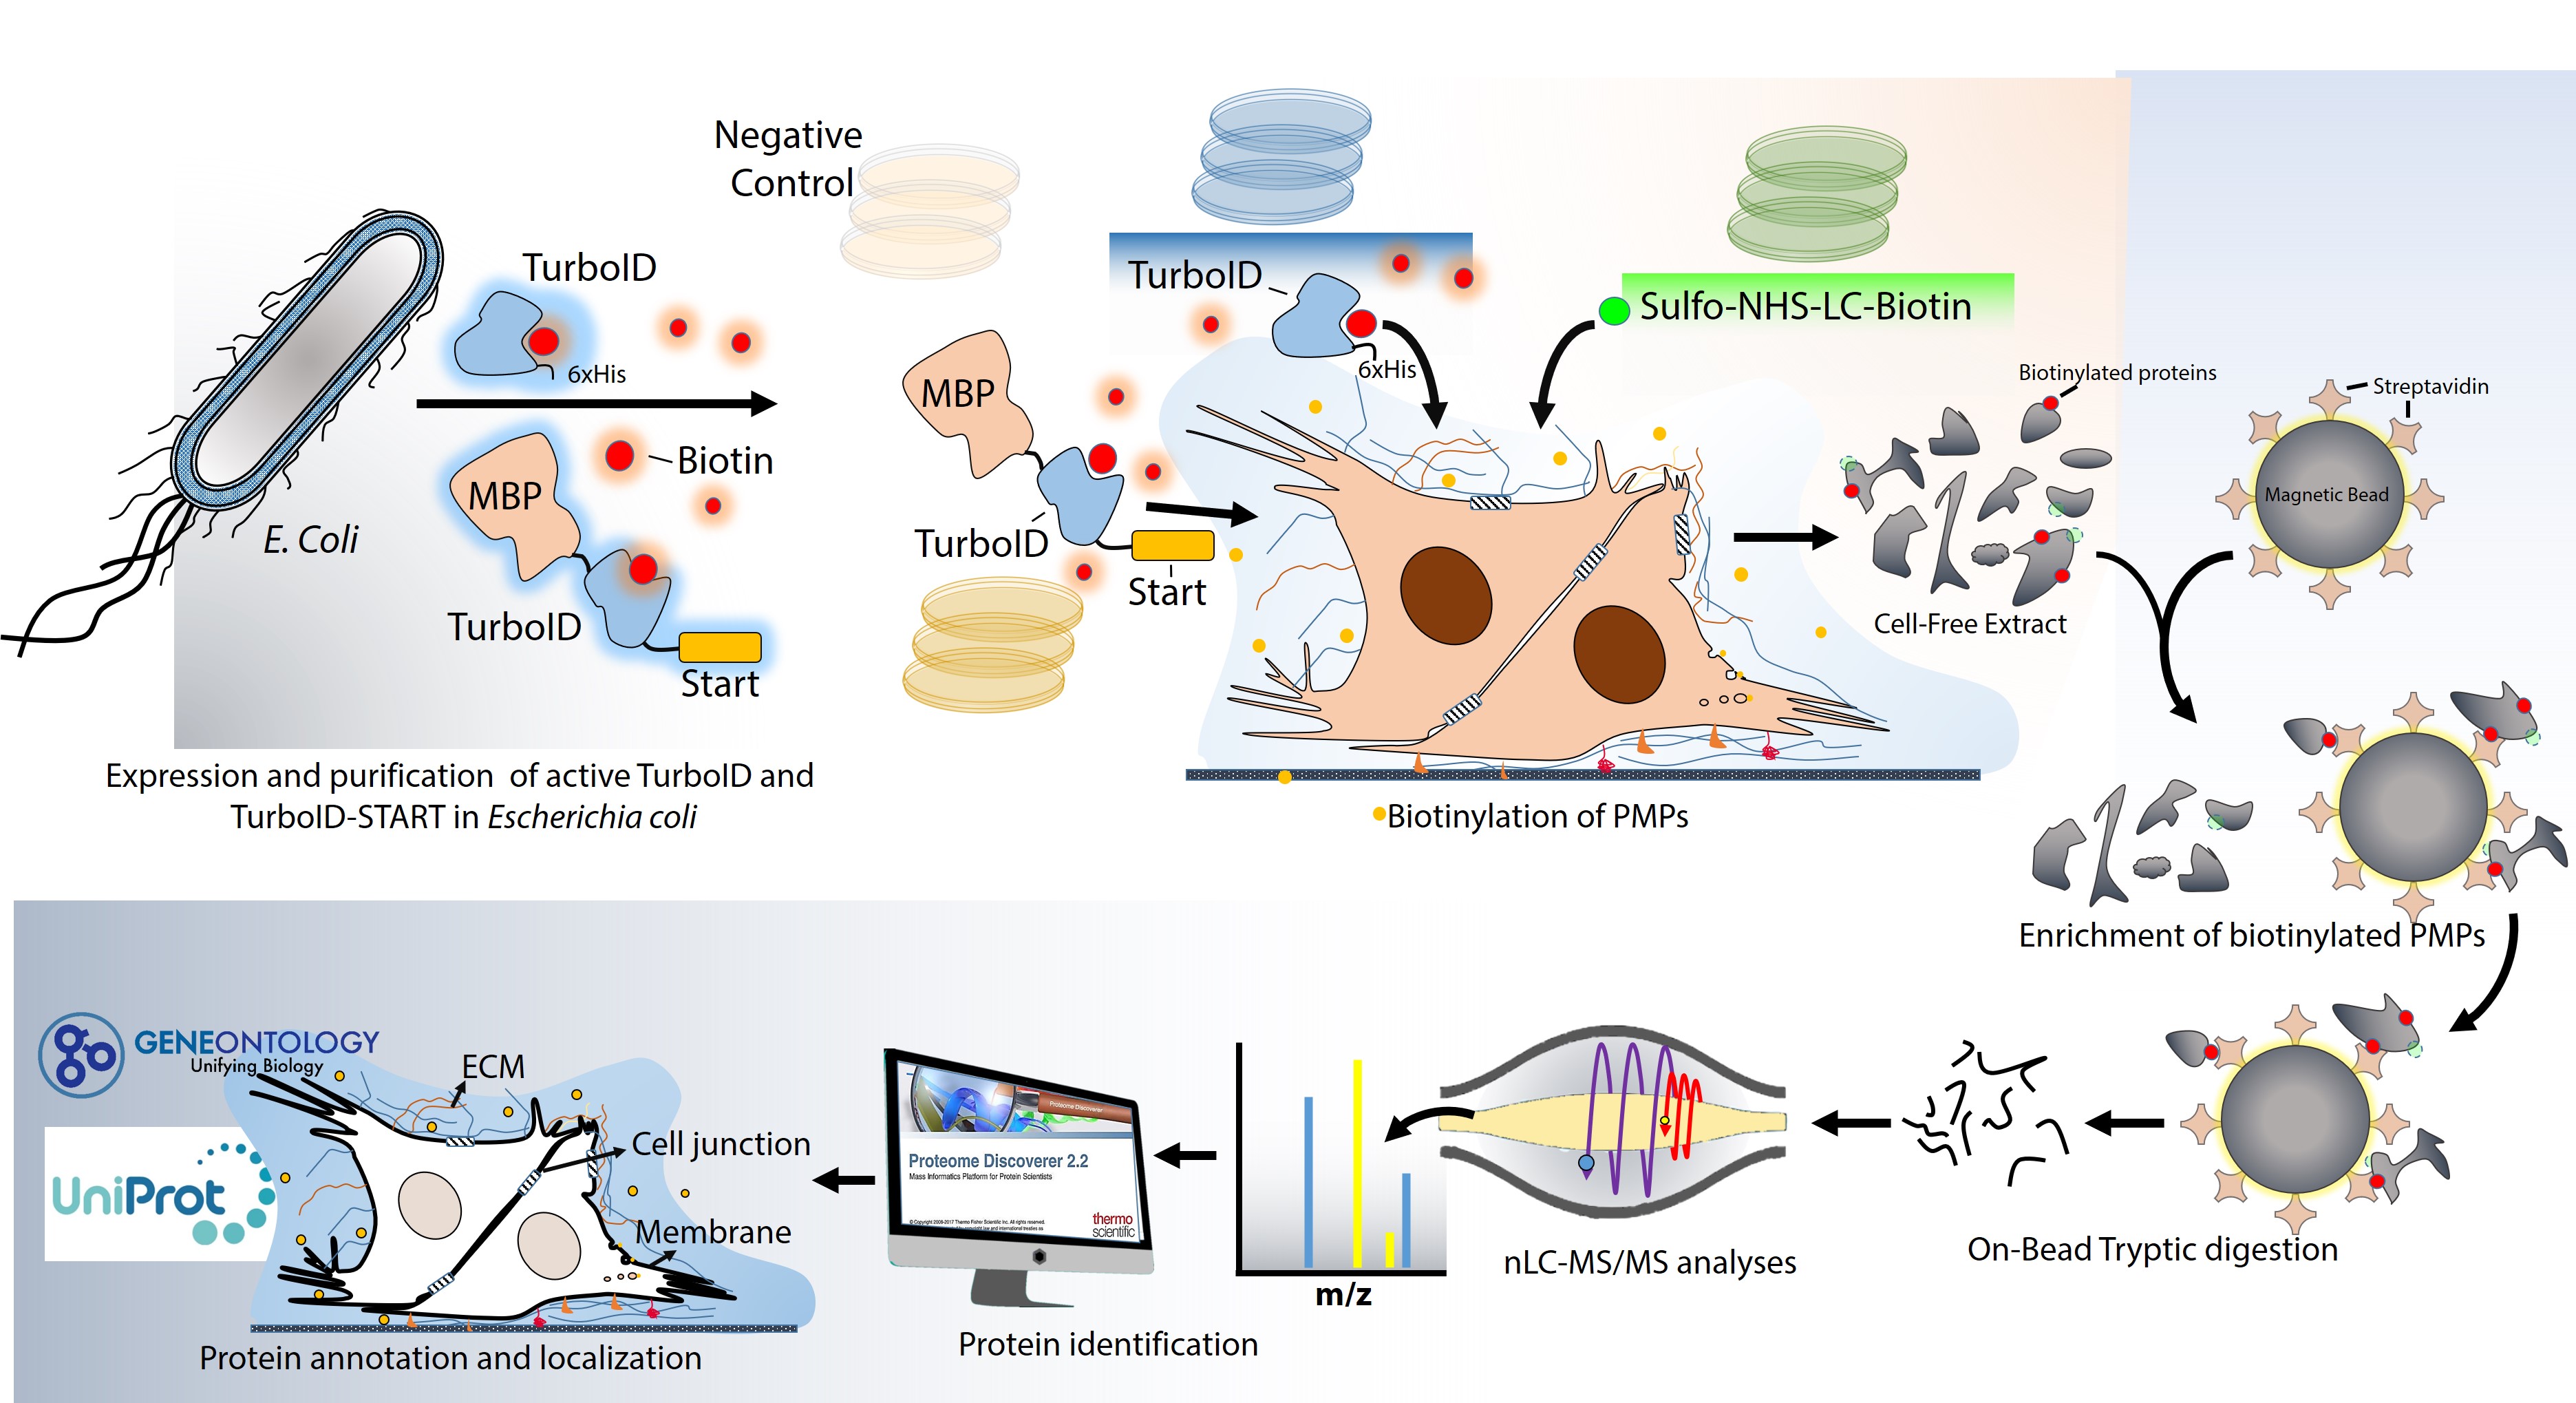
Expression of TurboID and TurboID-START in Escherichia coli
The recombinant expression vector pET21a, harbouring TurboID, was generously provided by Dr. Alice Ting from Stanford University, Department of Chemistry, CA, USA. To express TurboID, the vector was transformed into E. coli BL21 (DE3), and induction was achieved using 0.1 mM IPTG. The synthesis was carried out at 30°C for 2 hr, after which the cells were harvested by centrifugation at 4°C, 4500xg for 10 minutes. For the expression of the TurboID-START fusion protein, the nucleotide sequence encoding the START lipid binding domain (amino acids 112 to 330) of the STARD7 protein was retrieved from NCBI (Accession number: NM_020151.4). Codon optimization was performed using Geneius software from Eurofins Genomics (Ebersberg, Germany). The optimized sequence was synthesized by Eurofins Genomics, cloned into the pEX A258 vector, and sent to our laboratory. Subsequently, the TurboID-START sequence was subcloned into pQE-2 and pMAL-c4X expression vectors.
To express TurboID-START, the recombinant vector was transformed into E. coli BL21 (DE3), and induction was carried out using 0.1 mM IPTG. The synthesis was conducted at 30°C for 2 hr, followed by the harvesting of cells through centrifugation at 4°C, 4500xg for 10 minutes.
Determination of Suitable Lysis Buffer
To determine the most suitable lysis buffer that allowed the highest extraction of TurboID and TurboID-START without loss of activity, six different lysis buffers were tested; RIPA (Thermo Scientific, USA), TPER (Thermo Scientific, USA), BPER (Thermo Scientific, USA), Buffer A (50mM sodium phosphate, 300 mM NaCl, 0.1 mM DTT, pH 8), Buffer B (20mM Tris-HCl, 50 mM NaCl, 1mM DTT, 10% glycerol), and Buffer C (40 mM Tris-HCl, pH 8). The biotinylation activity of TurboID in cell lysates was assessed using CHO cell-free extracts. The level of biotinylation was visualized through western blotting.
Purification of TurboID and TurboID-START
A pre-packed Histrap HP column (Cytiva, USA) coupled to an NGC-chromatography system (Bio Rad, USA) (1 mL bed volume) was used for purification of His-tagged TurboID. An amylose resin-packed column (NEB, USA) was used for purification of MBP-tagged TurboID-START. The instructions recommended by the manufacturers were followed. The purified proteins were stored at -80oC in the presence of 10% glycerol. Right before purified enzymes was used in cell culture experiments, glycerol was removed by dialysis.
A pre-packed Histrap HP column (Cytiva, USA) coupled to an NGC-chromatography system (Bio Rad, USA) with a 1 mL bed volume was used for the purification of TurboID. For the purification of TurboID-START, an amylose resin-packed column (NEB, USA) was used. Both purification processes strictly adhered to the instructions recommended by the respective manufacturers. The purified proteins were stored at -80oC in the presence of 10% glycerol to maintain their stability. Before utilizing purified TurboID in cell culture experiments, glycerol was removed by dialysis.
Cell Cultures and PMP Labelling with Biotin
The cells were cultured in 100 mm dishes under standard culture conditions, maintaining a temperature of 37°C with 5% CO2 and appropriate humidity, following the guidelines recommended by ATCC. For the PMP biotinylation, the cells were washed three times with PBS to eliminate FBS (Fetal Bovine Serum) and other medium additives. The cells were then covered with growth medium containing 0.25 µM of either TurboID or TurboID-START, along with 1 mM ATP, 3 mM MgCl2, and 500 µM biotin. The biotinylation reaction was allowed to proceed for 30 minutes at 37°C. To stop the biotinylation reaction, the cells were transferred onto ice and washed five times with PBS. The chemical biotinylation of PMPs was achieved using a commercially available EZ-link Sulfo-NHS-LC-Biotinylation kit (Thermo Scientific, USA), following the instructions. CHO cells that were not biotinylated by TurboID, TurboID-START, or the chemical method were used as the negative control.
Immunofluorescence Staining
Cells were cultured on poly-L-Lysine coverslips (Corning, USA) to 80% confluency, washed with PBS and fixed with 4% formaldehyde for 20 min before permeabilization with 0.5% Triton-X100 for 2 min. For TurboID-START staining, an anti-BirA antibody was used to visualize the cells with anti-mouse conjugated FITC. As a positive control, an antibody (Abcam, USA) was used for staining of an endogenous PM marker, Na-K ATPase. If an antibody was not needed for staining, the cells were then incubated with Texas Red conjugated Streptavidin- (Thermo Fisher Sci, USA) for 1 hour at room temperature. Nuclei was stained with DAPI for 10 minutes at room temperature. Coverslips were mounted on glass slides with Prolong Diamond Antifade mounting media (Thermo Fisher Sci, USA). The cells were imaged on an Olympus CKx41 microscope equipped with a DP74 digital camera system.
Preparation of Cell-Free Extracts for PMP Enrichment
After biotinylation reactions, the enzymatic labelling reactions were stopped by placing the cells on ice and washing them four times with ice-cold PBS to remove the enzymes and unconjugated biotin. Cells were removed from the flasks using a scraper and ice-cold PBS, then collected by centrifugation at 1500xg for 3 min at 4oC. The supernatant was transferred to a 1.5 mL microcentrifuge tube, and the pellet was resuspended in RIPA lysis buffer (Thermo Scientific, USA) using stainless steel beads with a bullet blender (NextAdvance, USA). Lysates were clarified by centrifugation at 10.000 x g for 10 min at 4 oC. Protein concentrations were measured using the modified Bradford assay (Bio-Rad, USA).
Western Blotting
Proteins were separated by 12% SDS-PAGE, and electrophoretic transfer of proteins onto positively charged nitrocellulose membranes was performed using a semi-dry electrophoretic transfer cell (Bio-Rad, USA) for 30 min at 25 V using 48 mM Tris.Cl buffer at pH 9.2 containing 39 mM glycine, 20% (v/v) methanol and 0.0375 g/L SDS. The membranes were blocked with 5% non-fat dry milk prepared in TBS-T for 1 hr at room temperature. The membranes were then incubated overnight at 4°C with anti-His (Thermo Fisher Scentific, USA) and anti-BirA antibody which recognizes TurboID and TurboID-START (Novus Biologicals, USA) antibodies. HRP-conjugated Streptavidin (Thermo Fisher Scientific, USA) was used to detect biotinylated proteins. A chemiluminescence detection system (Bio-Rad, USA) and ultrasensitive X-ray films (GE Healthcare, USA) were used for band detection.
Quantitation of Biotinylation Activity
The HABA assay was used to quantitate activativities of the purified enzymes. In brief, 20 µg non-biotinylated CHO cell-free extracts were mixed with biotin ligase enzymes (0.25 µM final concentration) and incubated at 37°C for 30 min in 0.5 mM biotin containing PBS. After incubation, the reaction mixtures were transferred on ice to stop the biotinylation reaction. Biotinylated cell-free extracts were transferred to a 96-well ELISA plate and incubated overnight at 4°C to allow the proteins to attach to the plate surface. At the end of the incubation time, the unbound proteins were removed, and the wells were washed three times with 150 µL Tris-HCl pH: 8.0 to remove free biotin and unbound proteins from the wells. Quantitative determinations of the activities of enzymes were achieved using the Pierce™ Biotin Quantitation kit (Thermo scientific, USA). Measurements were made according to the protocol recommended by the manufacturer.
PMP Enrichment Using Streptavidin Coupled Magnetic Beads
Enrichment of biotinylated PMPs was performed as described by Cho et al. (Cho et al., 2020a). Briefly, 100 µL streptavidin-coated magnetic beads (Thermo Fisher Scientific, USA) were washed twice with RIPA buffer and 1 mg cell-free extract was mixed with the beads and incubated overnight with rotation at 4°C. The beads were then washed twice with 1 mL RIPA lysis buffer, once with 1 mL 1 M KCl, once with 1 mL 0.1 M Na2CO3, once with 1 mL 2 M urea in 10 mM Tris-HCl (pH 8.0), and twice with 1 mL RIPA lysis buffer. Each wash was lasted for at least 30 min with rotation. The beads were washed three times with 1 mL of 50 mM ammonium bicarbonate before moving onto on-bead tryptic digestion.
Assessment of Enrichment of Biotin-Labelled Proteins
To assess enrichment of biotin-labeled proteins, a 10 µL sample of biotinylated proteins bound to magnetic beads was mixed with 6X Laemmli loading dye and loaded onto two SDS-PAGE gels. The first gel was subjected to silver staining, which allowed the visualization of the bound proteins. The second gel was transferred to a nitrocellulose membrane for western blotting to visualize the biotinylated proteins. For signal generation, HRP-conjugated streptavidin was used, as it binds specifically to biotin. The bands representing biotinylated proteins were detected using chemo-sensitive X-ray films, enabling the visualization of the enriched biotinylated proteins on the membrane.
On-bead Tryptic Digestion of Biotinylated Proteins
On bead digestions were performed for preparation of samples to LC-MS/MS analysis. Briefly, streptavidin-conjugated magnetic beads carrying biotinylated proteins that were resuspended in 100 µL of 50 mM ammonium bicarbonate containing 5 mM DTT and incubated at 95°C for 5 minutes. After incubation the samples allowed to cool at room temperature and then 10 µL iodoacetamide was added for alkylation. Samples were incubated in the dark at room temperature for 20 min. Then, 4 µL of 50 ng/µl trypsin solution was added onto the resuspended beads and incubated for 3 hours at 37°C with rotating. Another 4 µL of trypsin was added and incubation lasted for overnight at 30°C. The beads were removed by using magnetic stand and peptide-containing solutions were concentrated with a SpeedVac centrifuge (Eppendorf, CT) to dryness before they were resuspended in 0.1% formic acid. The peptide concentrations were measured by Qubit assay (Thermo Fisher Sci, USA).
Protein Identification and Label-Free Quantification by nHPLC LC-MS/MS.
The peptides were analysed by nLC-MS/MS using an Ultimate 3000 RSLC nano system (Dionex, Thermo Scientific, CA, USA) coupled to a Q-Exactive mass spectrometer (Thermo Scientific, USA). The entire system was controlled by Xcalibur 4.0 software (Thermo Fisher Scientific, CA, USA). High performance liquid chromatography (HPLC) separation was performed using mobile phases of A (%0.1 Formic Acid) and B (%80 Acetonitrile + %0.1 Formic Acid). Digested peptides were pre-concentrated and desalted on a trap column. The peptides were then transferred to an Acclaim PepMap RSLC C18 analytical column (75 µm x 25 cm x 2 µm, 100 Å diameter, Thermo Scientific, CA, USA). The gradient applied for separation was 6% for 9 min, 6–22% B for 71 min, 22–44% B for 55 min, 44–90% B for 7 min, 90% B for 8 min and 90 − 6% B for 10 min,6% for 5 min with the flow rate of 300 nL/min in a 160-minute total run time. Full scan MS1 spectra were acquired with the following parameters: resolution 70.000, scan range 250–2000 m/z, target automatic gain control (AGC) 3×E6, maximum injection time 60 ms, spray voltage 2.3 kV. MS/MS analysis was performed by data dependent acquisition selecting the top ten precursor ions. The MS2 analysis composed of collision-induced dissociation (higher-energy collisional dissociation (HCD)) with the following parameters; resolution 17500, AGC 1E6; maximum injection time 100 ms, isolation window 2.0 m/z normalized and collision energy (NCE) 27. The instrument was calibrated using a standard positive calibrant (LTQ Velos ESI Positive Ion Calibration Solution 88323, Pierce, USA) prior to analysis.
Analysis of Mass Spectrometry Data
The collected data were analysed using Proteom Discoverer 2.2 software (Thermo Fisher Sci, USA). The following parameters were used for protein identification; Peptide mass tolerance of 10 ppm, MS/MS mass tolerance of 0.2 Da, mass accuracy of 2 ppm, tolerant miscarriage of 1, minimum peptide length of 6 amino acids, fixed changes of cysteine carbamidomethylation, unstable changes of methionine oxidation and asparagine deamination. The minimum number of peptides identified for each protein was 1 and all extracted spectra were searched against UniProt database containing human reference proteome sequences and human membrane proteome.
Bioinformatics Analyses
Localization of identified proteins were achieved using Gene Ontology (http://geneontology.org/) and Uniprot (https://www.uniprot.org/) databases.
Statistical analysis
Data from HABA tests were analysed with IBM SPSS software version 20.0 (IBM Co., Armonk, NY, USA). The Kolmogorov − Smirnov test and Skewness and Kurtosis values were used to assess the normality of data distributions. The data are expressed as mean ± standard deviation. A value of p < 0.05 was considered statistically significant.