Baseline characteristics
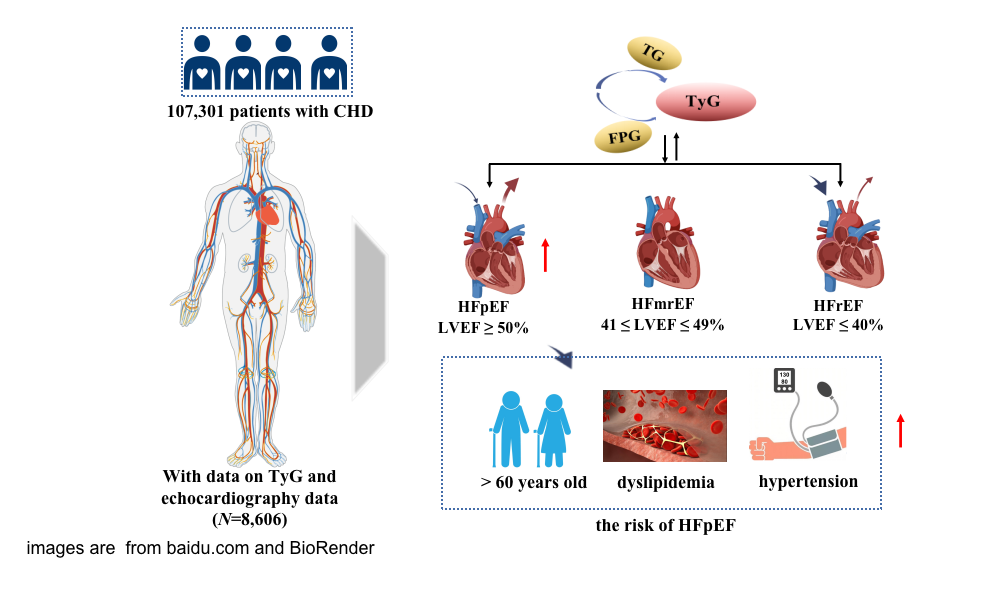
Of these, 8,606 patients underwent echocardiography, among them, 1896 patients had HFpEF. The average age of the participants was 65 years old, and the proportion of male (56.8%) was higher than that of female (43.2%) (Adittional file Table S1). The subjects were divided into three groups according to the tertile level of the TyG index (T1: TyG index < 10.09, T2: 10.09 ≤ TyG index ≤ 10.71, T3: TyG index > 10.71). Generally speaking, FPG, TC, TG, LDL-C, HbA1c, the proportion of HFrEF, HFmrEF, HFpEF, hyperlipidemia, use of antihypertensives, and use of antilipidemic were positively associated with the tertile level of the TyG index, while HDL-C, the proportion of smoking and drinking were negatively associated with the tertile level of the TyG index (Table 1).
Table 1
General characteristics of the study participants according to the TyG index
| Characteristic | TyG index | P-value |
| Total (N = 8,606) | T1 (n = 2,885) | T2 (n = 2,848) | T3 (n = 2,873) |
| Sex, n (%) | | | | | 0.293 |
| Male | 4891 (56.8) | 1629 (56.5) | 1596 (56.0) | 1666 (58.0) | |
| Female | 3715 (43.2) | 1256 (43.5) | 1252 (44.0) | 1207 (42.0) | |
| Age, years, median (IQR) | 64 (58–69) | 64 (58–69) | 64 (59–69) | 63 (58–69) | 0.003 |
| SBP, mmHg, median (IQR) | 140 (125–157) | 140 (124–151) | 140 (127–156) | 140 (128–160) | < 0.001 |
| DBP, mmHg, median (IQR) | 80 (80–90) | 80 (79–90) | 80 (80–90) | 80 (80–90) | 0.263 |
| TyG index, median (IQR) | 10.33 (9.98–10.98) | 9.87 (9.73–9.98) | 10.34 (10.20-10.51) | 11.35 (10.98–11.87) | < 0.001 |
| LVEF, median (IQR) | 62 (59–65) | 62 (59–65) | 62 (59–65) | 62 (58–65) | 0.023 |
| FPG, median (IQR) | 6.22 (5.20–8.59) | 4.92 (4.59–5.20) | 6.23 (5.83–6.78) | 10.34 (8.59–13.40) | < 0.001 |
| HbA1c, median (IQR) | 6.50 (5.70–7.96) | 5.70 (5.30–6.40) | 6.30 (5.70–7.20) | 8.10 (6.80–9.60) | < 0.001 |
| LDL-C, mmol/L, median (IQR) | 2.82 (2.17–3.52) | 2.75 (2.14–3.43) | 2.87 (2.22–3.58) | 2.85 (2.18–3.55) | 0.001 |
| HDL-C, mmol/L, median (IQR) | 1.02 (0.85–1.24) | 1.06 (0.88–1.30) | 1.03 (0.86–1.25) | 0.96 (0.80–1.16) | < 0.001 |
| TG, mmol/L, median (IQR) | 1.38 (1.00-1.97) | 1.24 (0.90–1.70) | 1.39 (1.01–1.96) | 1.55 (1.10–2.28) | < 0.001 |
| TC, mmol/L, median (IQR) | 4.47 (3.68–5.33) | 4.43 (3.65–5.23) | 4.48 (3.71–5.35) | 4.50 (3.68–5.38) | 0.028 |
| Smoking, n (%) | 3088 (35.9) | 1086 (37.6) | 1008 (35.4) | 994 (34.6) | 0.044 |
| Drinking, n (%) | 7410 (86.1) | 2485 (86.1) | 2458 (86.3) | 2467 (85.9) | 0.890 |
| Type of HF, n (%) | | | | | 0.880 |
| HFrEF | 134 (1.6) | 35 (1.2) | 42 (1.5) | 57 (2.0) | |
| HFmrEF | 240 (2.8) | 69 (2.4) | 80 (2.8) | 91 (3.2) | |
| HFpEF | 1896 (22.0) | 531 (18.4) | 645 (22.7) | 720 (25.1) | |
| NYHA, n (%) | | | | | 0.813 |
| I | 130 (1.5) | 42 (1.5) | 38 (1.3) | 50 (1.7) | |
| II | 972 (11.3) | 261 (9.0) | 341 (12.0) | 370 (12.9) | |
| III | 687 (8.0) | 189 (6.6) | 244 (8.6) | 254 (8.8) | |
| IV | 152 (1.8) | 44 (1.5) | 54 (1.9) | 54 (1.9) | |
| Hypertension, n (%) | 7501 (87.2) | 2455 (85.1) | 2494 (87.6) | 2552 (88.8) | < 0.001 |
| Dyslipidemia, n (%) | 5203 (60.5) | 1534 (53.2) | 1685 (59.2) | 1984 (69.1) | < 0.001 |
| Use of antihypertensives, n (%) | 6331 (73.6) | 2083 (72.2) | 2081 (73.1) | 2167 (75.4) | 0.016 |
| Use of antilipidemic, n (%) | 5450 (63.3) | 1823 (63.2) | 1792 (62.9) | 1835 (63.9) | 0.744 |
Data are presented as median (interquartile) or number (proportion, %).
T1: TyG index < 10.09, T2: 10.09 ≤ TyG index ≤ 10.71, T3: TyG index > 10.71.
TyG: triglyceride-glucose index, SBP: systolic blood pressure, DBP: diastolic blood pressure, FPG: fasting plasma glucose, TC: total cholesterol, TG: triglycerides, HDL-C: high-density lipoprotein cholesterol, LDL-C: low-density lipoprotein cholesterol, HbA1c: glycated haemoglobin, IQR: interquartile range.
Association between the TyG index and the risk of HFpEF
As shown in Table 2, logistic regression models were constructed to show that the TyG index was significantly related to HFpEF before and after multivariate adjustment (P < 0.001). When the TyG index was analyzed as a continuous variable, it was significantly associated with HFpEF (OR: 1.56; 95% CI: 1.08–1.23). When the TyG index served as a classified variable, the risk of HFpEF for patients in T3 was 1.47 times greater than the risk for patients in T1. The association of the TyG index and the risk of different types of HF were further evaluated, including HFrEF, HFmrEF, and HFpEF. The results show that the association remained signifcantly different (Adittional file Table S2).
Table 2
Association between the TyG index and the risk of HFpEF
| Variables | HFpEF |
| OR (95% CI)a | P-value | OR (95% CI)b | P-value |
| TyG index | 1.17 (1.10–1.24) | < 0.001 | 1.56 (1.08–1.23) | < 0.001 |
| T1 | Reference | | Reference | |
| T2 | 1.30 (1.14–1.47) | < 0.001 | 1.29 (1.13–1.47) | < 0.001 |
| T3 | 1.50 (1.32–1.71) | < 0.001 | 1.47 (1.30–1.68) | < 0.001 |
| P-trend | | < 0.001 | | < 0.001 |
T1: TyG index < 10.09, T2: 10.09 ≤ TyG index ≤ 10.71, T3: TyG index > 10.71.
aModel 1: adjusted for sex, age;
bModel 2: adjusted for sex, age, smoking, drinking, SBP, DBP, TC, HDL-C, LDL-C, hypertension, hyperlipidemia, use of antihypertensives, and use of antilipidemic.
Association between TyG index and the risk of carotid artery plaques according to sex and age
Association between the TyG index and the risk of HFpEF according to age and sex
were shown in Table 3. After multivariate adjustment, the TyG index of CHD patients was significantly associated with HFpEF in elderly (> 60 years old) patients (OR:1.19; 95% CI: 1.10–1.48). However, there was no independent asociation in the middle-aged (≤ 60 years old) patients (P > 0.05). Regardless of whether it is male or female, this relationship was still statistically significant before and after multivariate adjustment. after multivariate adjustment, the association between the TyG index of female and HFpEF was (OR:1.21; 95% CI: 1.10–1.34), which was higher than that of male (OR:1.11; 95% CI: 1.02–1.21). Multivariate logistic regression analysis showed that the TyG index levels for T2 and T3 were associated with an increased OR for HFpEF when T1 was used as a reference, with the highest association observed for T3 in both female (OR: 1.55; 95% CI: 1.27–2.88) and male (OR: 1.21; 95% CI: 1.10–1.34).
Table 3
Association between the TyG index and the risk of HFpEF according to age and sex
| Group | Variables | HFpEF |
| OR (95% CI)a | P-value | OR (95% CI)b | P-value |
| Age | ≤ 60 | TyG index | 1.06 (0.94–1.20) | 0.320 | 1.05 (0.93–1.19) | 0.438 |
| T1 | Reference | | Reference | |
| T2 | 1.31 (1.01–1.69) | 0.045 | 1.30 (1.00–1.69) | 0.052 |
| T3 | 1.26 (0.98–1.63) | 0.072 | 1.24 (0.95–1.62) | 0.113 |
| > 60 | TyG index | 1.21(1.12–1.30) | < 0.001 | 1.19 (1.10–1.28) | < 0.001 |
| T1 | Reference | | Reference | |
| T2 | 1.29 (1.11–1.49) | 0.001 | 1.28 (1.10–1.48) | 0.001 |
| T3 | 1.59 (1.37–1.84) | < 0.001 | 1.54 (1.33–1.79) | < 0.001 |
| Sex | Male | TyG index | 1.13 (1.04–1.22) | 0.005 | 1.11 (1.02–1.21) | 0.017 |
| T1 | Reference | | Reference | |
| T2 | 1.26 (1.05–1.50) | 0.011 | 1.25 (1.05–1.49) | 0.002 |
| T3 | 1.43 (1.20–1.70) | < 0.001 | 1.40 (1.26–1.67) | < 0.001 |
| Female | TyG index | 1.22 (1.11–1.34) | < 0.001 | 1.21 (1.10–1.34) | < 0.001 |
| T1 | Reference | | Reference | |
| T2 | 1.33 (1.10–1.61) | 0.003 | 1.32 (1.09–1.60) | 0.001 |
| T3 | 1.57 (1.30–1.90) | < 0.001 | 1.55 (1.27–2.88) | < 0.001 |
T1: TyG index < 10.09, T2: 10.09 ≤ TyG index ≤ 10.71, T3: TyG index > 10.71.
aModel 1: adjusted for sex, age, if applicable ;
bModel 2: adjusted for sex, age, smoking, drinking, SBP, DBP, TC, HDL-C, LDL-C, hypertension, hyperlipidemia, use of antihypertensives, and use of antilipidemic, if applicable.
Association between TyG index and the risk of carotid artery plaques according to metabolic status
As shown in Table 4, The association between the TyG index and HFpEF clearly varied in different blood pressure and lipid statesa. After multivariate adjustment, the TyG index of CHD patients was significantly associated with HFpEF in hypertension (OR:1.17; 95% CI: 1.10–1.25) and dyslipidemia (OR:1.16; 95% CI: 1.08–1.23). For both hypertension and dyslipidemia, using T1 as the reference, T2 and T3 were significantly related to the increased risks of HFpEF, and T3 observed the highest association in both hypertension (OR: 1.49; 95% CI: 1.30–1.70) and dyslipidemia (OR: 1.48; 95% CI: 1.29–1.68). Even after multivariate adjustment, this relationship remained significant.
Table 4
Association between the TyG index and the risk of HFpEF according to hypertension and dyslipidemia
| Group | Variables | HFpEF |
| OR (95% CI)a | P-value | OR (95% CI)b | P-value |
| Hypertension | No | TyG index | 1.05 (0.82–1.35) | 0.697 | 1.10 (0.84–1.43) | 0.505 |
| T1 | Reference | | Reference | |
| T2 | 2.12 (1.26–3.58) | 0.005 | 1.89 (1.17–3.40) | 0.011 |
| T3 | 1.65 (0.96–2.83) | 0.072 | 1.67 (0.96–2.96) | 0.068 |
| Yes | TyG index | 1.17 (1.10–1.25) | < 0.001 | 1.17 (1.10–1.25) | < 0.001 |
| T1 | Reference | | Reference | |
| T2 | 1.25 (1.10–1.43) | 0.001 | 1.25 (1.10–1.43) | 0.001 |
| T3 | 1.48 (1.30–1.69) | < 0.001 | 1.49 (1.30–1.70) | < 0.001 |
| Dyslipidemia | No | TyG index | 1.13 (0.84–1.52) | 0.410 | 1.28 (0.89–1.52) | 0.426 |
| T1 | Reference | | Reference | |
| T2 | 1.00 (0.63–1.60) | 0.995 | 0.99 (0.61–1.59) | 0.013 |
| T3 | 1.49 (0.89–2.47) | 0.128 | 1.50 (0.89–2.52) | 0.128 |
| Yes | TyG index | 1.17 (1.10–1.25) | < 0.001 | 1.16 (1.08–1.23) | < 0.001 |
| T1 | Reference | | Reference | |
| T2 | 1.32 (1.16–1.52) | < 0.001 | 1.31 (1.15–1.50) | < 0.001 |
| T3 | 1.51 (1.33–1.73) | < 0.001 | 1.48 (1.29–1.68) | < 0.001 |
T1: TyG index < 10.09, T2: 10.09 ≤ TyG index ≤ 10.71, T3: TyG index > 10.71.
aModel 1: adjusted for sex, age;
bModel 2: adjusted for sex, age, smoking, drinking, TC, HDL-C, LDL-C, hypertension, hyperlipidemia, use of antihypertensives, and use of antilipidemic, if applicable.
Association between TyG index and the risk of carotid artery plaques according to age and metabolic status
As shown in Table 5, The TyG index and HFpEF do not show a significant association according to different blood pressure and lipid statesa in aged ≤ 60 years old CHD patients. Then, After multivariate adjustment, the TyG index of CHD patients was significantly associated with HFpEF aged > 60 years old in hypertension (OR:1.20; 95% CI: 1.11–1.30) and dyslipidemia (OR:1.20; 95% CI: 1.11–1.29). For both hypertension and dyslipidemia aged > 60 years old, using T1 as the reference, T2 and T3 were significantly related to the increased risks of HFpEF, and T3 observed the highest association in both hypertension (OR: 1.54; 95% CI: 1.32–1.80) and dyslipidemia (OR: 1.56; 95% CI: 1.34–1.82). Even after multivariate adjustment, this relationship remained significant.
Table 5
Association between the TyG index and the risk of HFpEF according to age and metabolic status
| Group | Variables | HFpEF |
| OR (95% CI)a | P-value | OR (95% CI)b | P-value |
| ≤ 60 | Hypertension | No | TyG index | 1.25(0.74–2.12) | 0.409 | 1.44(0.78–2.66) | 0.245 |
| T1 | Reference | | Reference | |
| T2 | 5.20(1.65–16.37) | 0.005 | 6.70(1.86–24.18) | 0.004 |
| T3 | 2.56(0.69–9.58) | 0.162 | 3.09(0.72–13.23) | 0.129 |
| Yes | TyG index | 1.05(0.93–1.18) | 0.469 | 1.04(0.91–1.180) | 0.558 |
| T1 | Reference | | Reference | |
| T2 | 1.18(0.90–1.54) | 0.226 | 1.20(0.91–1.57) | 0.189 |
| T3 | 1.18(0.91–1.53) | 0.211 | 1.18(0.90–1.55) | 0.228 |
| Dyslipidemia | No | TyG index | 1.68(0.97–2.90) | 0.065 | 1.63(0.88–3.02) | 0.123 |
| T1 | Reference | | Reference | |
| T2 | 0.73(0.27–1.96) | 0.527 | 0.55(0.18–1.71) | 0.305 |
| T3 | 2.39(0.91–6.24) | 0.076 | 2.34(0.79–6.99) | 0.127 |
| Yes | TyG index | 1.05(0.92–1.18) | 0.478 | 1.03(0.91–1.18) | 0.621 |
| T1 | Reference | | Reference | |
| T2 | 1.37(1.04–1.79) | 0.024 | 1.37(1.04–1.81) | 0.024 |
| T3 | 1.25(0.96–1.63) | 0.104 | 1.22(0.93–1.61) | 0.155 |
| > 60 | Hypertension | No | TyG index | 1.04(0.78–1.38) | 0.802 | 1.06(0.78–1.43) | 0.708 |
| T1 | Reference | | Reference | |
| T2 | 1.54(0.86–2.78) | 0.149 | 1.53(0.83–2.8) | 0.17 |
| T3 | 1.48(0.82–2.69) | 0.195 | 1.50(0.81–2.78) | 0.196 |
| Yes | TyG index | 1.22(1.13–1.32) | < 0.001 | 1.20(1.11–1.30) | < 0.001 |
| T1 | Reference | | Reference | |
| T2 | 1.27(1.09–1.48) | 0.002 | 1.26(1.08–1.47) | 0.004 |
| T3 | 1.59(1.37–1.85) | < 0.001 | 1.54(1.32–1.80) | < 0.001 |
| Dyslipidemia | No | TyG index | 0.97(0.68–1.37) | 0.844 | 0.95(0.67–1.35) | 0.769 |
| T1 | Reference | | Reference | |
| T2 | 1.06(0.62–1.82) | 0.827 | 1.04(0.60–1.81) | 0.89 |
| T3 | 1.23(0.67–2.25) | 0.507 | 1.20(0.65–2.23) | 0.557 |
| Yes | TyG index | 1.22(1.13–1.32) | < 0.001 | 1.20(1.11–1.29) | < 0.001 |
| T1 | Reference | | Reference | |
| T2 | 1.30(1.12–1.52) | 0.001 | 1.29(1.11–1.51) | 0.001 |
| T3 | 1.61(1.38–1.88) | < 0.001 | 1.56(1.34–1.82) | < 0.001 |
T1: TyG index < 10.09, T2: 10.09 ≤ TyG index ≤ 10.71, T3: TyG index > 10.71.
aModel 1: adjusted for sex;
bModel 2: adjusted for sex, smoking, drinking, TC, HDL-C, LDL-C, hypertension, hyperlipidemia, use of antihypertensives, and use of antilipidemic, if applicable.
Association between TyG index and the risk of carotid artery plaques according to sex and metabolic status
As shown in Table 6, The association between the TyG index and HFpEF was similar in CHD patients of different sex under different blood pressure and lipid status. After multivariate adjustment, the TyG index of male CHD patients was significantly associated with HFpEF in hypertension (OR:1.11; 95% CI: 1.02–1.22) and dyslipidemia (OR:1.32; 95% CI: 1.10–1.58). And the TyG index had the same association with HFpEF in hypertension and dyslipidemia among female CHD patients (OR:1.21; 95% CI: 1.09–1.34). After multivariate adjustment, using T1 as the reference, T2 and T3 were significantly related to the increased risks of HFpEF, and T3 observed the highest association. Among male CHD patients. the association between the TyG index and HFpEF in dyslipidemia (OR: 1.45; 95% CI: 1.21–1.73) was higher than those and hypertension (OR: 1.36; 95% CI: 1.13–1.62) among male CHD patients. However, hypertension (OR: 1.55; 95% CI: 1.27–1.89) was higher than hyperlipidemia (OR: 1.51; 95% CI: 1.23–1.85) in female with CHD patients.
Table 6
Association between the TyG index and the risk of HFpEF according to sex and metabolic status
| Group | Variables | HFpEF |
| OR (95% CI)a | P-value | OR (95% CI)b | P-value |
| Male | Hypertension | No | TyG index | 0.97(0.70–1.36) | 0.868 | 1.04(0.73–1.48) | 0.835 |
| T1 | Reference | | Reference | |
| T2 | 2.71(1.22–6.03) | 0.015 | 2.45(1.07–5.61) | 0.035 |
| T3 | 2.11(0.97–4.62) | 0.061 | 2.35(1.03–5.37) | 0.043 |
| Yes | TyG index | 1.13(1.04–1.24) | 0.004 | 1.11(1.02–1.22) | 0.017 |
| T1 | Reference | | Reference | |
| T2 | 1.20(1.00-1.44) | 0.046 | 1.19(1.00-1.43) | 0.056 |
| T3 | 1.40(1.17–1.66) | 0.000 | 1.36(1.13–1.62) | 0.001 |
| Dyslipidemia | No | TyG index | 0.92(0.58–1.47) | 0.727 | 0.94(0.58–1.52) | 0.802 |
| T1 | Reference | | Reference | |
| T2 | 0.54(0.26–1.13) | 0.101 | 0.52(0.24–1.10) | 0.085 |
| T3 | 0.92(0.43–1.99) | 0.833 | 0.99(0.44–2.23) | 0.977 |
| Yes | TyG index | 1.14(1.04–1.24) | 0.003 | 1.12(1.03–1.22) | 0.011 |
| T1 | Reference | | Reference | |
| T2 | 1.33(1.11–1.59) | 0.002 | 1.32(1.10–1.58) | 0.003 |
| T3 | 1.48(1.24–1.77) | 0.000 | 1.45(1.21–1.73) | < 0.001 |
| Female | Hypertension | No | TyG index | 1.17(0.80–1.72) | 0.425 | 1.18(0.77–1.79) | 0.451 |
| T1 | Reference | | Reference | |
| T2 | 1.78(0.88–3.57) | 0.107 | 1.64(0.78–3.44) | 0.193 |
| T3 | 1.30(0.59–2.83) | 0.513 | 1.24(0.54–2.88) | 0.611 |
| Yes | TyG index | 1.22(1.10–1.34) | 0.000 | 1.21(1.09–1.34) | < 0.001 |
| T1 | Reference | | Reference | |
| T2 | 1.30(1.07–1.59) | 0.009 | 1.30(1.06–1.59) | 0.011 |
| T3 | 1.57(1.29–1.92) | < 0.001 | 1.55(1.27–1.89) | < 0.001 |
| Dyslipidemia | No | TyG index | 1.29(0.88–1.89) | 0.189 | 1.30(0.87–1.94) | 0.198 |
| T1 | Reference | | Reference | |
| T2 | 1.55(0.83–2.89) | 0.171 | 1.60(0.83–3.09) | 0.161 |
| T3 | 2.11(1.06–4.20) | 0.034 | 2.23(1.09–4.59) | 0.029 |
| Yes | TyG index | 1.21(1.10–1.34) | < 0.001 | 1.21(1.09–1.34) | < 0.001 |
| T1 | Reference | | Reference | |
| T2 | 1.31(1.07–1.60) | 0.008 | 1.30(1.06–1.60) | 0.011 |
| T3 | 1.53(1.26–1.87) | < 0.001 | 1.51(1.23–1.85) | < 0.001 |
T1: TyG index < 10.09, T2: 10.09 ≤ TyG index ≤ 10.71, T3: TyG index > 10.71.
aModel 1: adjusted for age;
bModel 2: adjusted for age, smoking, drinking, TC, HDL-C, LDL-C, hypertension, hyperlipidemia, use of antihypertensives, and use of antilipidemic, if applicable.